| Param | Original file | Final file |
|---|---|---|
| Filename | modeM0/AS1T04_029T01_9000004582_31458cztM0_level2.evt | modeM0/AS1T04_029T01_9000004582_31458cztM0_level2_quad_clean.evt |
| Size (bytes) | 611,686,080 | 81,835,200 |
| Size | 583.3 MB | 78.0 MB |
| Events in quadrant A | 3,734,390 | 501,470 |
| Events in quadrant B | 6,011,017 | 499,608 |
| Events in quadrant C | 4,085,268 | 482,484 |
| Events in quadrant D | 4,187,502 | 473,888 |
| Mode SS | |||
|---|---|---|---|
| Quadrant | BADHDUFLAG | Total packets | Discarded packets |
| A | 0 | 152 | 0 |
| B | 0 | 152 | 0 |
| C | 0 | 152 | 0 |
| D | 0 | 152 | 0 |
| Mode M9 | |||
|---|---|---|---|
| Quadrant | BADHDUFLAG | Total packets | Discarded packets |
| A | 0 | 12 | 0 |
| B | 0 | 12 | 0 |
| C | 0 | 12 | 0 |
| D | 0 | 12 | 0 |
| Mode M0 | |||
|---|---|---|---|
| Quadrant | BADHDUFLAG | Total packets | Discarded packets |
| A | 0 | 15720 | 3 |
| B | 0 | 23002 | 3 |
| C | 0 | 16704 | 4 |
| D | 0 | 17153 | 3 |
| Quadrant | Total seconds | Saturated seconds | Saturation percentage |
|---|---|---|---|
| A | 7480 | 234 | 3.128342% |
| B | 7481 | 386 | 5.159738% |
| C | 7480 | 345 | 4.612299% |
| D | 7480 | 186 | 2.486631% |
Noise dominated data is calculated using 1-second bins in cleaned event files. If a bin has >2000 counts, and if more than 50% of those come from <1% of pixels, then it is considered to be noise-dominated and hence unusable.
| Quadrant | # 1 sec bins | Bins with >0 counts | Bins with >2000 counts | High rate bins dominated by noise | Noise dominated (total time) | Noise dominated (detector-on time) | Marked lightcurve |
|---|---|---|---|---|---|---|---|
| A | 8705 | 7480 | 0 | 0 | 0.00% | 0.00% | 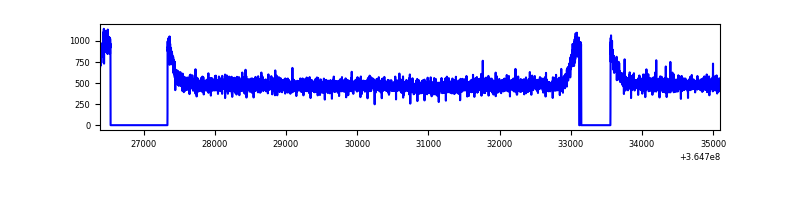 |
| B | 8706 | 7481 | 3 | 3 | 0.03% | 0.04% | 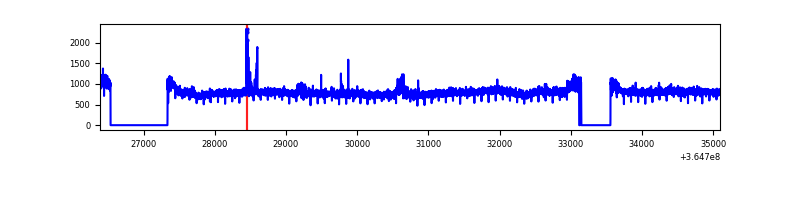 |
| C | 8705 | 7480 | 6 | 6 | 0.07% | 0.08% | 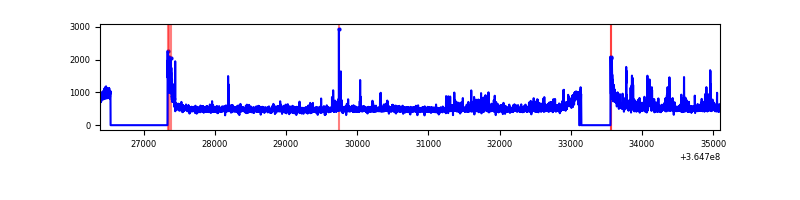 |
| D | 8705 | 7480 | 2 | 2 | 0.02% | 0.03% | 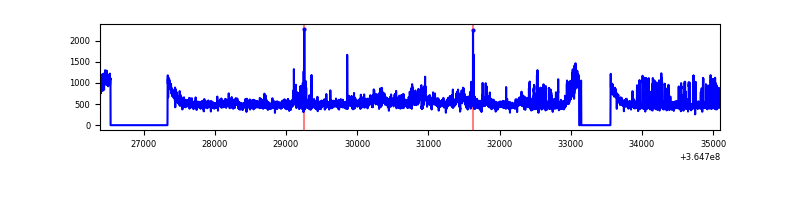 |
Top three noisy pixels from each quadrant. If the there are fewer than three noisy pixels in the level2.evt file, extra rows are filled as -1
| Pixel properties | Quadrant properties | ||||||
|---|---|---|---|---|---|---|---|
| Quadrant | DetID | PixID | Counts | Sigma | Mean | Median | Sigma |
| A | 13 | 254 | 12628 | 59.71 | 967 | 944 | 195.7 |
| A | 3 | 137 | 10486 | 48.76 | 967 | 944 | 195.7 |
| A | 0 | 226 | 8098 | 36.56 | 967 | 944 | 195.7 |
| B | 6 | 159 | 2201545 | 11927.4 | 942 | 918 | 184.5 |
| B | 0 | 190 | 41370 | 219.25 | 942 | 918 | 184.5 |
| B | 12 | 1 | 41130 | 217.95 | 942 | 918 | 184.5 |
| C | 3 | 233 | 180111 | 827.08 | 915 | 922 | 216.7 |
| C | 14 | 238 | 152993 | 701.91 | 915 | 922 | 216.7 |
| C | 0 | 10 | 108456 | 496.35 | 915 | 922 | 216.7 |
| D | 8 | 195 | 635675 | 2866.27 | 933 | 910 | 221.5 |
| D | 2 | 234 | 25114 | 109.29 | 933 | 910 | 221.5 |
| D | 5 | 233 | 23870 | 103.68 | 933 | 910 | 221.5 |
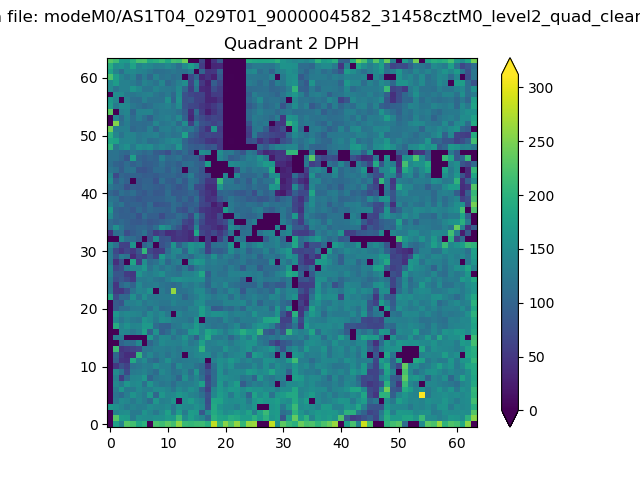
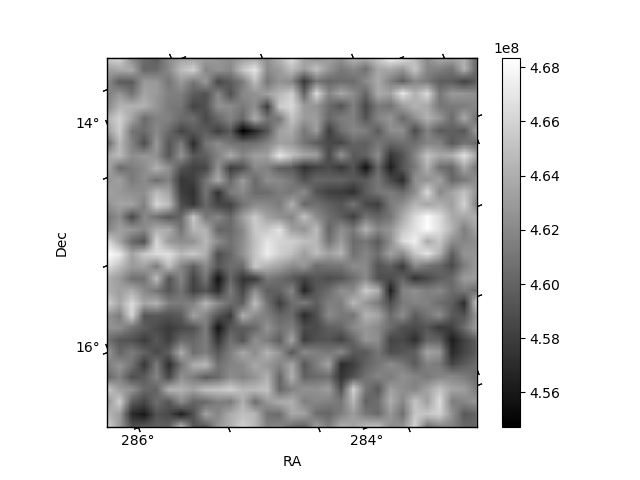
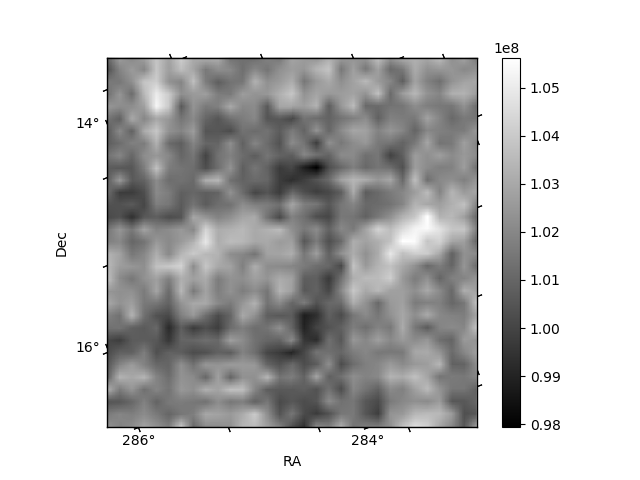
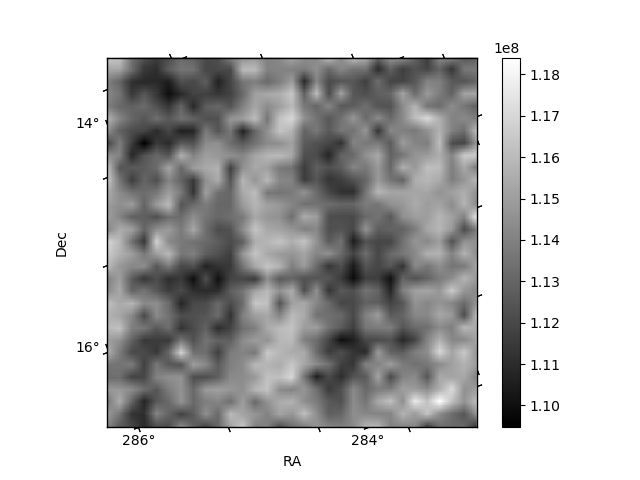
Histogram calculated using DETX and DETY for each event in the final _common_clean file
| Quadrant A | 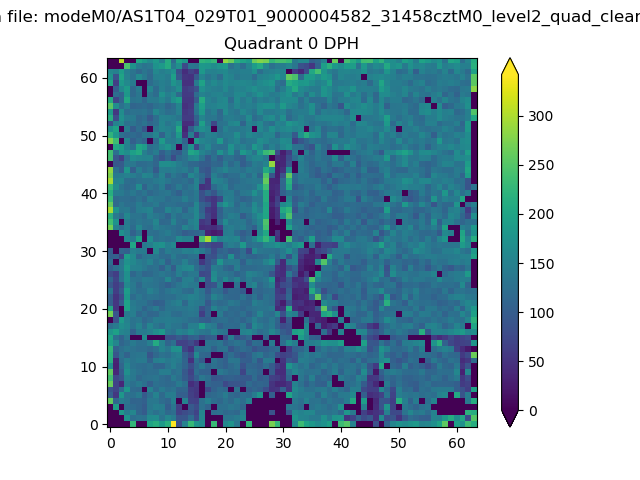 |
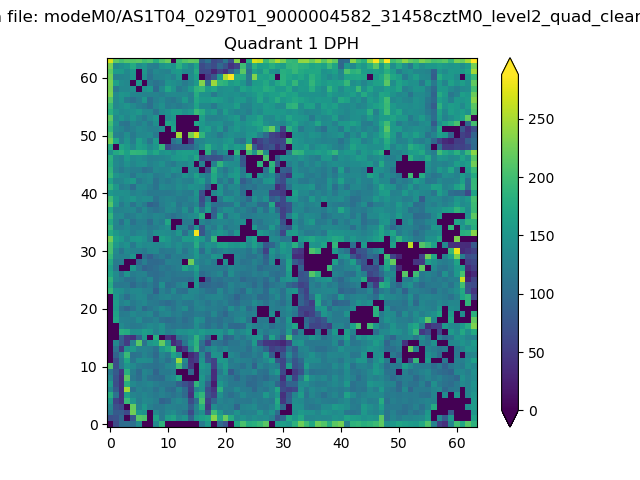 |
Quadrant B |
|---|---|---|---|
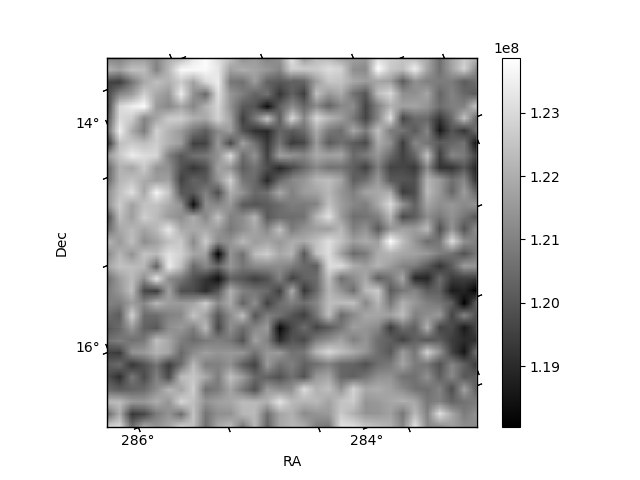
| Quadrant D | 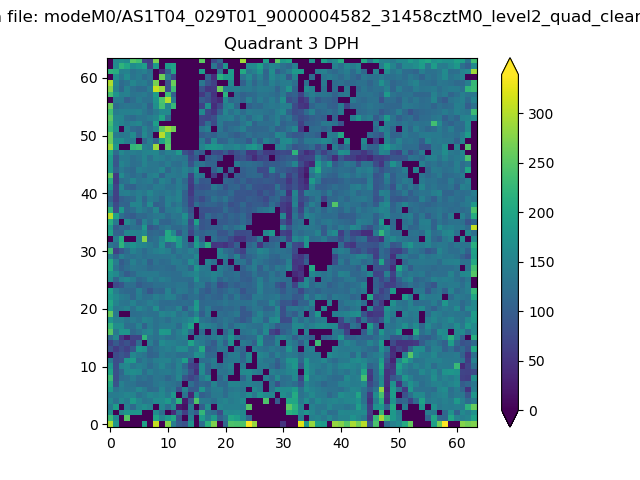 |
 |
Quadrant C |
| Plot type | Count rate plots | Images |
|---|---|---|
| Comparison with Poisson distribution Blue bars denote a histogram of data divided into 1 sec bins. Red curve is a Poisson curve with rate = median count rate of data. |
 |
 |
| Quadrant-wise count rates Data is divided into 100 sec bins |
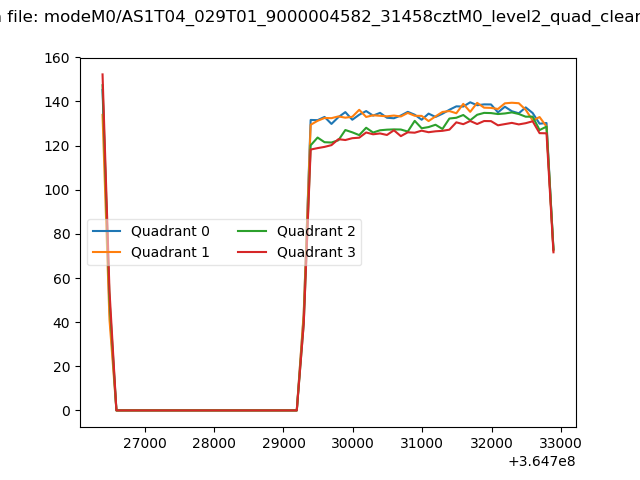 |
|
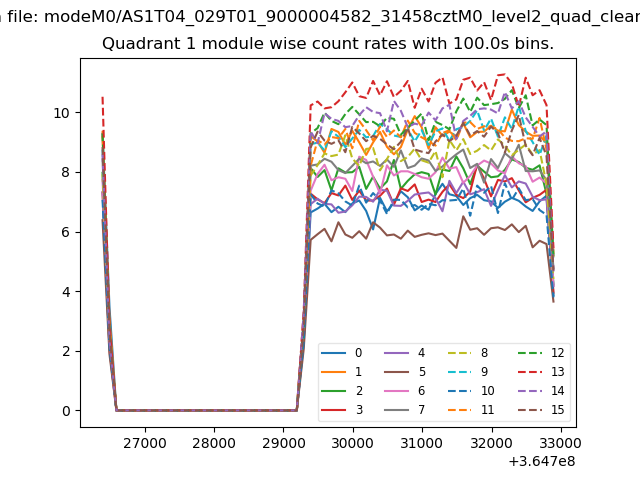
| Module-wise count rates for Quadrant A Data is divided into 100 sec bins |
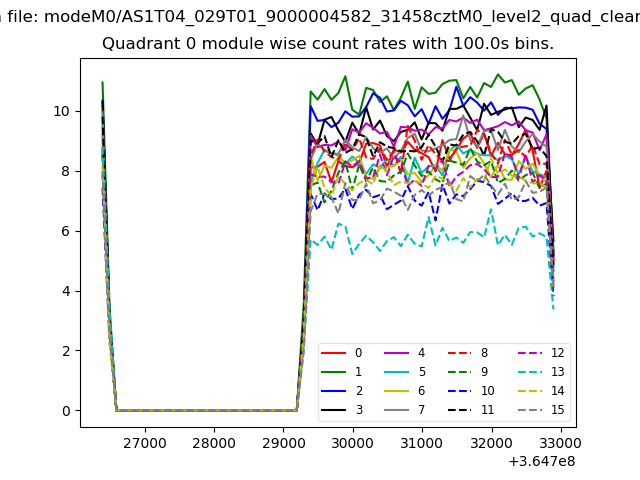 |
 |
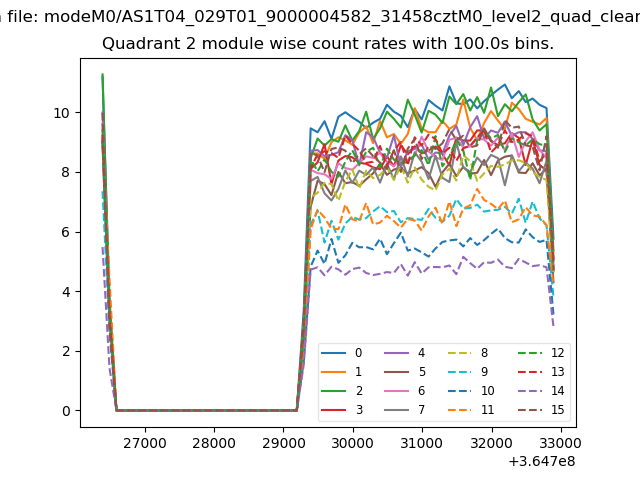
| Module-wise count rates for Quadrant B Data is divided into 100 sec bins |
 |
 |
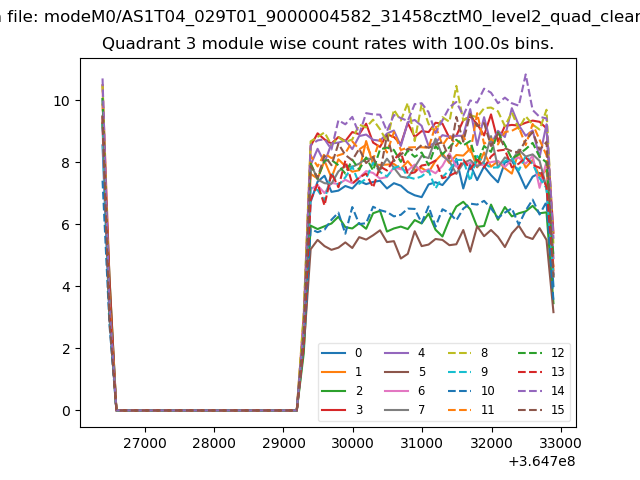
| Module-wise count rates for Quadrant C Data is divided into 100 sec bins |
 |
 |
| Module-wise count rates for Quadrant D Data is divided into 100 sec bins |
 |
 |
| Parameter | Plot |
|---|---|
| CZT HV Monitor | 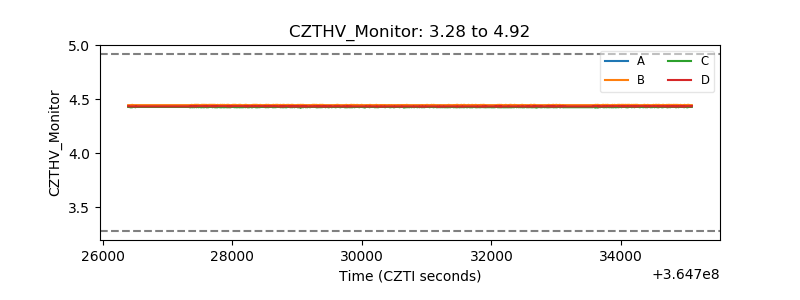 |
| D_VDD | 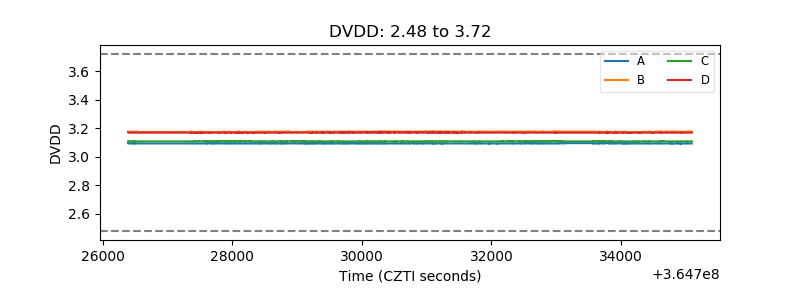 |
| Temperature 1 | 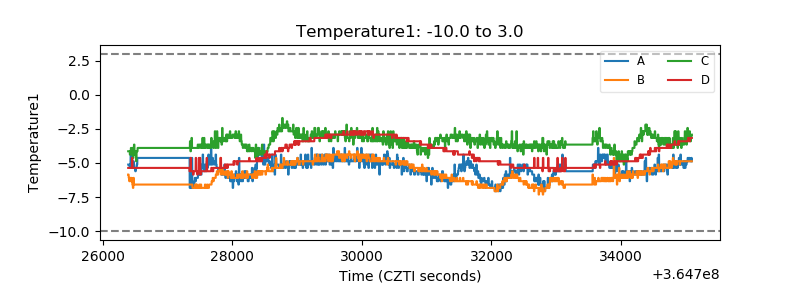 |
| Veto HV Monitor | 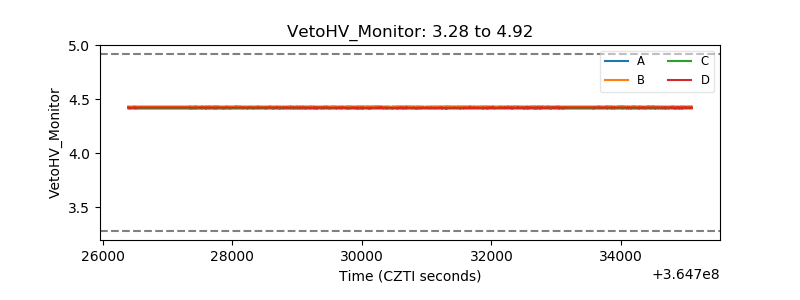 |
| Veto LLD | 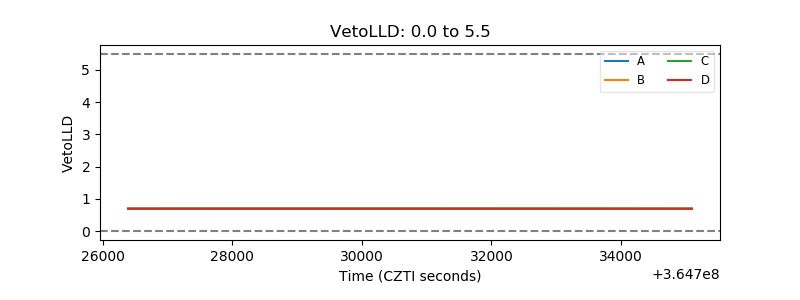 |
| Alpha Counter | 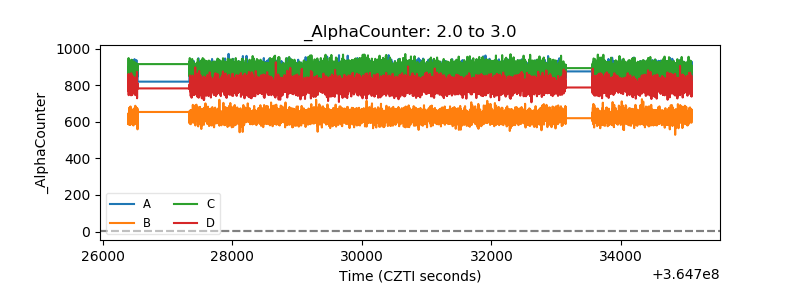 |
| _CPM_Rate |  |
| CZT Counter | 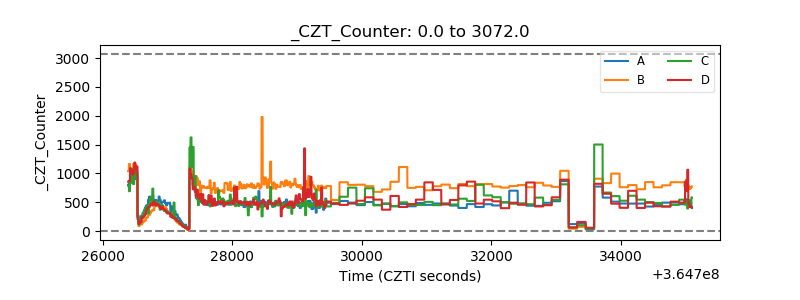 |
| +2.5 Volts monitor |  |
| +5 Volts monitor |  |
| _ROLL_ROT | 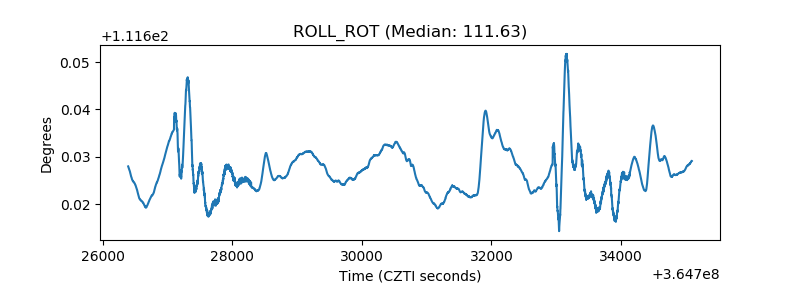 |
| _Roll_DEC | 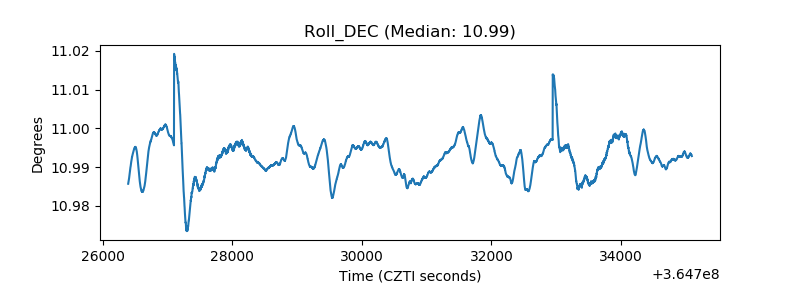 |
| _Roll_RA | 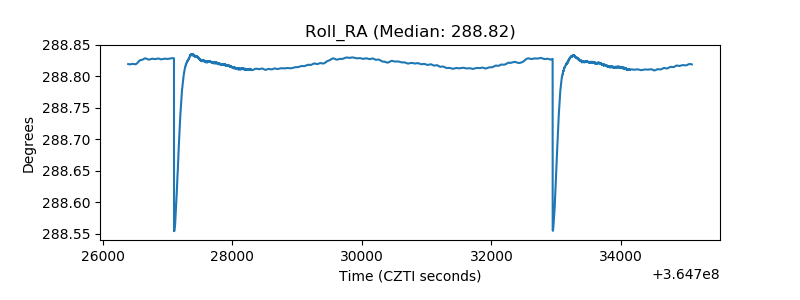 |
| Veto Counter | 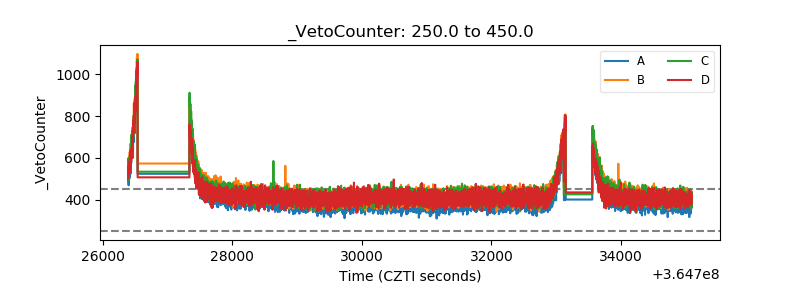 |