| Param | Original file | Final file |
|---|---|---|
| Filename | modeM0/AS1T04_029T01_9000004582_31460cztM0_level2.evt | modeM0/AS1T04_029T01_9000004582_31460cztM0_level2_quad_clean.evt |
| Size (bytes) | 629,746,560 | 89,300,160 |
| Size | 600.6 MB | 85.2 MB |
| Events in quadrant A | 3,491,567 | 564,693 |
| Events in quadrant B | 5,767,042 | 563,802 |
| Events in quadrant C | 5,186,630 | 533,963 |
| Events in quadrant D | 4,132,188 | 532,912 |
| Mode SS | |||
|---|---|---|---|
| Quadrant | BADHDUFLAG | Total packets | Discarded packets |
| A | 0 | 148 | 0 |
| B | 0 | 148 | 0 |
| C | 0 | 148 | 0 |
| D | 0 | 148 | 0 |
| Mode M9 | |||
|---|---|---|---|
| Quadrant | BADHDUFLAG | Total packets | Discarded packets |
| A | 0 | 2 | 0 |
| B | 0 | 2 | 0 |
| C | 0 | 2 | 0 |
| D | 0 | 2 | 0 |
| Mode M0 | |||
|---|---|---|---|
| Quadrant | BADHDUFLAG | Total packets | Discarded packets |
| A | 0 | 14968 | 1 |
| B | 0 | 22292 | 2 |
| C | 0 | 20152 | 1 |
| D | 0 | 16975 | 1 |
| Quadrant | Total seconds | Saturated seconds | Saturation percentage |
|---|---|---|---|
| A | 7309 | 154 | 2.106991% |
| B | 7309 | 225 | 3.078396% |
| C | 7309 | 339 | 4.638117% |
| D | 7309 | 129 | 1.764947% |
Noise dominated data is calculated using 1-second bins in cleaned event files. If a bin has >2000 counts, and if more than 50% of those come from <1% of pixels, then it is considered to be noise-dominated and hence unusable.
| Quadrant | # 1 sec bins | Bins with >0 counts | Bins with >2000 counts | High rate bins dominated by noise | Noise dominated (total time) | Noise dominated (detector-on time) | Marked lightcurve |
|---|---|---|---|---|---|---|---|
| A | 7534 | 7309 | 0 | 0 | 0.00% | 0.00% | 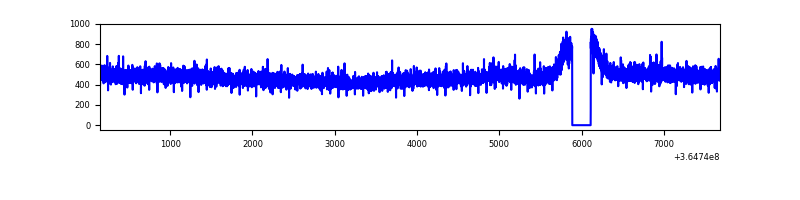 |
| B | 7534 | 7309 | 1 | 1 | 0.01% | 0.01% | 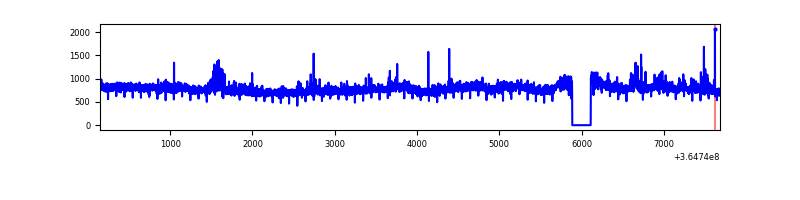 |
| C | 7534 | 7309 | 7 | 7 | 0.09% | 0.10% | 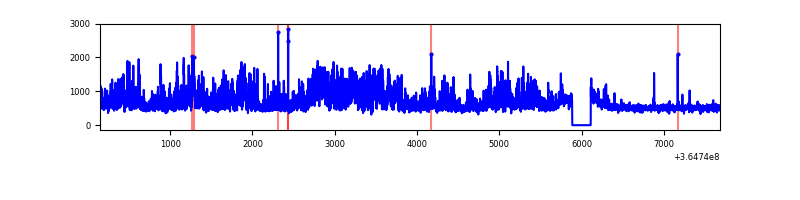 |
| D | 7534 | 7309 | 10 | 10 | 0.13% | 0.14% | 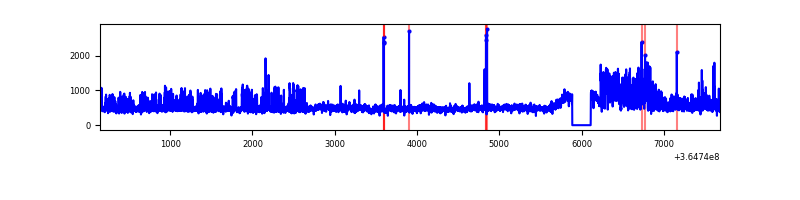 |
Top three noisy pixels from each quadrant. If the there are fewer than three noisy pixels in the level2.evt file, extra rows are filled as -1
| Pixel properties | Quadrant properties | ||||||
|---|---|---|---|---|---|---|---|
| Quadrant | DetID | PixID | Counts | Sigma | Mean | Median | Sigma |
| A | 13 | 254 | 11824 | 59.91 | 905 | 886 | 182.6 |
| A | 3 | 137 | 9821 | 48.94 | 905 | 886 | 182.6 |
| A | 0 | 226 | 7547 | 36.49 | 905 | 886 | 182.6 |
| B | 6 | 159 | 2113661 | 12307.56 | 885 | 863 | 171.7 |
| B | 0 | 190 | 90993 | 525.03 | 885 | 863 | 171.7 |
| B | 4 | 80 | 57615 | 330.59 | 885 | 863 | 171.7 |
| C | 3 | 233 | 1618007 | 7959.54 | 860 | 864 | 203.2 |
| C | 14 | 238 | 141773 | 693.55 | 860 | 864 | 203.2 |
| C | 0 | 10 | 27499 | 131.09 | 860 | 864 | 203.2 |
| D | 8 | 195 | 791040 | 3804.7 | 874 | 850 | 207.7 |
| D | 2 | 234 | 28164 | 131.51 | 874 | 850 | 207.7 |
| D | 2 | 250 | 25135 | 116.93 | 874 | 850 | 207.7 |
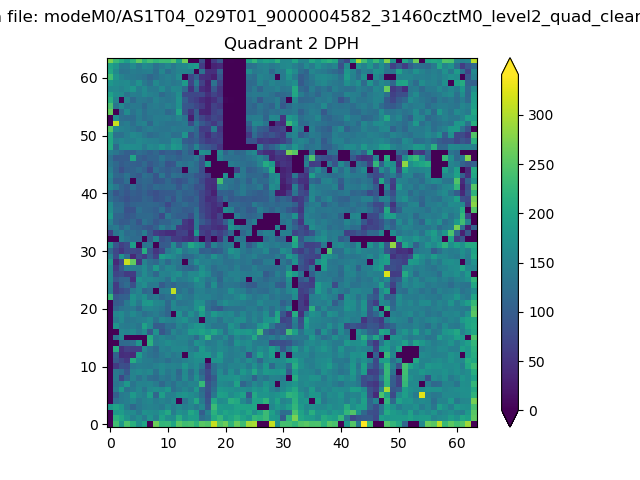
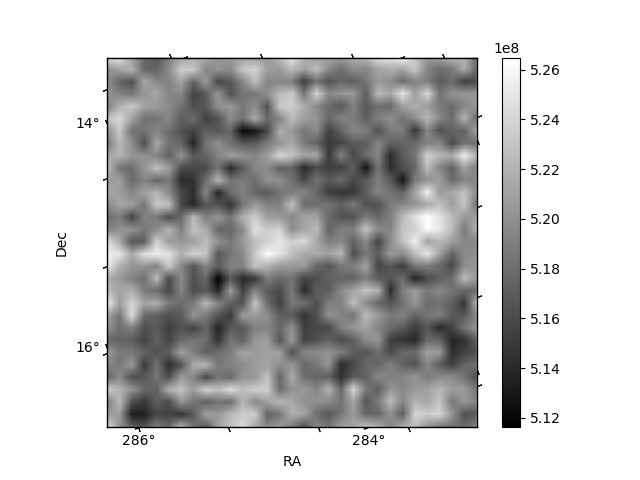
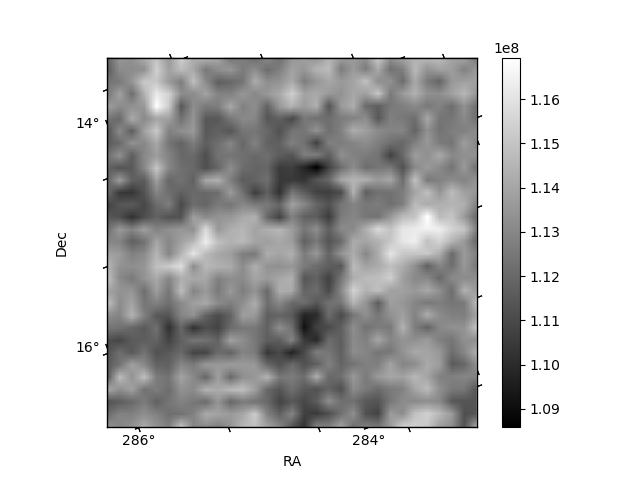
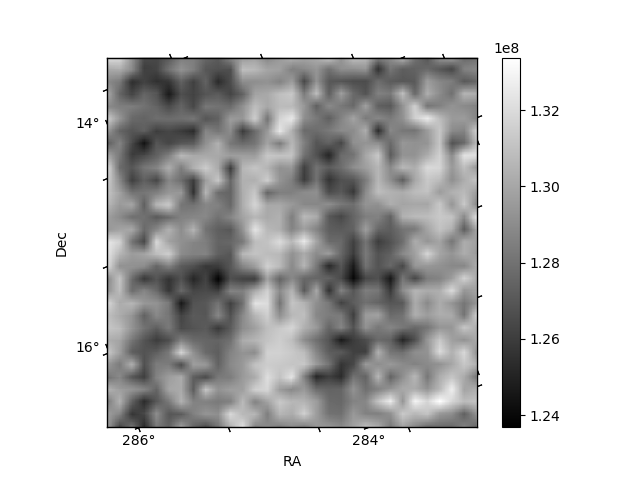
Histogram calculated using DETX and DETY for each event in the final _common_clean file
| Quadrant A | 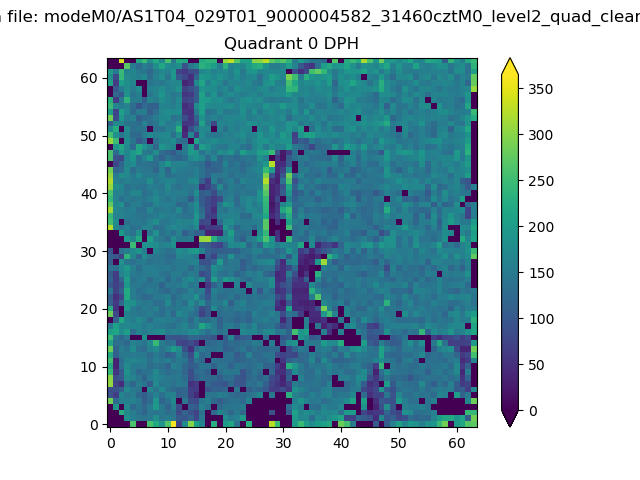 |
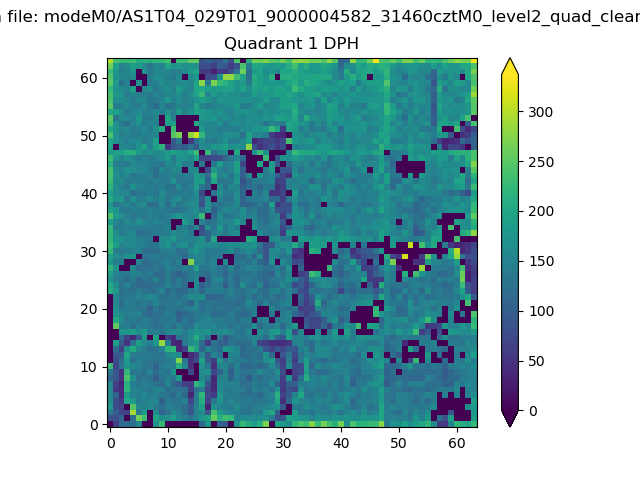 |
Quadrant B |
|---|---|---|---|
| Quadrant D | 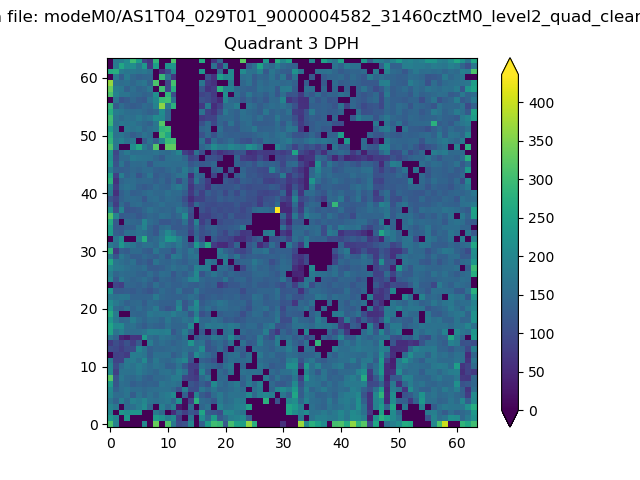 |
 |
Quadrant C |
| Plot type | Count rate plots | Images |
|---|---|---|
| Comparison with Poisson distribution Blue bars denote a histogram of data divided into 1 sec bins. Red curve is a Poisson curve with rate = median count rate of data. |
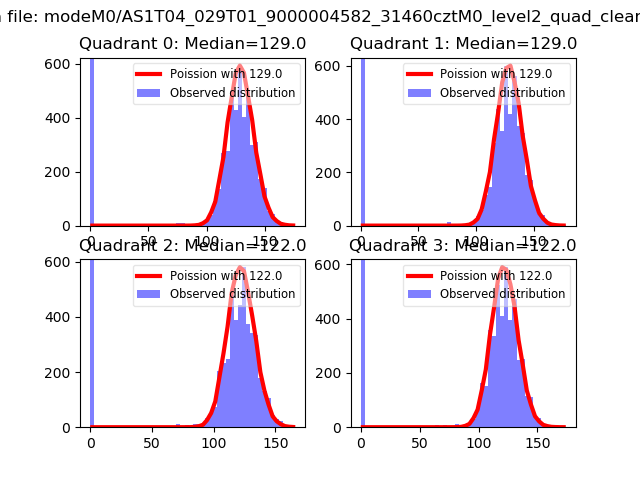 |
 |
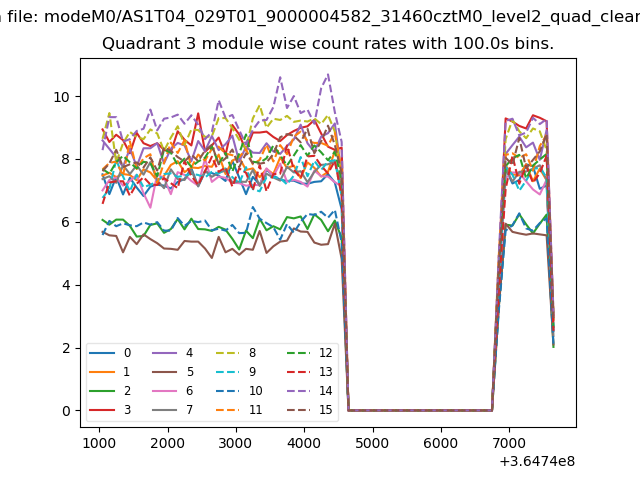
| Quadrant-wise count rates Data is divided into 100 sec bins |
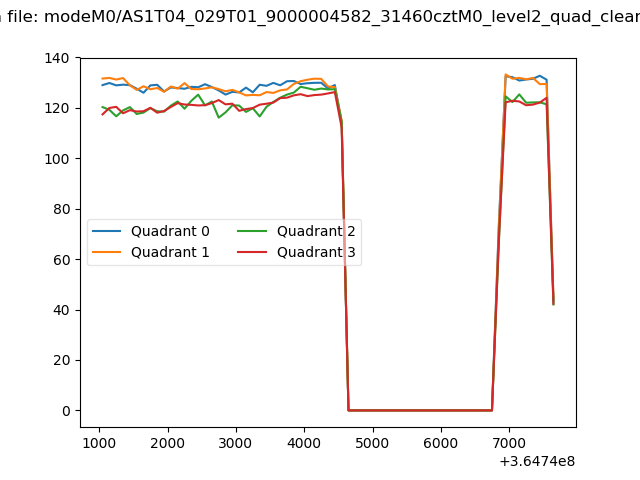 |
|
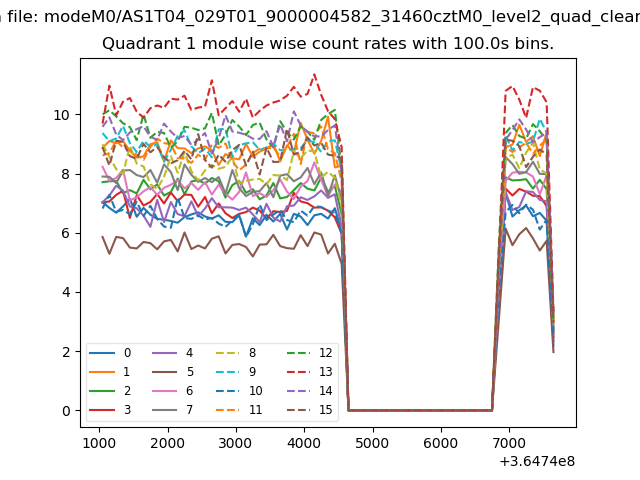
| Module-wise count rates for Quadrant A Data is divided into 100 sec bins |
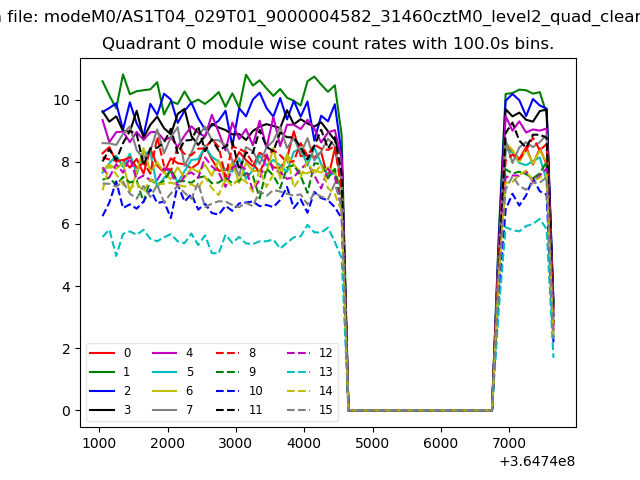 |
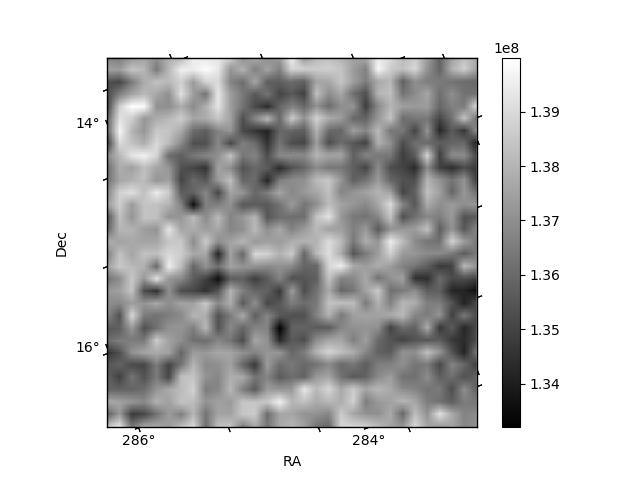 |
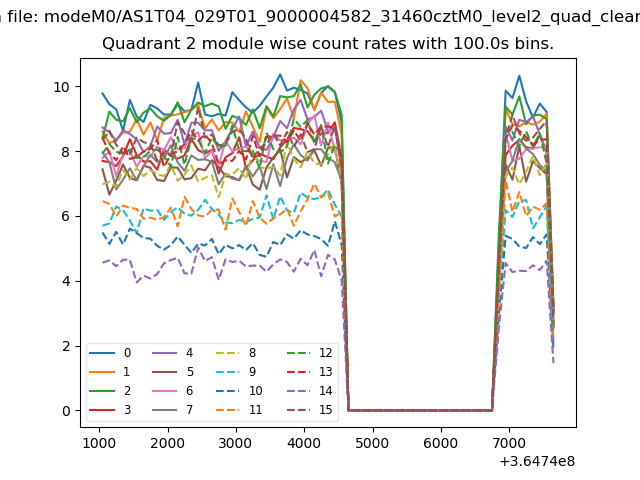
| Module-wise count rates for Quadrant B Data is divided into 100 sec bins |
 |
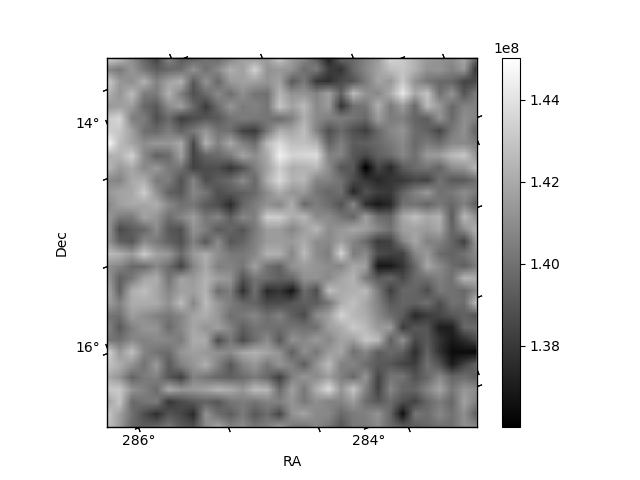 |
| Module-wise count rates for Quadrant C Data is divided into 100 sec bins |
 |
 |
| Module-wise count rates for Quadrant D Data is divided into 100 sec bins |
 |
 |
| Parameter | Plot |
|---|---|
| CZT HV Monitor | 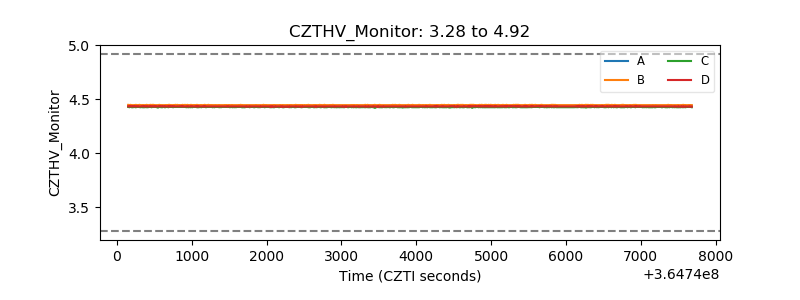 |
| D_VDD | 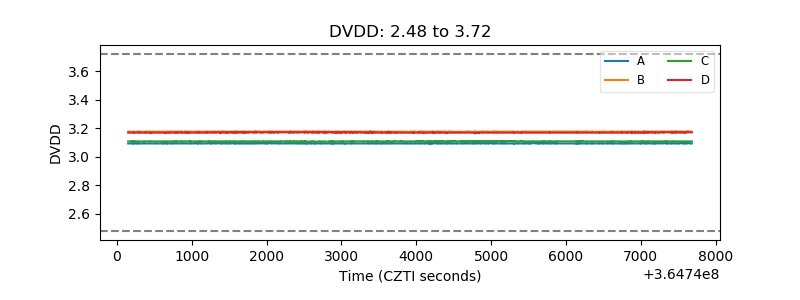 |
| Temperature 1 | 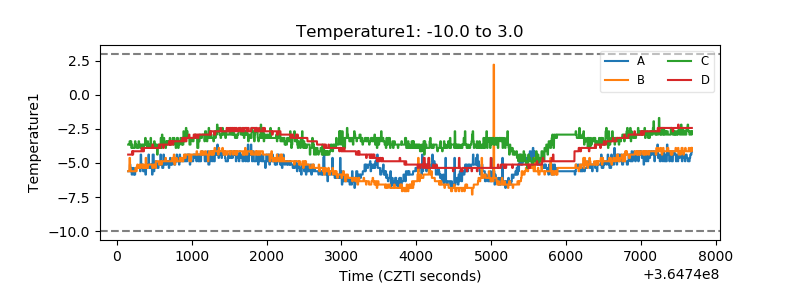 |
| Veto HV Monitor | 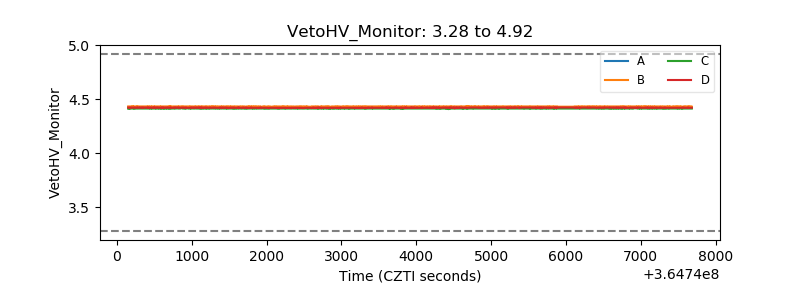 |
| Veto LLD | 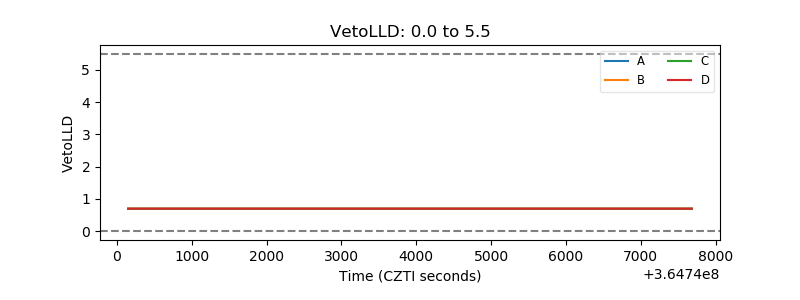 |
| Alpha Counter | 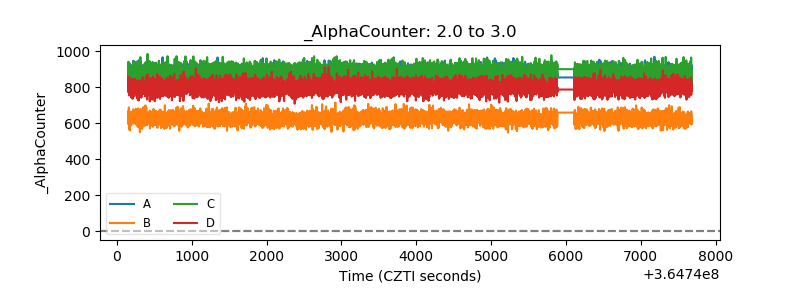 |
| _CPM_Rate | 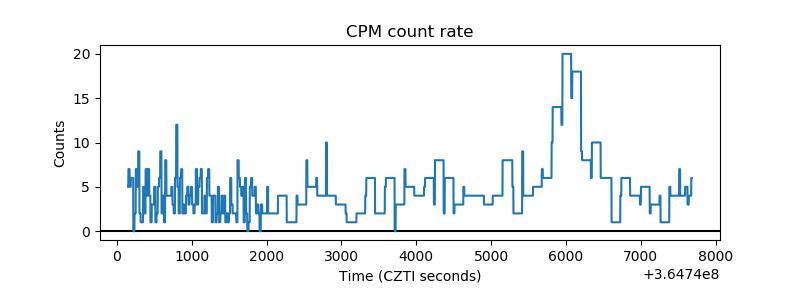 |
| CZT Counter | 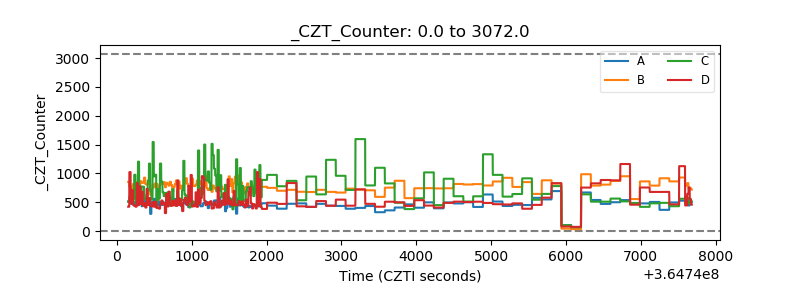 |
| +2.5 Volts monitor |  |
| +5 Volts monitor |  |
| _ROLL_ROT | 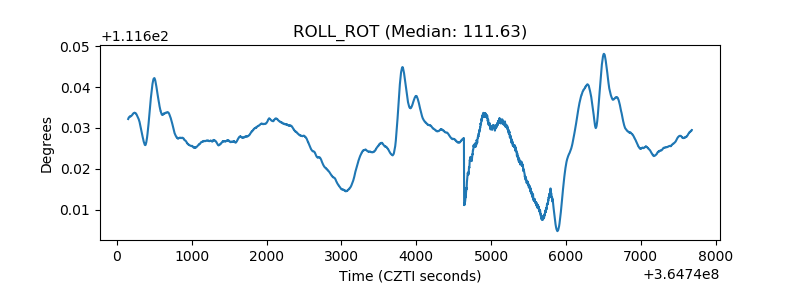 |
| _Roll_DEC | 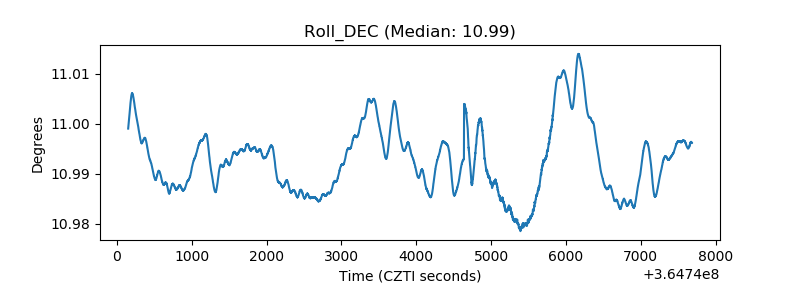 |
| _Roll_RA | 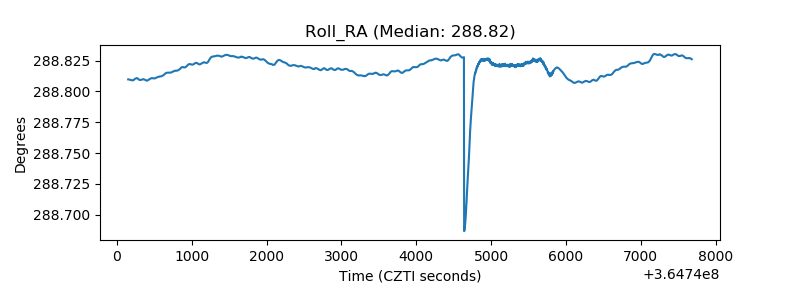 |
| Veto Counter | 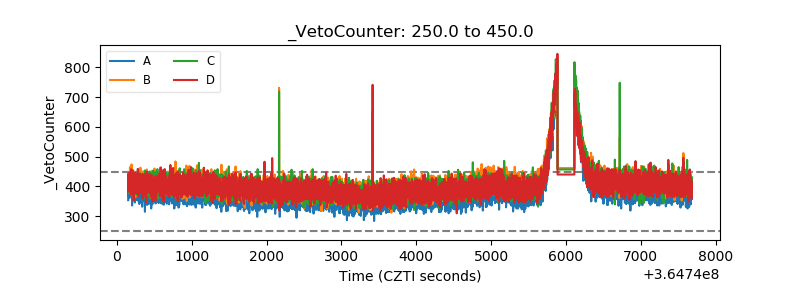 |