| Param | Original file | Final file |
|---|---|---|
| Filename | modeM0/AS1T04_029T01_9000004582_31462cztM0_level2.evt | modeM0/AS1T04_029T01_9000004582_31462cztM0_level2_quad_clean.evt |
| Size (bytes) | 1,198,808,640 | 168,030,720 |
| Size | 1.1 GB | 160.2 MB |
| Events in quadrant A | 5,892,697 | 1,132,427 |
| Events in quadrant B | 15,679,054 | 936,416 |
| Events in quadrant C | 6,711,805 | 1,086,513 |
| Events in quadrant D | 7,178,184 | 1,067,522 |
| Mode SS | |||
|---|---|---|---|
| Quadrant | BADHDUFLAG | Total packets | Discarded packets |
| A | 0 | 252 | 0 |
| B | 0 | 252 | 0 |
| C | 0 | 252 | 0 |
| D | 0 | 252 | 0 |
| Mode M9 | |||
|---|---|---|---|
| Quadrant | BADHDUFLAG | Total packets | Discarded packets |
| A | 0 | 12 | 0 |
| B | 0 | 12 | 0 |
| C | 0 | 12 | 0 |
| D | 0 | 12 | 0 |
| Mode M0 | |||
|---|---|---|---|
| Quadrant | BADHDUFLAG | Total packets | Discarded packets |
| A | 0 | 25643 | 2 |
| B | 0 | 55297 | 2 |
| C | 0 | 27859 | 2 |
| D | 0 | 29733 | 2 |
| Quadrant | Total seconds | Saturated seconds | Saturation percentage |
|---|---|---|---|
| A | 12521 | 154 | 1.229934% |
| B | 12521 | 3340 | 26.675186% |
| C | 12521 | 385 | 3.074834% |
| D | 12521 | 176 | 1.405639% |
Noise dominated data is calculated using 1-second bins in cleaned event files. If a bin has >2000 counts, and if more than 50% of those come from <1% of pixels, then it is considered to be noise-dominated and hence unusable.
| Quadrant | # 1 sec bins | Bins with >0 counts | Bins with >2000 counts | High rate bins dominated by noise | Noise dominated (total time) | Noise dominated (detector-on time) | Marked lightcurve |
|---|---|---|---|---|---|---|---|
| A | 13576 | 12521 | 0 | 0 | 0.00% | 0.00% | 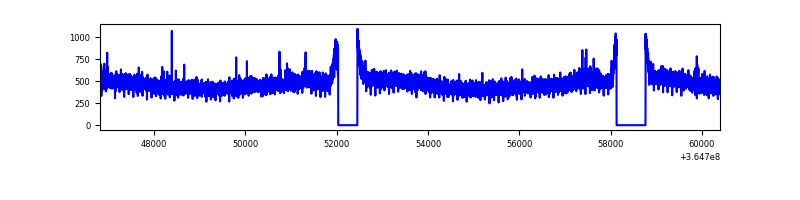 |
| B | 13576 | 12521 | 2775 | 2775 | 20.44% | 22.16% | 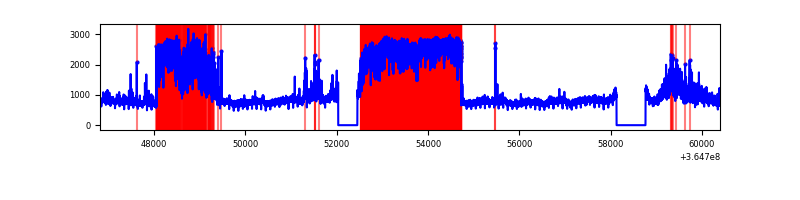 |
| C | 13576 | 12521 | 27 | 27 | 0.20% | 0.22% | 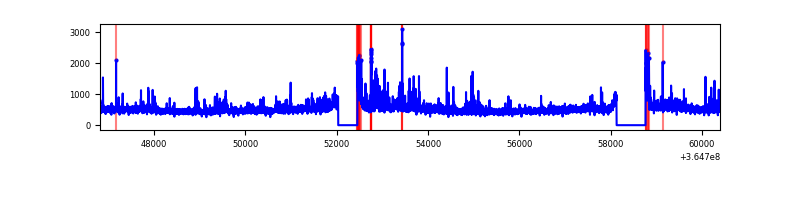 |
| D | 13576 | 12521 | 70 | 70 | 0.52% | 0.56% | 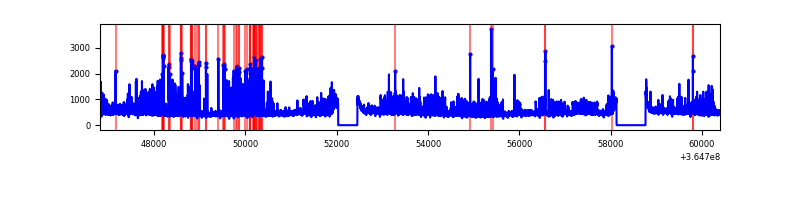 |
Top three noisy pixels from each quadrant. If the there are fewer than three noisy pixels in the level2.evt file, extra rows are filled as -1
| Pixel properties | Quadrant properties | ||||||
|---|---|---|---|---|---|---|---|
| Quadrant | DetID | PixID | Counts | Sigma | Mean | Median | Sigma |
| A | 13 | 254 | 20971 | 63.78 | 1527 | 1495 | 305.4 |
| A | 3 | 137 | 16300 | 48.48 | 1527 | 1495 | 305.4 |
| A | 0 | 226 | 12583 | 36.31 | 1527 | 1495 | 305.4 |
| B | 12 | 1 | 6913834 | 26587.35 | 1344 | 1309 | 260.0 |
| B | 6 | 159 | 3210028 | 12341.56 | 1344 | 1309 | 260.0 |
| B | 0 | 190 | 135324 | 515.46 | 1344 | 1309 | 260.0 |
| C | 3 | 233 | 434235 | 1253.42 | 1462 | 1477 | 345.3 |
| C | 0 | 10 | 270983 | 780.58 | 1462 | 1477 | 345.3 |
| C | 14 | 238 | 235935 | 679.07 | 1462 | 1477 | 345.3 |
| D | 8 | 195 | 1329319 | 3720.34 | 1484 | 1442 | 356.9 |
| D | 2 | 250 | 97503 | 269.13 | 1484 | 1442 | 356.9 |
| D | 7 | 64 | 76742 | 210.97 | 1484 | 1442 | 356.9 |
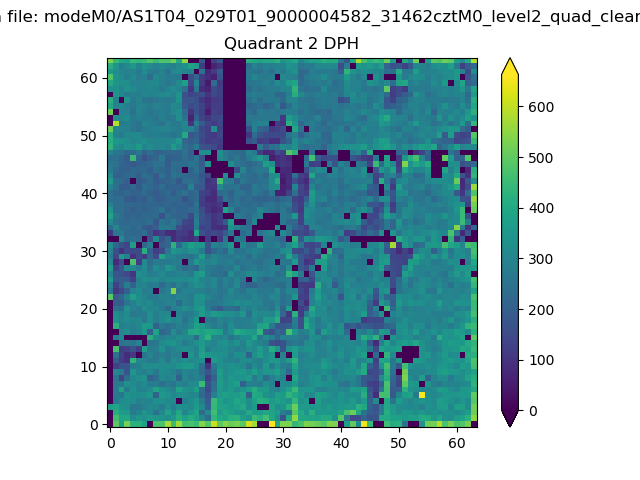
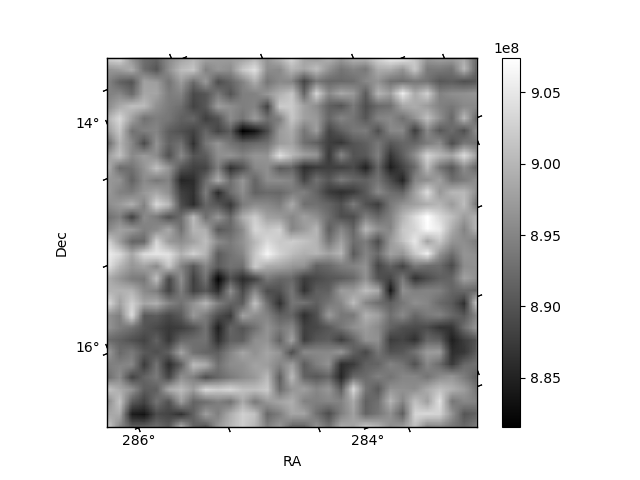
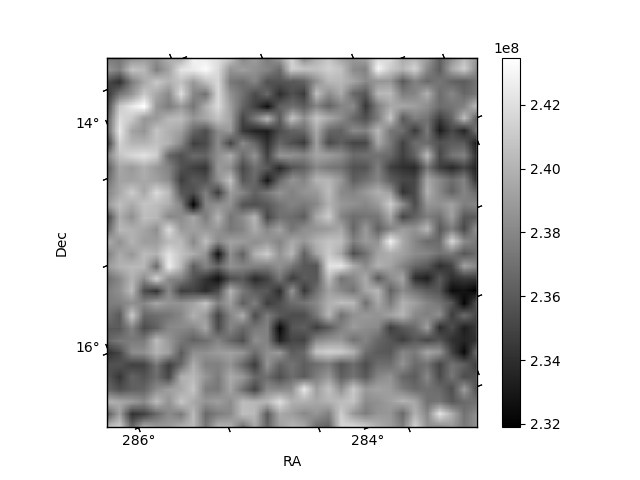
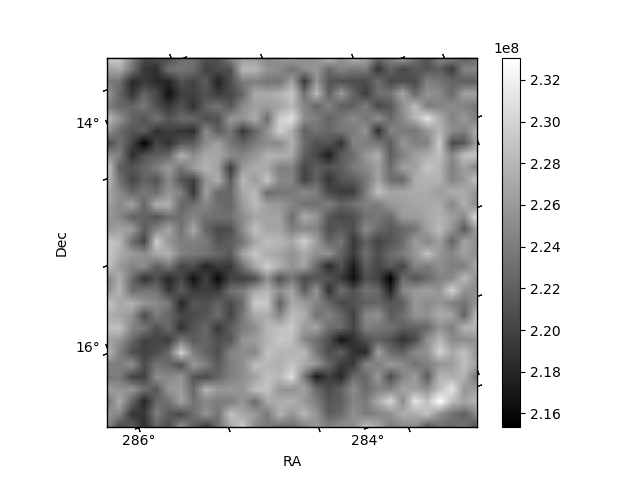
Histogram calculated using DETX and DETY for each event in the final _common_clean file
| Quadrant A | 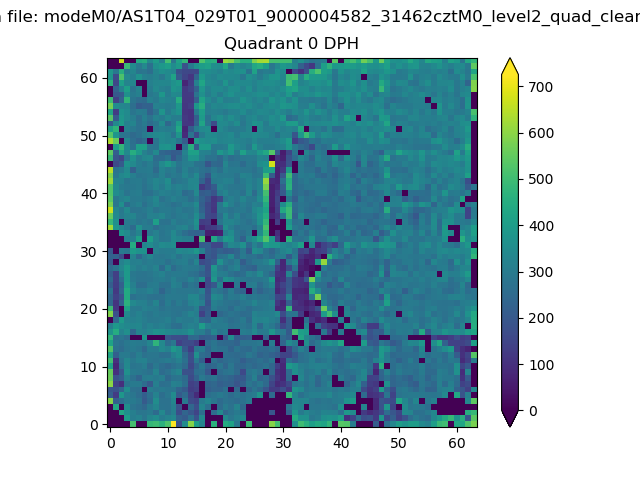 |
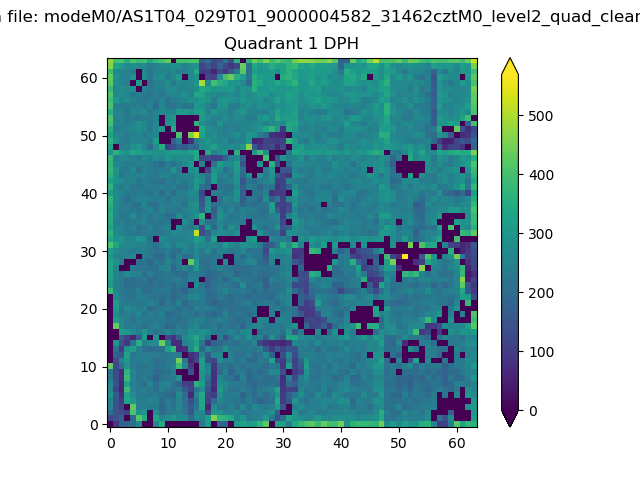 |
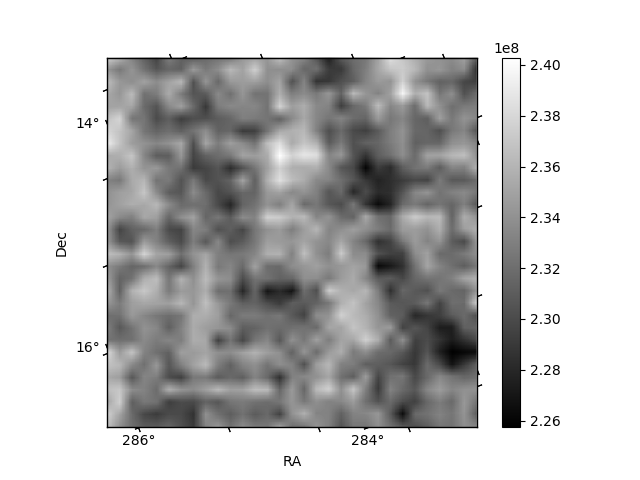
Quadrant B |
|---|---|---|---|
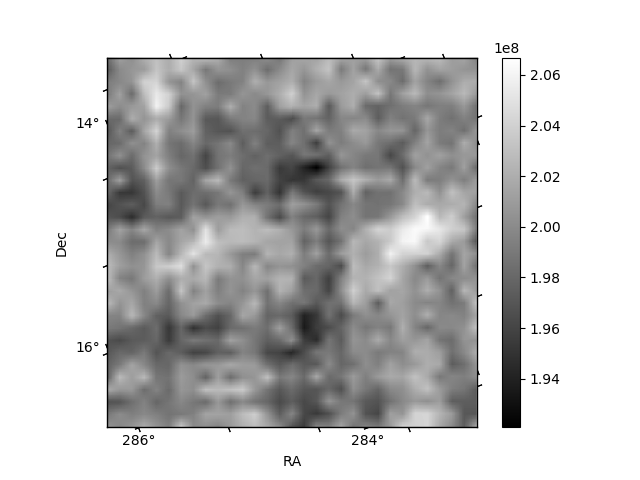
| Quadrant D | 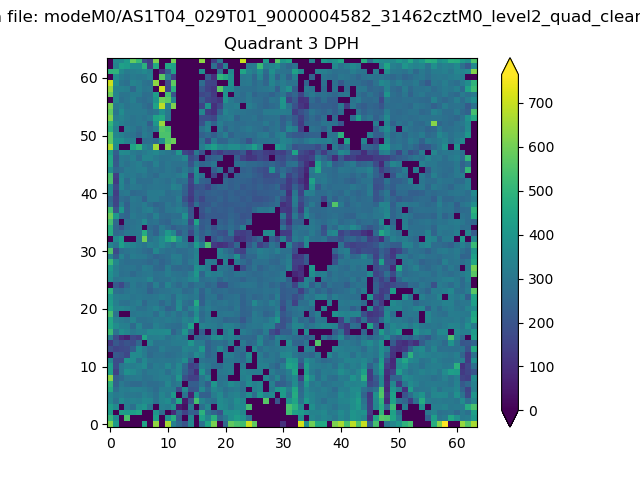 |
 |
Quadrant C |
| Plot type | Count rate plots | Images |
|---|---|---|
| Comparison with Poisson distribution Blue bars denote a histogram of data divided into 1 sec bins. Red curve is a Poisson curve with rate = median count rate of data. |
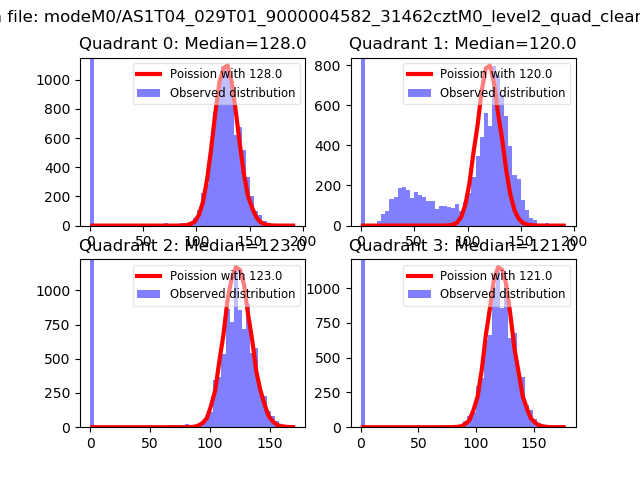 |
 |
| Quadrant-wise count rates Data is divided into 100 sec bins |
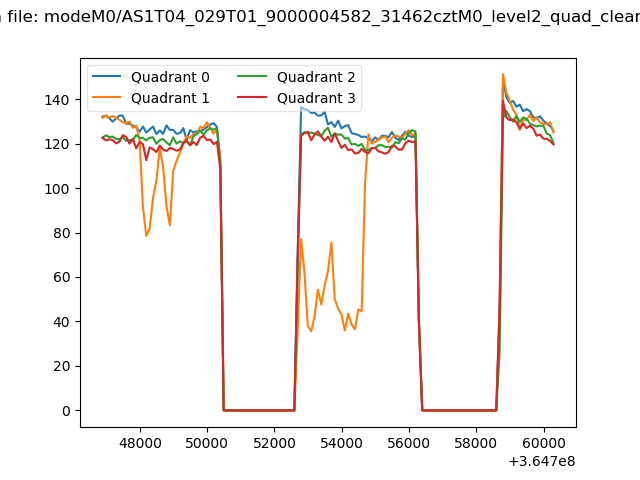 |
|
| Module-wise count rates for Quadrant A Data is divided into 100 sec bins |
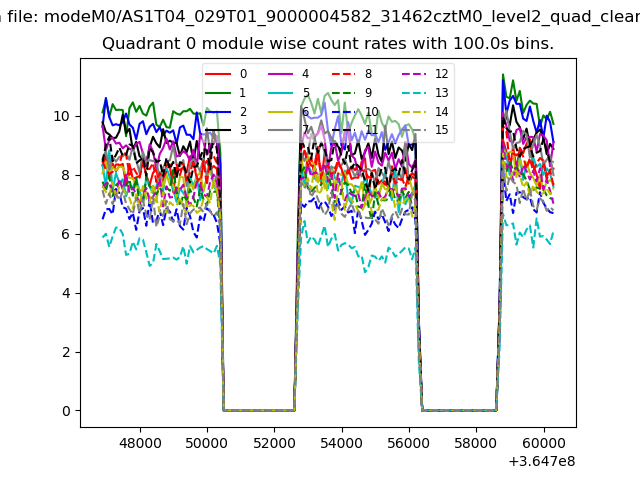 |
 |
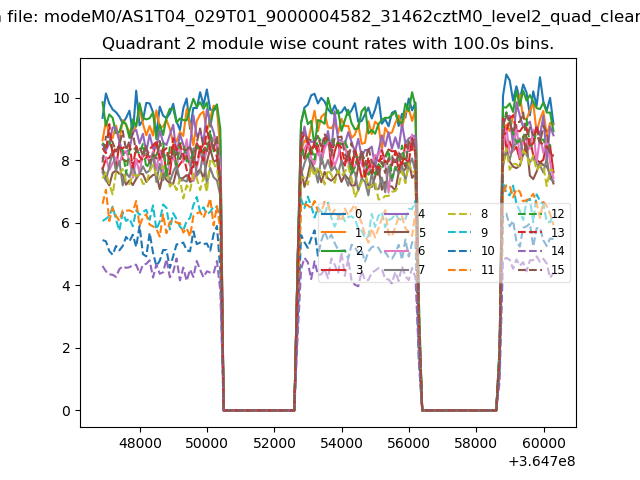
| Module-wise count rates for Quadrant B Data is divided into 100 sec bins |
 |
 |
| Module-wise count rates for Quadrant C Data is divided into 100 sec bins |
 |
 |
| Module-wise count rates for Quadrant D Data is divided into 100 sec bins |
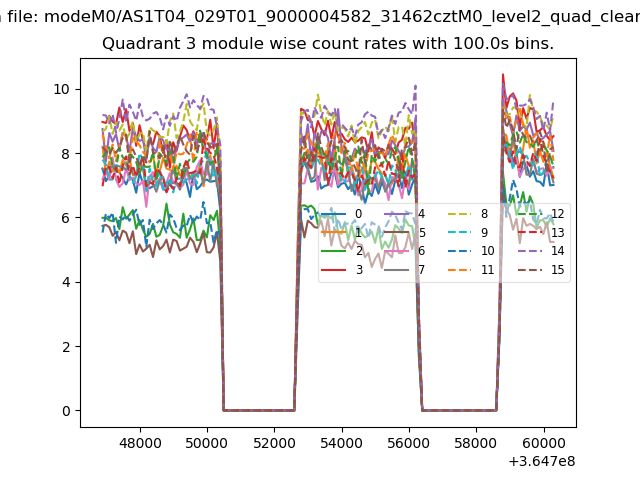 |
 |
| Parameter | Plot |
|---|---|
| CZT HV Monitor |  |
| D_VDD | 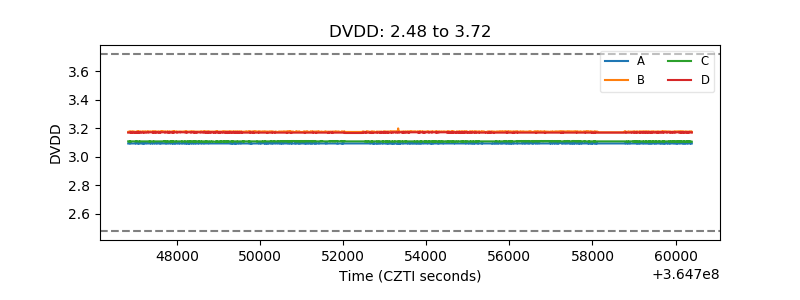 |
| Temperature 1 | 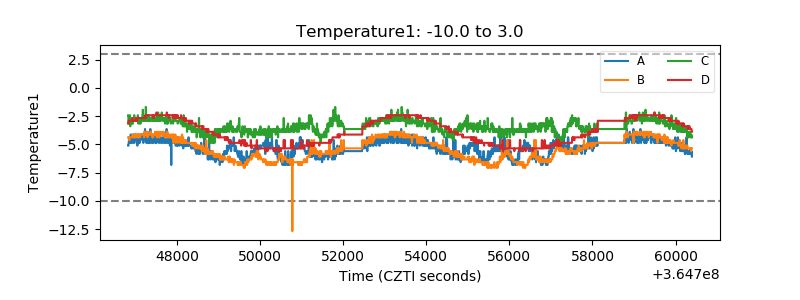 |
| Veto HV Monitor | 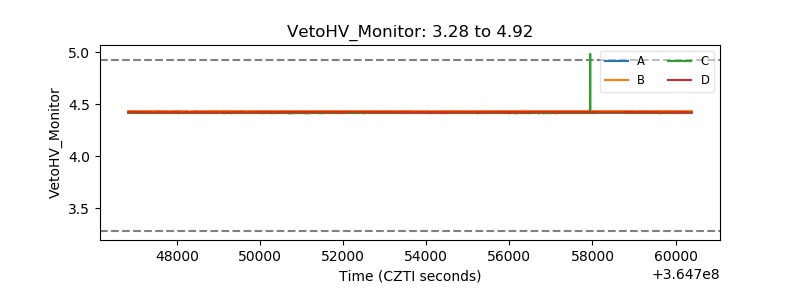 |
| Veto LLD | 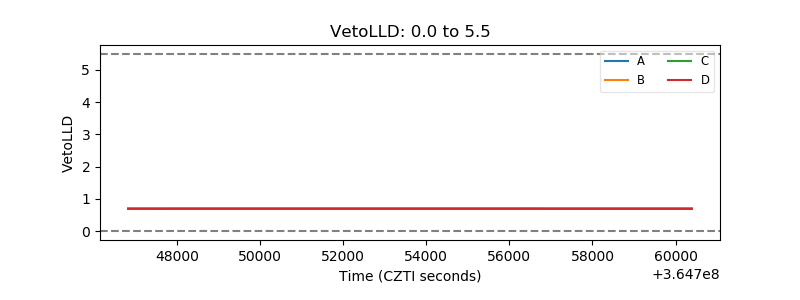 |
| Alpha Counter | 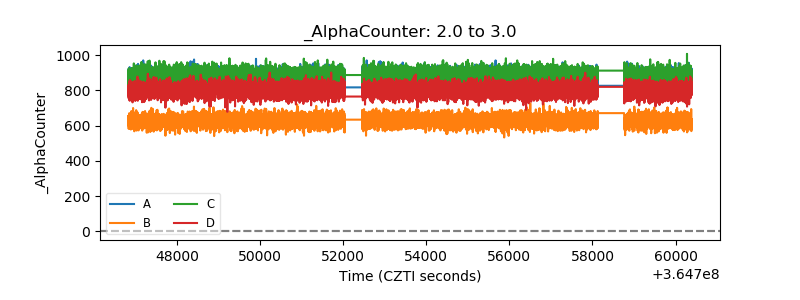 |
| _CPM_Rate | 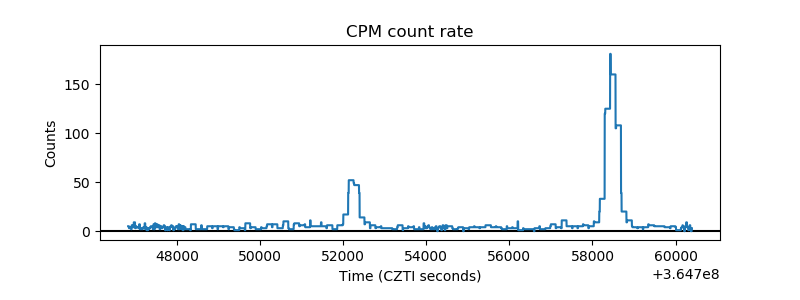 |
| CZT Counter | 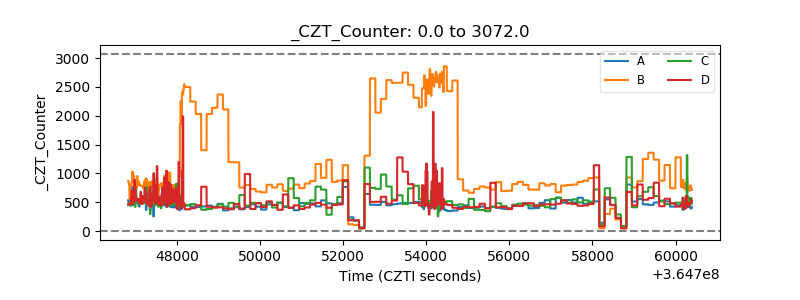 |
| +2.5 Volts monitor |  |
| +5 Volts monitor |  |
| _ROLL_ROT | 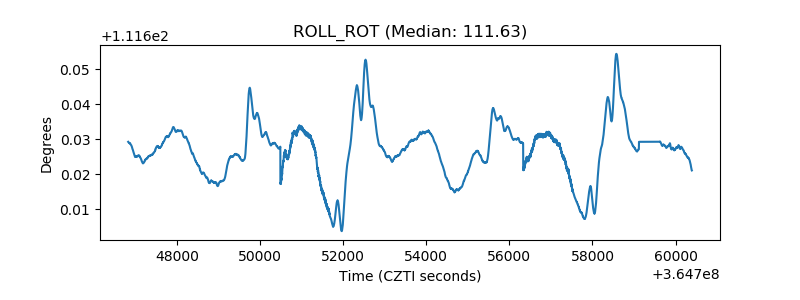 |
| _Roll_DEC | 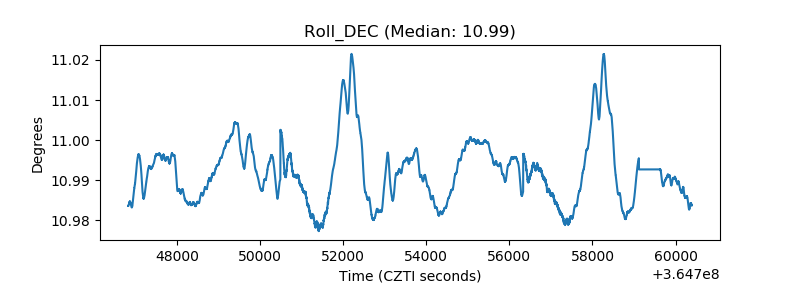 |
| _Roll_RA | 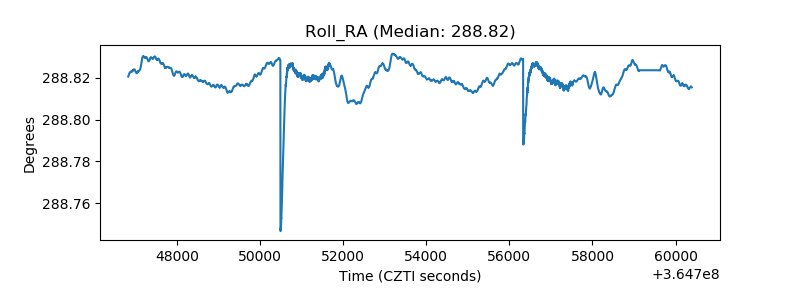 |
| Veto Counter | 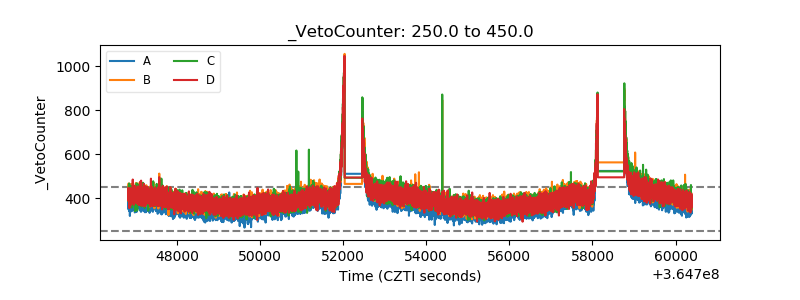 |