| Param | Original file | Final file |
|---|---|---|
| Filename | modeM0/AS1T04_029T01_9000004582_31463cztM0_level2.evt | modeM0/AS1T04_029T01_9000004582_31463cztM0_level2_quad_clean.evt |
| Size (bytes) | 589,498,560 | 99,089,280 |
| Size | 562.2 MB | 94.5 MB |
| Events in quadrant A | 3,442,173 | 641,521 |
| Events in quadrant B | 5,981,345 | 638,321 |
| Events in quadrant C | 3,865,759 | 617,656 |
| Events in quadrant D | 4,081,375 | 607,115 |
| Mode SS | |||
|---|---|---|---|
| Quadrant | BADHDUFLAG | Total packets | Discarded packets |
| A | 0 | 144 | 0 |
| B | 0 | 144 | 0 |
| C | 0 | 144 | 0 |
| D | 0 | 144 | 0 |
| Mode M9 | |||
|---|---|---|---|
| Quadrant | BADHDUFLAG | Total packets | Discarded packets |
| A | 0 | 15 | 0 |
| B | 0 | 15 | 0 |
| C | 0 | 15 | 0 |
| D | 0 | 15 | 0 |
| Mode M0 | |||
|---|---|---|---|
| Quadrant | BADHDUFLAG | Total packets | Discarded packets |
| A | 0 | 14859 | 2 |
| B | 0 | 22894 | 2 |
| C | 0 | 16008 | 2 |
| D | 0 | 16963 | 2 |
| Quadrant | Total seconds | Saturated seconds | Saturation percentage |
|---|---|---|---|
| A | 7132 | 114 | 1.598430% |
| B | 7133 | 282 | 3.953456% |
| C | 7132 | 274 | 3.841840% |
| D | 7132 | 110 | 1.542344% |
Noise dominated data is calculated using 1-second bins in cleaned event files. If a bin has >2000 counts, and if more than 50% of those come from <1% of pixels, then it is considered to be noise-dominated and hence unusable.
| Quadrant | # 1 sec bins | Bins with >0 counts | Bins with >2000 counts | High rate bins dominated by noise | Noise dominated (total time) | Noise dominated (detector-on time) | Marked lightcurve |
|---|---|---|---|---|---|---|---|
| A | 8562 | 7132 | 0 | 0 | 0.00% | 0.00% | 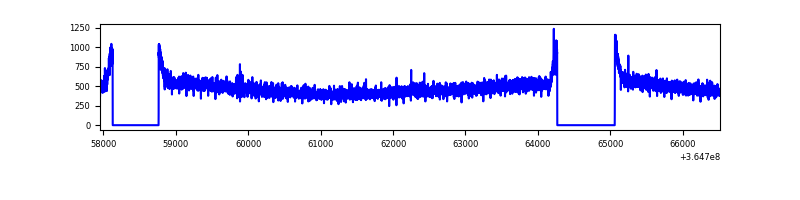 |
| B | 8563 | 7133 | 13 | 13 | 0.15% | 0.18% | 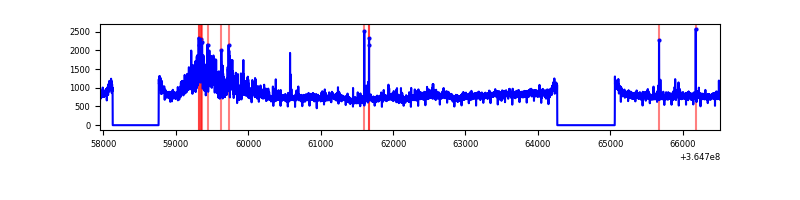 |
| C | 8562 | 7132 | 15 | 15 | 0.18% | 0.21% | 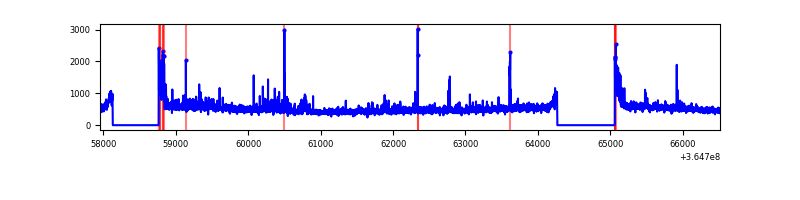 |
| D | 8562 | 7132 | 14 | 14 | 0.16% | 0.20% | 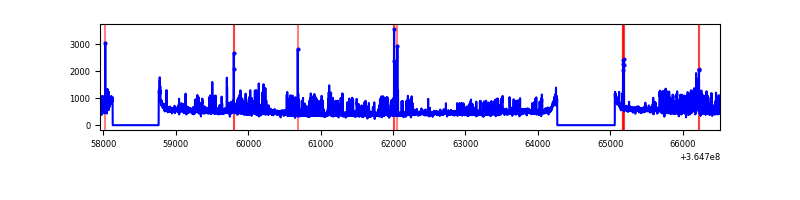 |
Top three noisy pixels from each quadrant. If the there are fewer than three noisy pixels in the level2.evt file, extra rows are filled as -1
| Pixel properties | Quadrant properties | ||||||
|---|---|---|---|---|---|---|---|
| Quadrant | DetID | PixID | Counts | Sigma | Mean | Median | Sigma |
| A | 13 | 254 | 12218 | 62.87 | 892 | 872 | 180.5 |
| A | 3 | 137 | 9661 | 48.7 | 892 | 872 | 180.5 |
| A | 0 | 226 | 7296 | 35.6 | 892 | 872 | 180.5 |
| B | 6 | 159 | 1986014 | 11698.01 | 874 | 852 | 169.7 |
| B | 12 | 1 | 381860 | 2245.18 | 874 | 852 | 169.7 |
| B | 0 | 190 | 91164 | 532.18 | 874 | 852 | 169.7 |
| C | 0 | 10 | 200785 | 983.94 | 853 | 860 | 203.2 |
| C | 3 | 233 | 144494 | 706.9 | 853 | 860 | 203.2 |
| C | 14 | 238 | 137098 | 670.5 | 853 | 860 | 203.2 |
| D | 8 | 195 | 636571 | 3088.67 | 867 | 844 | 205.8 |
| D | 12 | 218 | 68874 | 330.52 | 867 | 844 | 205.8 |
| D | 12 | 79 | 36744 | 174.42 | 867 | 844 | 205.8 |
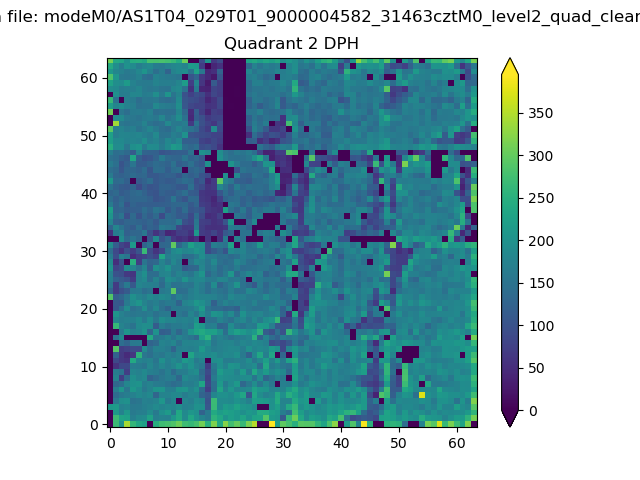
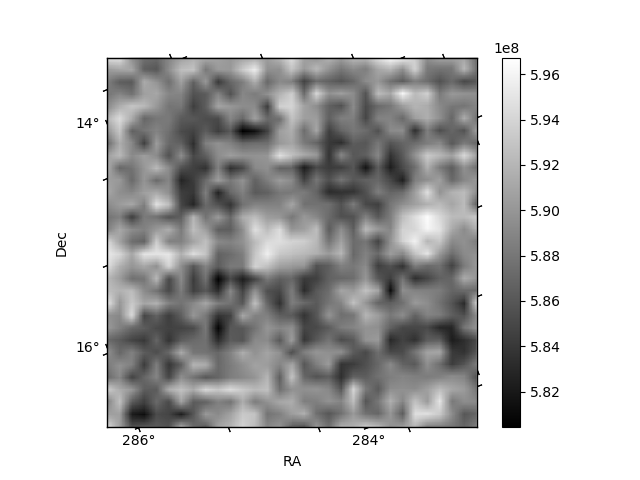
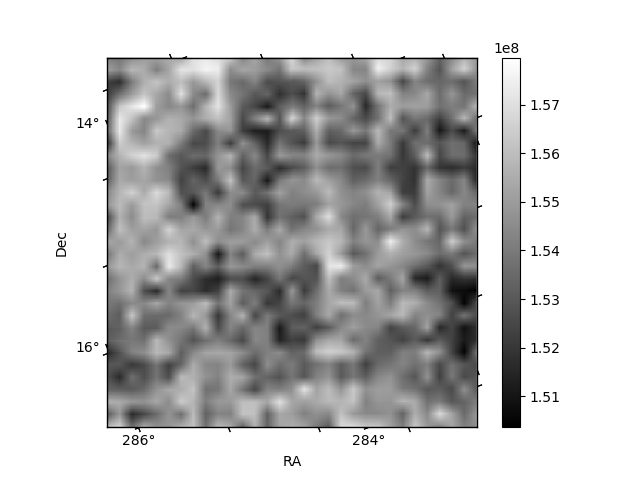
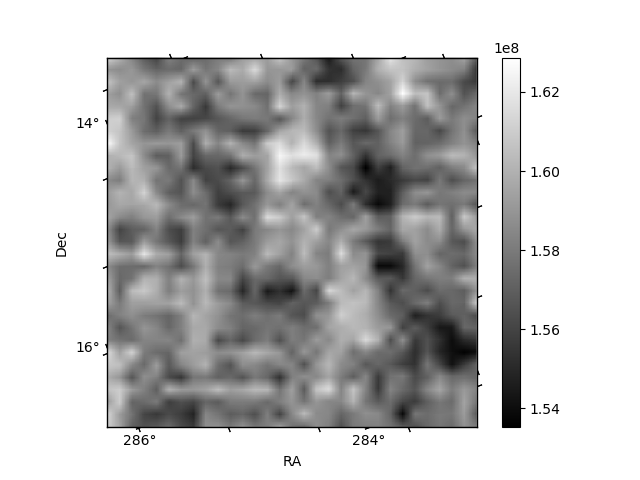
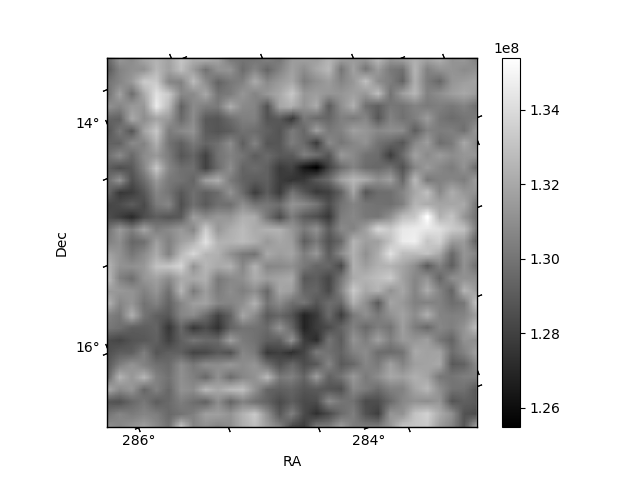
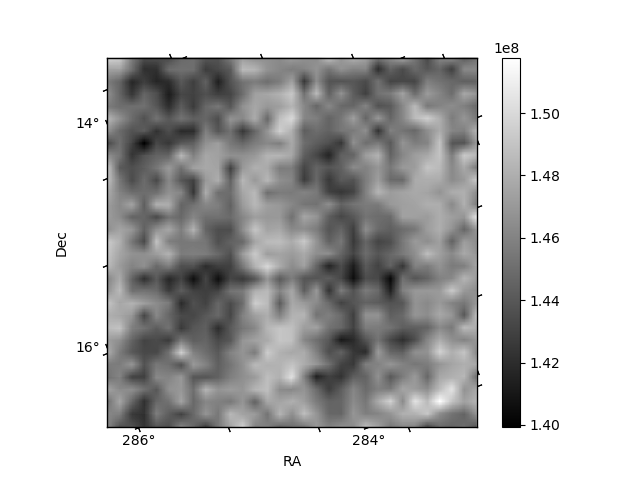
Histogram calculated using DETX and DETY for each event in the final _common_clean file
| Quadrant A | 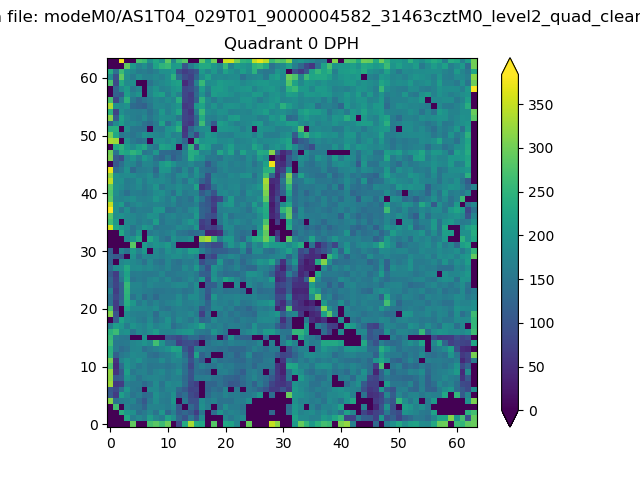 |
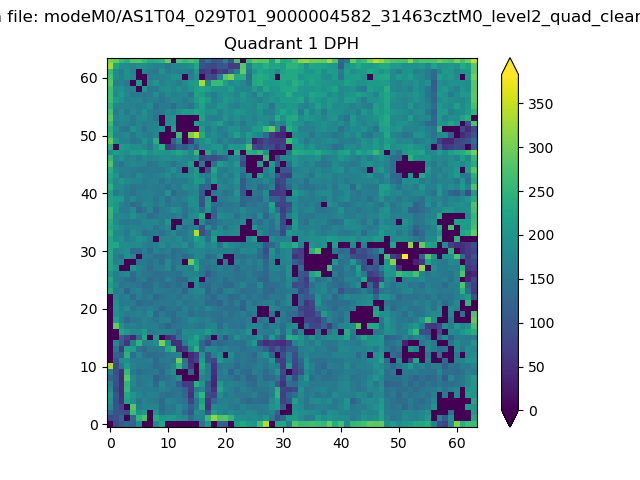 |
Quadrant B |
|---|---|---|---|
| Quadrant D | 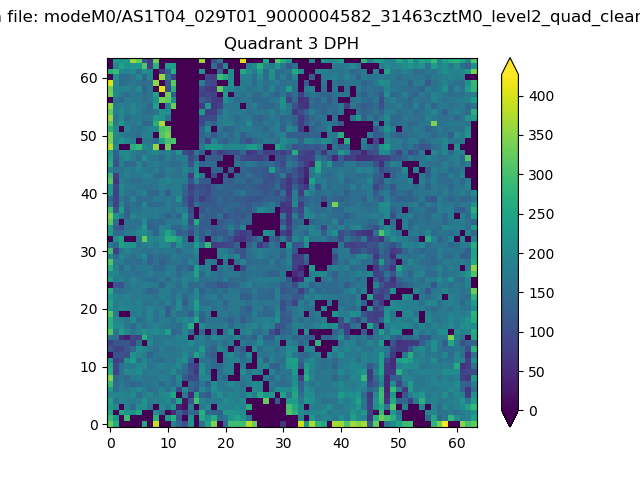 |
 |
Quadrant C |
| Plot type | Count rate plots | Images |
|---|---|---|
| Comparison with Poisson distribution Blue bars denote a histogram of data divided into 1 sec bins. Red curve is a Poisson curve with rate = median count rate of data. |
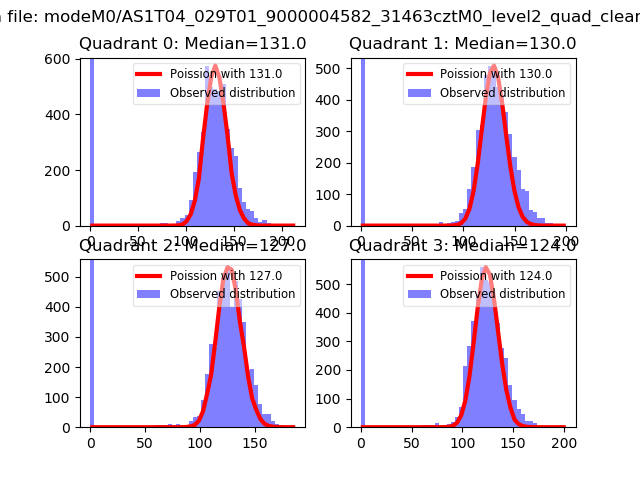 |
 |
| Quadrant-wise count rates Data is divided into 100 sec bins |
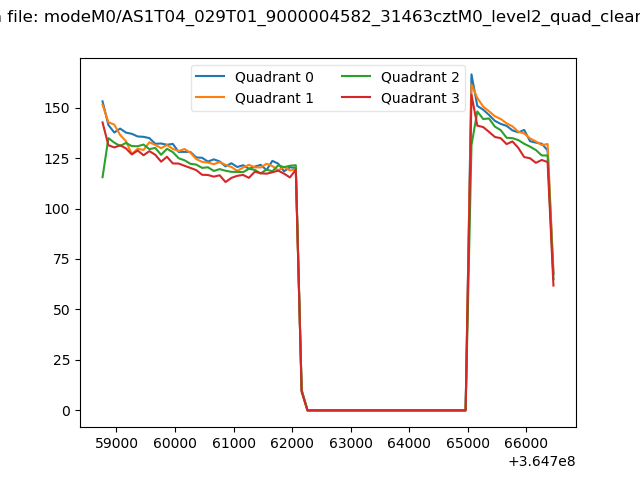 |
|
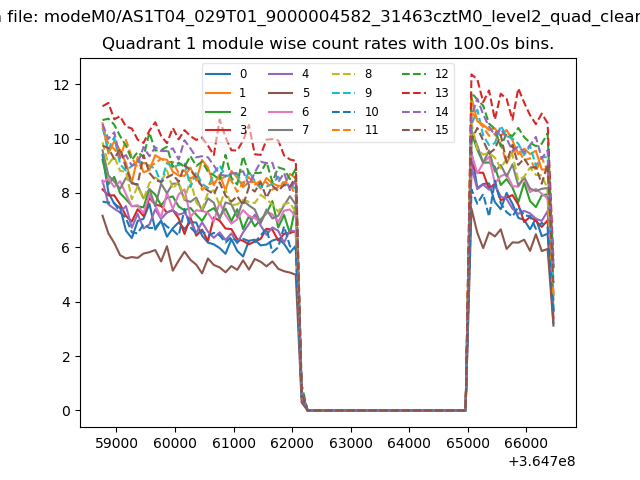
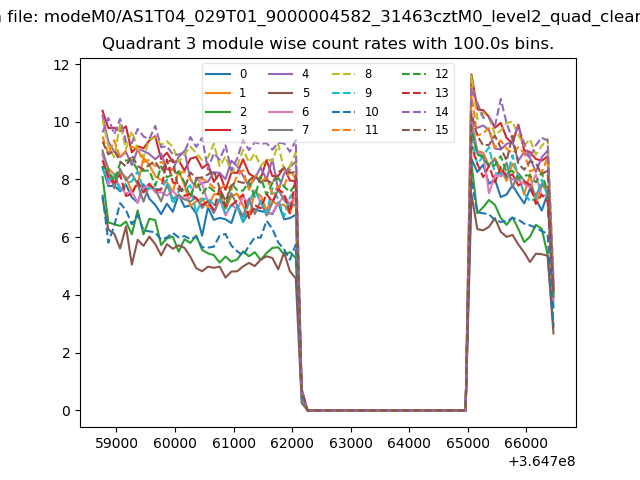
| Module-wise count rates for Quadrant A Data is divided into 100 sec bins |
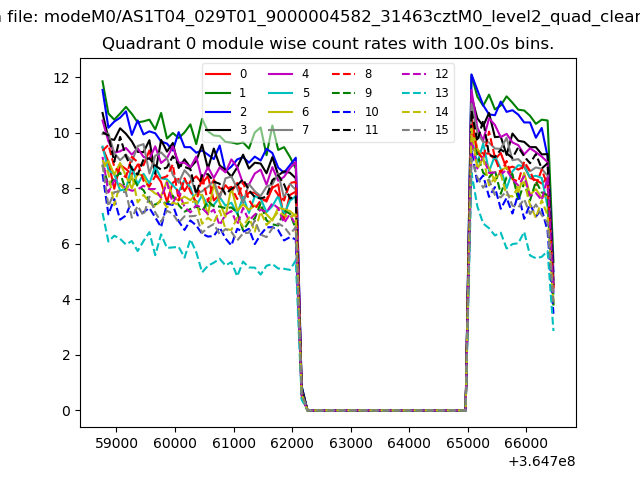 |
 |
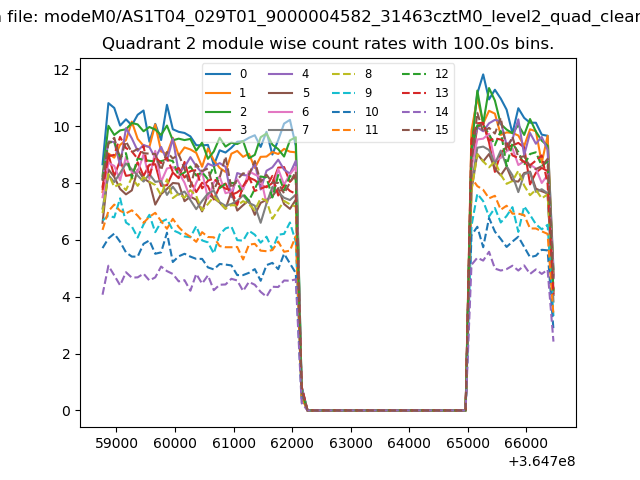
| Module-wise count rates for Quadrant B Data is divided into 100 sec bins |
 |
 |
| Module-wise count rates for Quadrant C Data is divided into 100 sec bins |
 |
 |
| Module-wise count rates for Quadrant D Data is divided into 100 sec bins |
 |
 |
| Parameter | Plot |
|---|---|
| CZT HV Monitor | 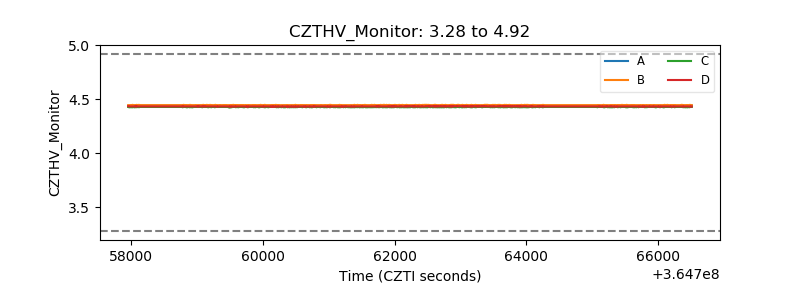 |
| D_VDD | 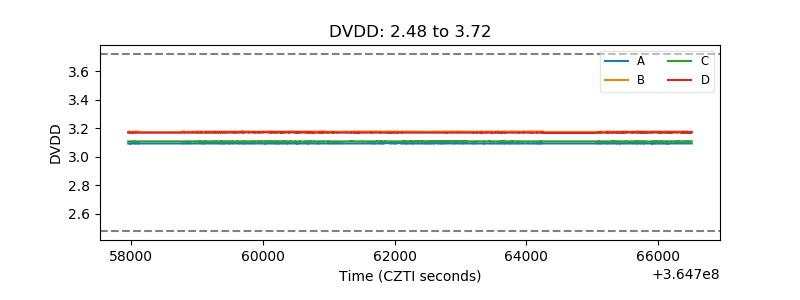 |
| Temperature 1 |  |
| Veto HV Monitor | 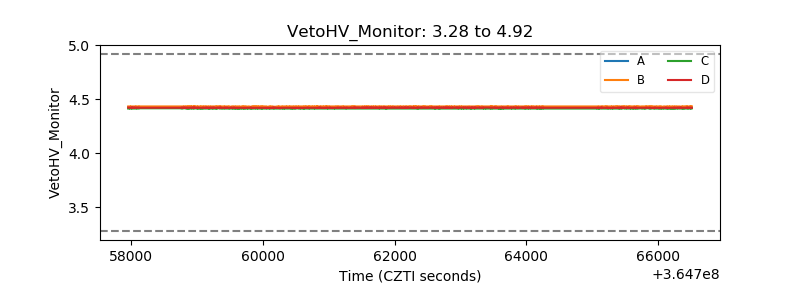 |
| Veto LLD |  |
| Alpha Counter | 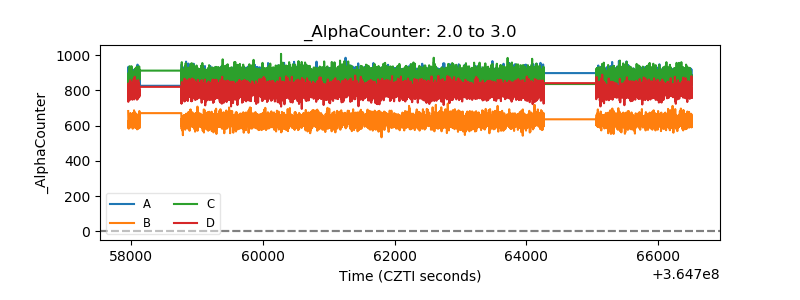 |
| _CPM_Rate | 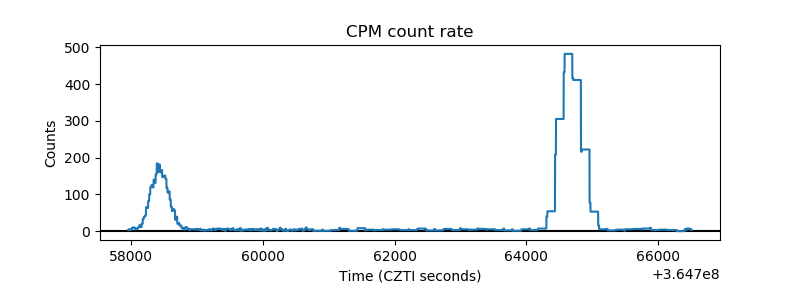 |
| CZT Counter | 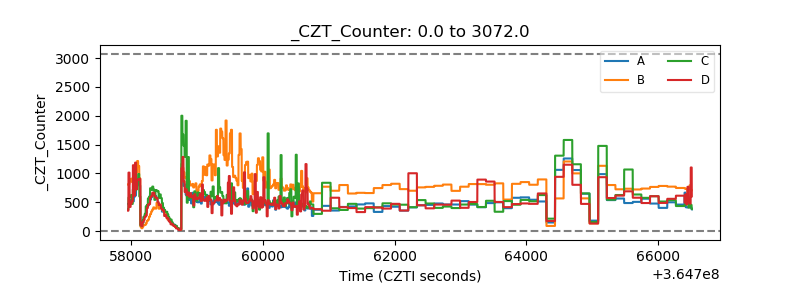 |
| +2.5 Volts monitor |  |
| +5 Volts monitor | 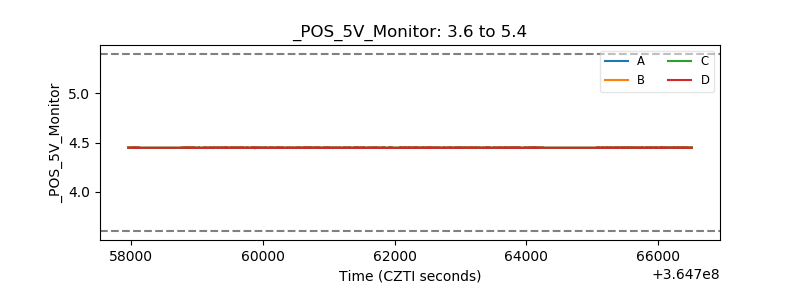 |
| _ROLL_ROT | 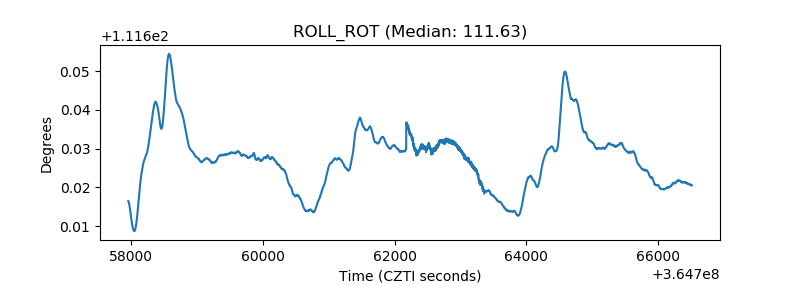 |
| _Roll_DEC | 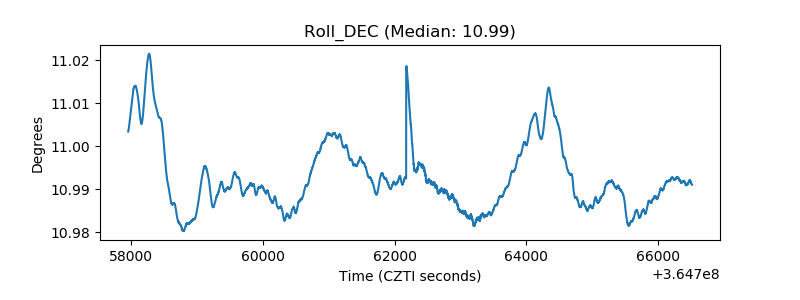 |
| _Roll_RA | 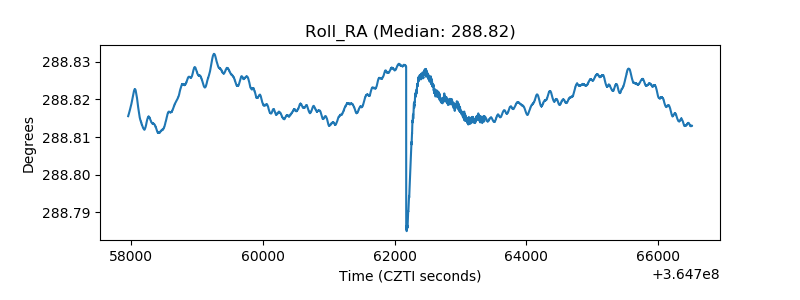 |
| Veto Counter | 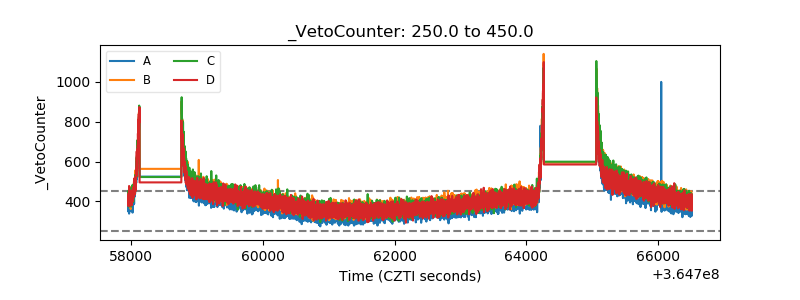 |