| Param | Original file | Final file |
|---|---|---|
| Filename | modeM0/AS1T04_029T01_9000004582_31466cztM0_level2.evt | modeM0/AS1T04_029T01_9000004582_31466cztM0_level2_quad_clean.evt |
| Size (bytes) | 521,789,760 | 94,561,920 |
| Size | 497.6 MB | 90.2 MB |
| Events in quadrant A | 3,148,324 | 617,265 |
| Events in quadrant B | 5,184,888 | 627,378 |
| Events in quadrant C | 3,507,904 | 588,115 |
| Events in quadrant D | 3,522,763 | 579,625 |
| Mode SS | |||
|---|---|---|---|
| Quadrant | BADHDUFLAG | Total packets | Discarded packets |
| A | 0 | 132 | 0 |
| B | 0 | 132 | 0 |
| C | 0 | 132 | 0 |
| D | 0 | 132 | 0 |
| Mode M9 | |||
|---|---|---|---|
| Quadrant | BADHDUFLAG | Total packets | Discarded packets |
| A | 0 | 22 | 0 |
| B | 0 | 22 | 0 |
| C | 0 | 22 | 0 |
| D | 0 | 22 | 0 |
| Mode M0 | |||
|---|---|---|---|
| Quadrant | BADHDUFLAG | Total packets | Discarded packets |
| A | 0 | 13524 | 2 |
| B | 0 | 19791 | 2 |
| C | 0 | 14579 | 2 |
| D | 0 | 14802 | 2 |
| Quadrant | Total seconds | Saturated seconds | Saturation percentage |
|---|---|---|---|
| A | 6476 | 54 | 0.833848% |
| B | 6476 | 119 | 1.837554% |
| C | 6475 | 232 | 3.583012% |
| D | 6476 | 54 | 0.833848% |
Noise dominated data is calculated using 1-second bins in cleaned event files. If a bin has >2000 counts, and if more than 50% of those come from <1% of pixels, then it is considered to be noise-dominated and hence unusable.
| Quadrant | # 1 sec bins | Bins with >0 counts | Bins with >2000 counts | High rate bins dominated by noise | Noise dominated (total time) | Noise dominated (detector-on time) | Marked lightcurve |
|---|---|---|---|---|---|---|---|
| A | 8601 | 6476 | 0 | 0 | 0.00% | 0.00% | 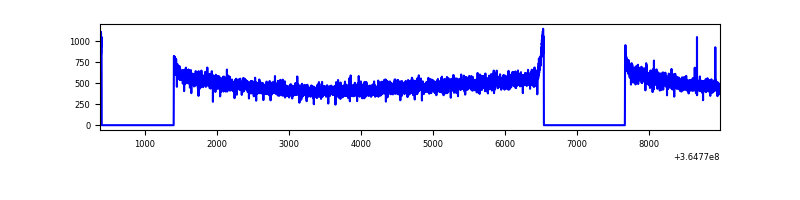 |
| B | 8601 | 6476 | 0 | 0 | 0.00% | 0.00% | 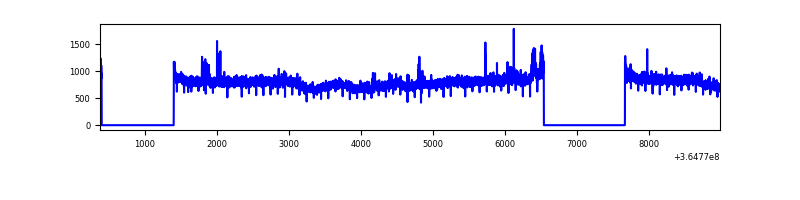 |
| C | 8600 | 6475 | 67 | 67 | 0.78% | 1.03% | 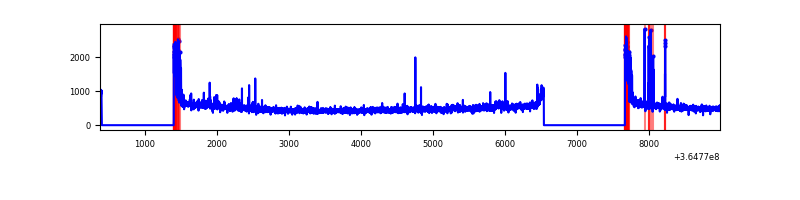 |
| D | 8601 | 6476 | 7 | 7 | 0.08% | 0.11% | 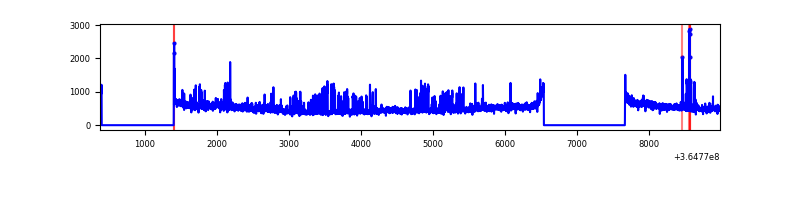 |
Top three noisy pixels from each quadrant. If the there are fewer than three noisy pixels in the level2.evt file, extra rows are filled as -1
| Pixel properties | Quadrant properties | ||||||
|---|---|---|---|---|---|---|---|
| Quadrant | DetID | PixID | Counts | Sigma | Mean | Median | Sigma |
| A | 13 | 254 | 12089 | 69.54 | 816 | 802 | 162.3 |
| A | 3 | 137 | 8373 | 46.65 | 816 | 802 | 162.3 |
| A | 0 | 226 | 6831 | 37.15 | 816 | 802 | 162.3 |
| B | 6 | 159 | 1901509 | 12252.3 | 810 | 790 | 155.1 |
| B | 0 | 190 | 60732 | 386.39 | 810 | 790 | 155.1 |
| B | 4 | 80 | 37239 | 234.96 | 810 | 790 | 155.1 |
| C | 0 | 10 | 310111 | 1689.31 | 779 | 787 | 183.1 |
| C | 14 | 238 | 125283 | 679.91 | 779 | 787 | 183.1 |
| C | 2 | 114 | 14546 | 75.14 | 779 | 787 | 183.1 |
| D | 8 | 195 | 454620 | 2432.87 | 788 | 767 | 186.6 |
| D | 12 | 218 | 37670 | 197.82 | 788 | 767 | 186.6 |
| D | 12 | 79 | 25323 | 131.63 | 788 | 767 | 186.6 |
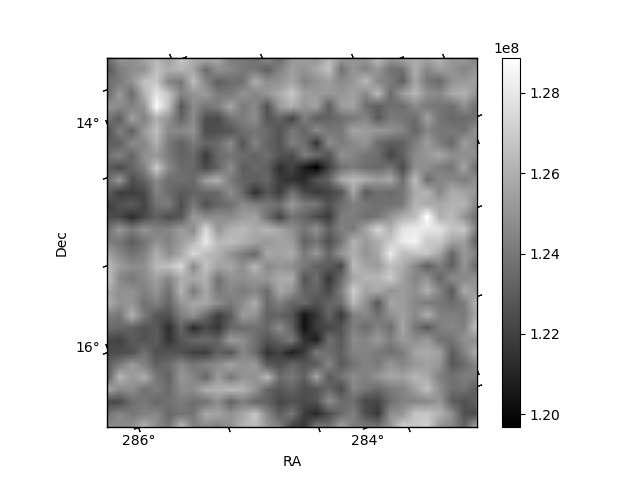
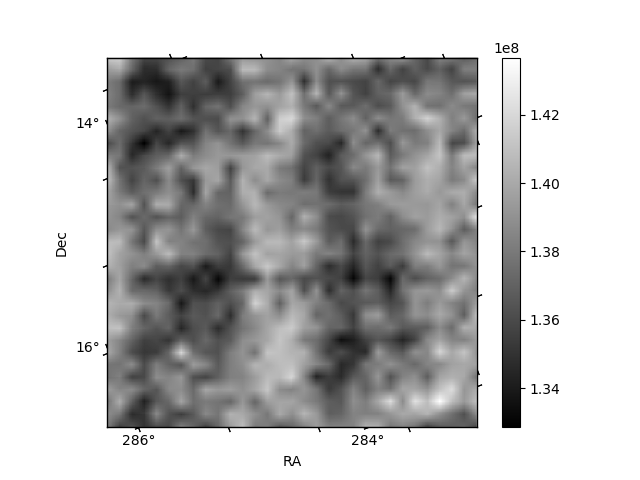
Histogram calculated using DETX and DETY for each event in the final _common_clean file
| Quadrant A | 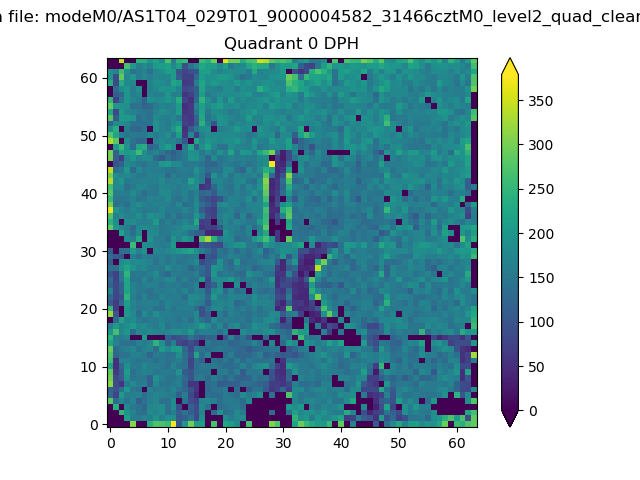 |
 |
Quadrant B |
|---|---|---|---|
| Quadrant D | 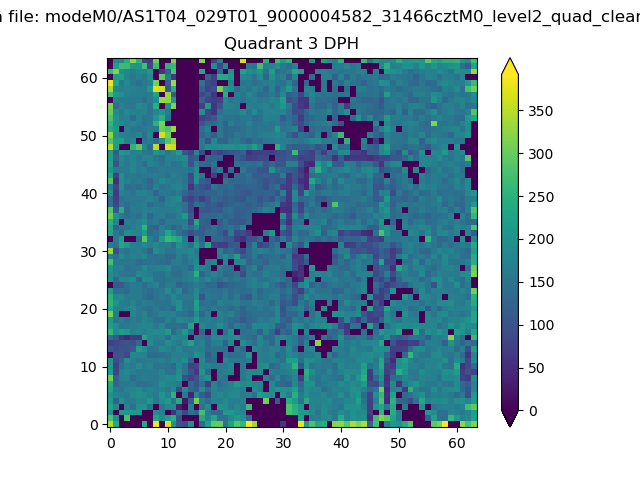 |
 |
Quadrant C |
| Plot type | Count rate plots | Images |
|---|---|---|
| Comparison with Poisson distribution Blue bars denote a histogram of data divided into 1 sec bins. Red curve is a Poisson curve with rate = median count rate of data. |
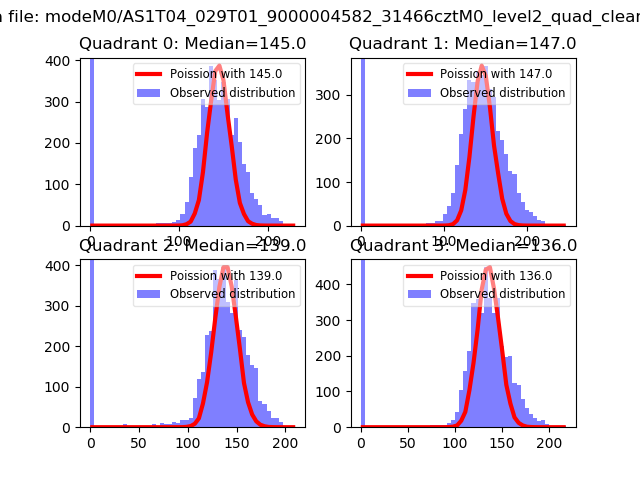 |
 |
| Quadrant-wise count rates Data is divided into 100 sec bins |
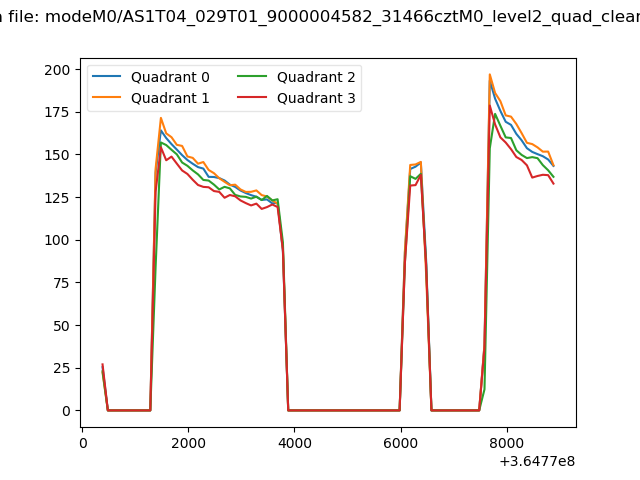 |
|
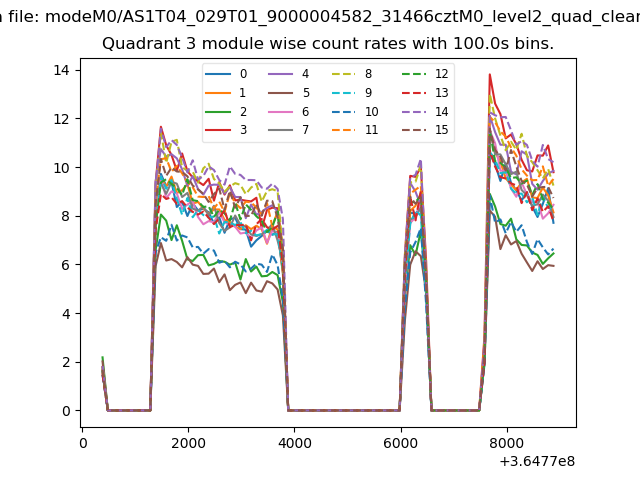
| Module-wise count rates for Quadrant A Data is divided into 100 sec bins |
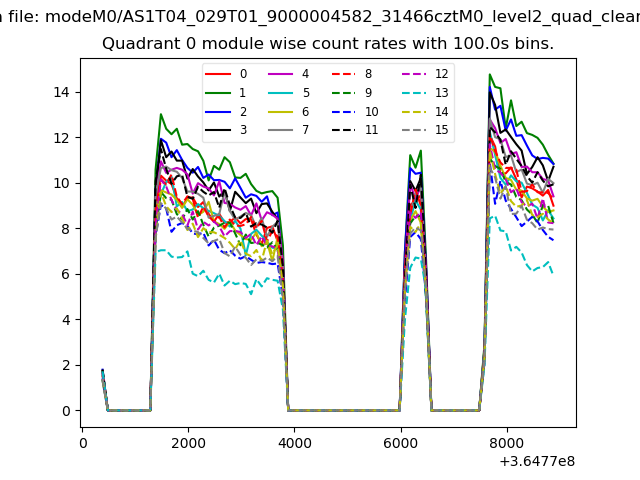 |
 |
| Module-wise count rates for Quadrant B Data is divided into 100 sec bins |
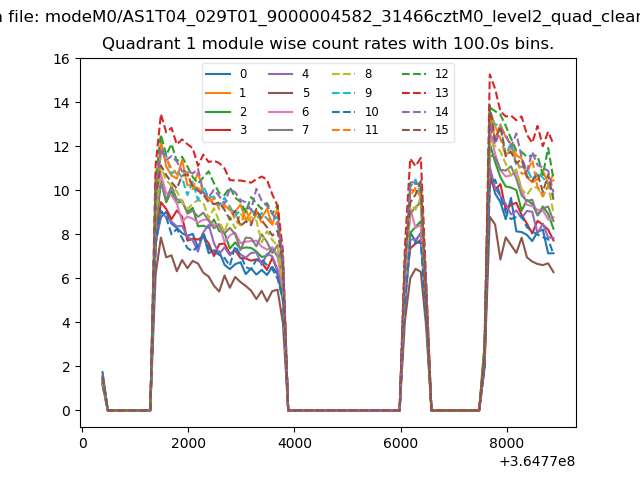 |
 |
| Module-wise count rates for Quadrant C Data is divided into 100 sec bins |
 |
 |
| Module-wise count rates for Quadrant D Data is divided into 100 sec bins |
 |
 |
| Parameter | Plot |
|---|---|
| CZT HV Monitor | 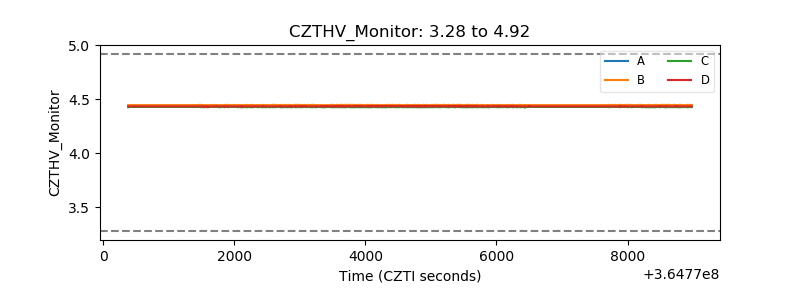 |
| D_VDD | 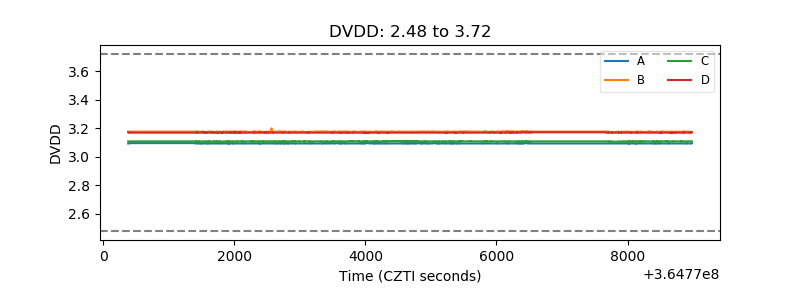 |
| Temperature 1 |  |
| Veto HV Monitor | 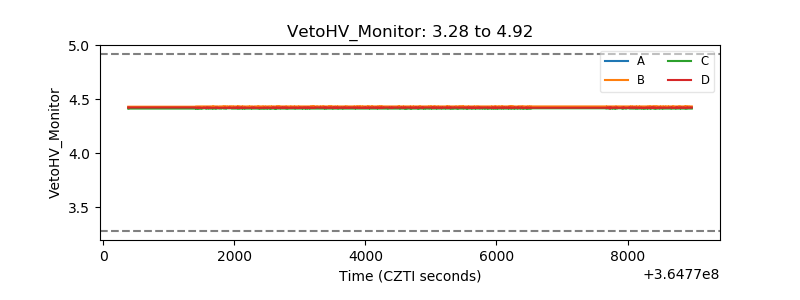 |
| Veto LLD |  |
| Alpha Counter | 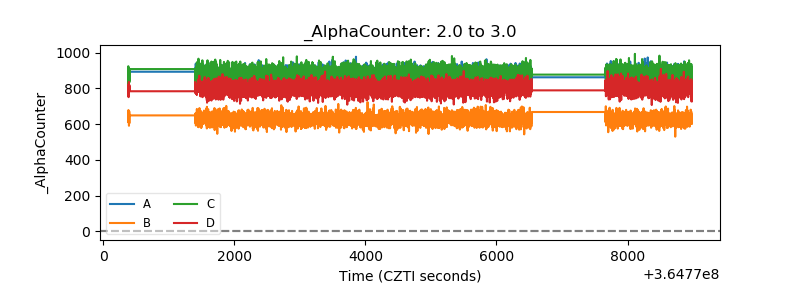 |
| _CPM_Rate | 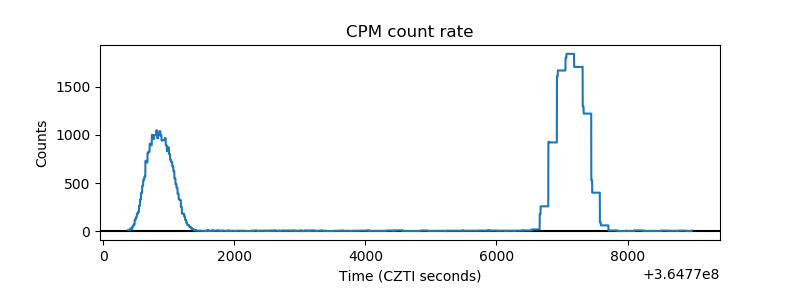 |
| CZT Counter |  |
| +2.5 Volts monitor |  |
| +5 Volts monitor | 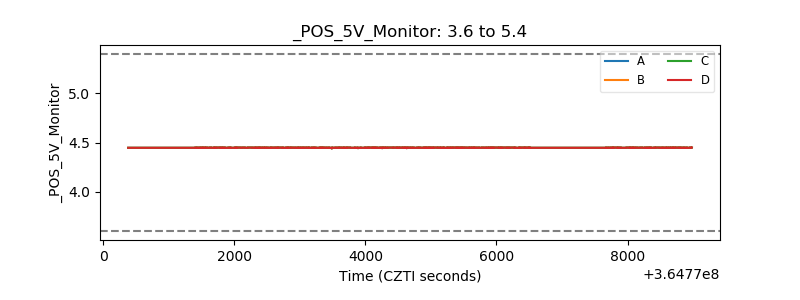 |
| _ROLL_ROT | 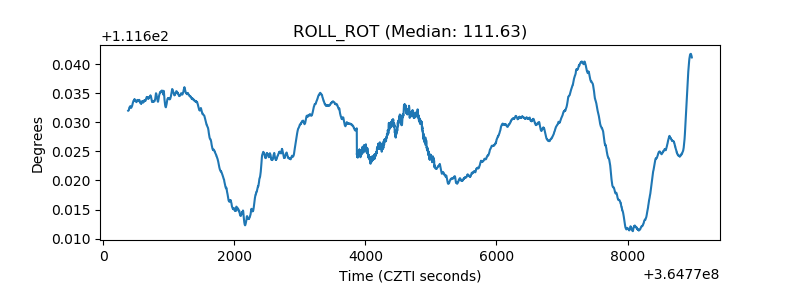 |
| _Roll_DEC | 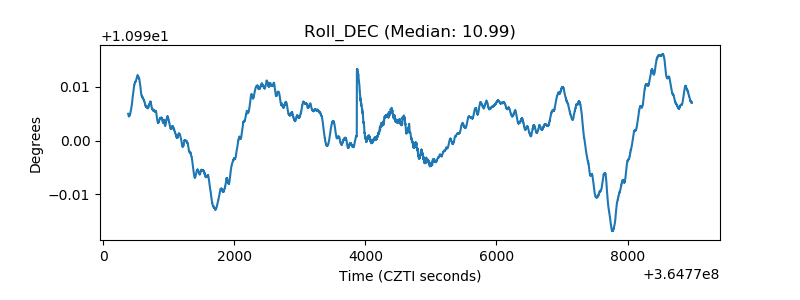 |
| _Roll_RA |  |
| Veto Counter | 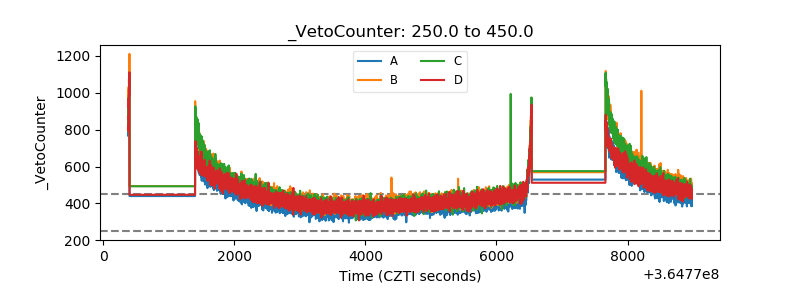 |