| Param | Original file | Final file |
|---|---|---|
| Filename | modeM0/AS1T04_029T01_9000004582_31467cztM0_level2.evt | modeM0/AS1T04_029T01_9000004582_31467cztM0_level2_quad_clean.evt |
| Size (bytes) | 528,448,320 | 96,252,480 |
| Size | 504.0 MB | 91.8 MB |
| Events in quadrant A | 3,166,141 | 638,280 |
| Events in quadrant B | 5,172,471 | 653,120 |
| Events in quadrant C | 3,524,564 | 601,800 |
| Events in quadrant D | 3,714,374 | 582,299 |
| Mode SS | |||
|---|---|---|---|
| Quadrant | BADHDUFLAG | Total packets | Discarded packets |
| A | 0 | 128 | 0 |
| B | 0 | 128 | 0 |
| C | 0 | 128 | 0 |
| D | 0 | 128 | 0 |
| Mode M9 | |||
|---|---|---|---|
| Quadrant | BADHDUFLAG | Total packets | Discarded packets |
| A | 0 | 20 | 0 |
| B | 0 | 20 | 0 |
| C | 0 | 21 | 0 |
| D | 0 | 21 | 0 |
| Mode M0 | |||
|---|---|---|---|
| Quadrant | BADHDUFLAG | Total packets | Discarded packets |
| A | 0 | 13271 | 2 |
| B | 0 | 19477 | 2 |
| C | 0 | 14336 | 2 |
| D | 0 | 15115 | 2 |
| Quadrant | Total seconds | Saturated seconds | Saturation percentage |
|---|---|---|---|
| A | 6295 | 20 | 0.317712% |
| B | 6295 | 119 | 1.890389% |
| C | 6295 | 221 | 3.510723% |
| D | 6295 | 102 | 1.620334% |
Noise dominated data is calculated using 1-second bins in cleaned event files. If a bin has >2000 counts, and if more than 50% of those come from <1% of pixels, then it is considered to be noise-dominated and hence unusable.
| Quadrant | # 1 sec bins | Bins with >0 counts | Bins with >2000 counts | High rate bins dominated by noise | Noise dominated (total time) | Noise dominated (detector-on time) | Marked lightcurve |
|---|---|---|---|---|---|---|---|
| A | 7536 | 6295 | 0 | 0 | 0.00% | 0.00% | 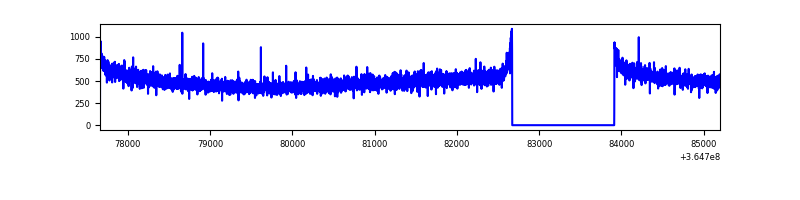 |
| B | 7536 | 6296 | 2 | 2 | 0.03% | 0.03% | 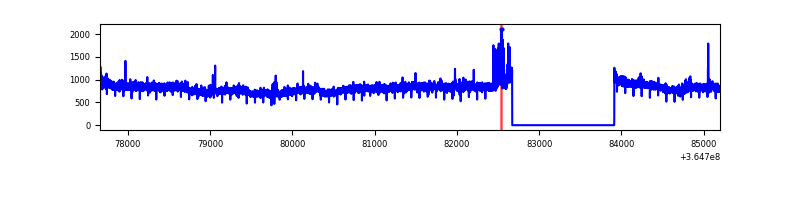 |
| C | 7536 | 6296 | 83 | 83 | 1.10% | 1.32% | 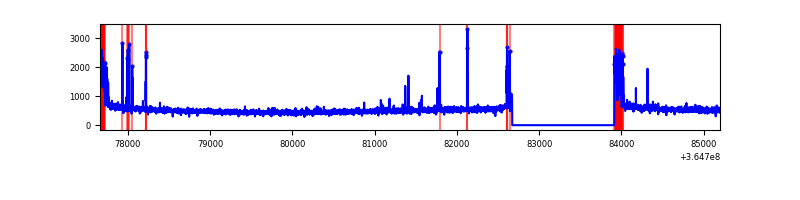 |
| D | 7536 | 6296 | 48 | 48 | 0.64% | 0.76% | 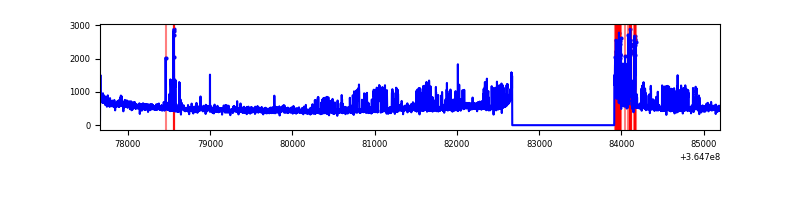 |
Top three noisy pixels from each quadrant. If the there are fewer than three noisy pixels in the level2.evt file, extra rows are filled as -1
| Pixel properties | Quadrant properties | ||||||
|---|---|---|---|---|---|---|---|
| Quadrant | DetID | PixID | Counts | Sigma | Mean | Median | Sigma |
| A | 13 | 254 | 10303 | 58.46 | 821 | 808 | 162.4 |
| A | 3 | 137 | 8022 | 44.42 | 821 | 808 | 162.4 |
| A | 0 | 226 | 6830 | 37.08 | 821 | 808 | 162.4 |
| B | 6 | 159 | 1839825 | 11921.52 | 817 | 798 | 154.3 |
| B | 0 | 190 | 92192 | 592.46 | 817 | 798 | 154.3 |
| B | 4 | 80 | 33385 | 211.25 | 817 | 798 | 154.3 |
| C | 0 | 10 | 327640 | 1789.86 | 776 | 783 | 182.6 |
| C | 14 | 238 | 127089 | 691.65 | 776 | 783 | 182.6 |
| C | 10 | 22 | 19805 | 104.16 | 776 | 783 | 182.6 |
| D | 8 | 195 | 562982 | 3104.45 | 776 | 758 | 181.1 |
| D | 12 | 218 | 137579 | 755.49 | 776 | 758 | 181.1 |
| D | 12 | 79 | 24038 | 128.55 | 776 | 758 | 181.1 |
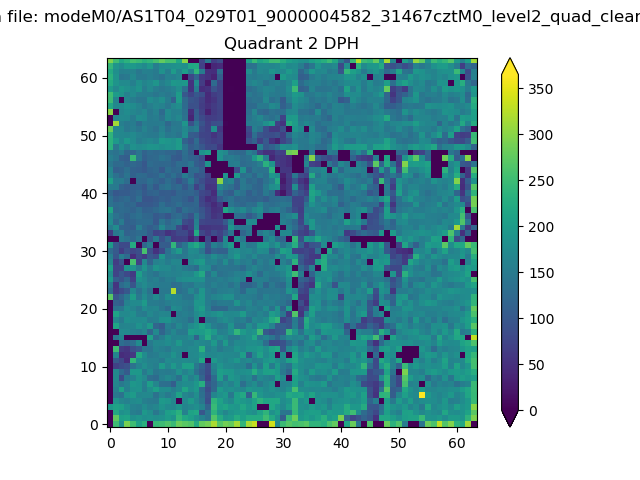
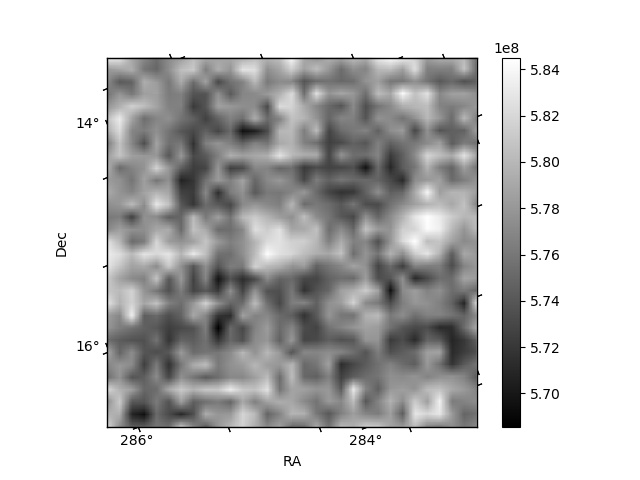
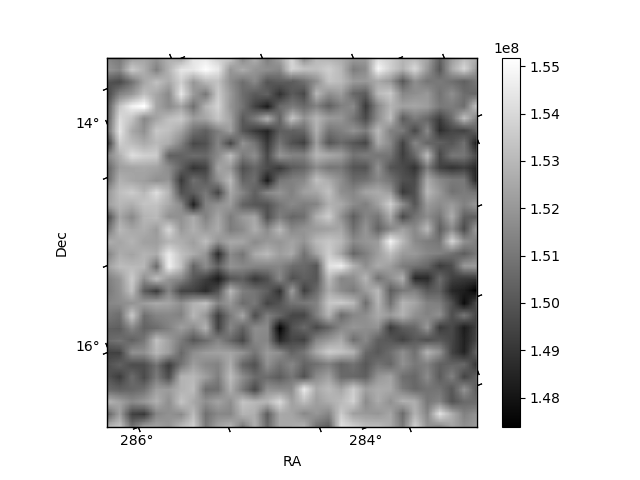
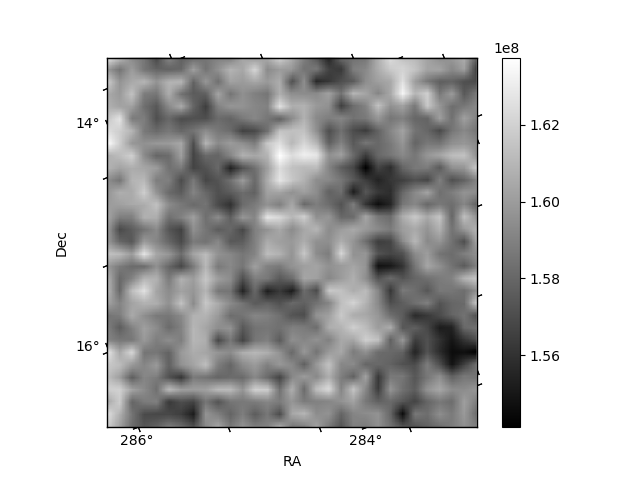
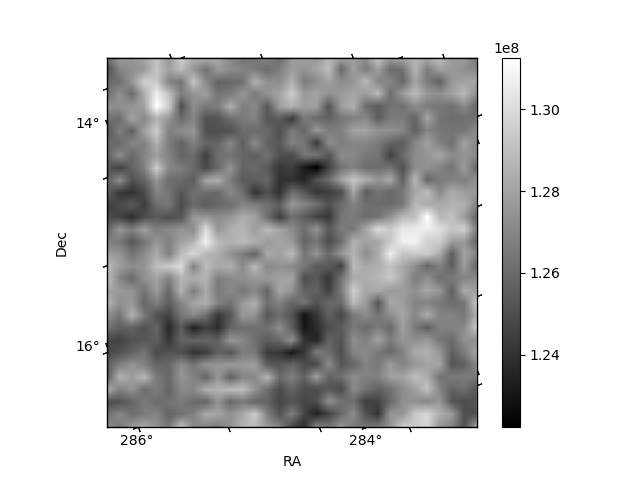
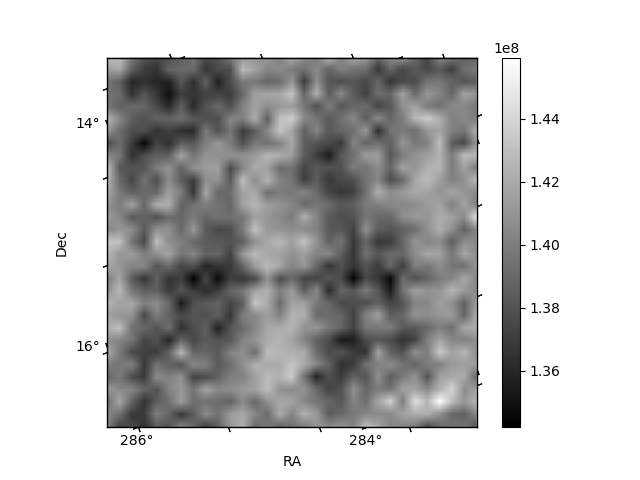
Histogram calculated using DETX and DETY for each event in the final _common_clean file
| Quadrant A | 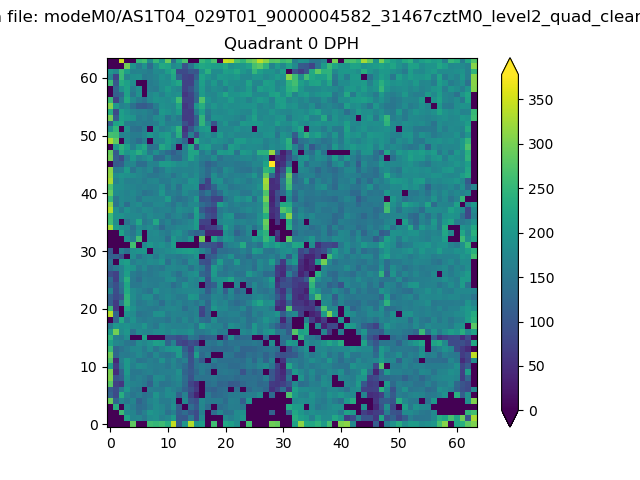 |
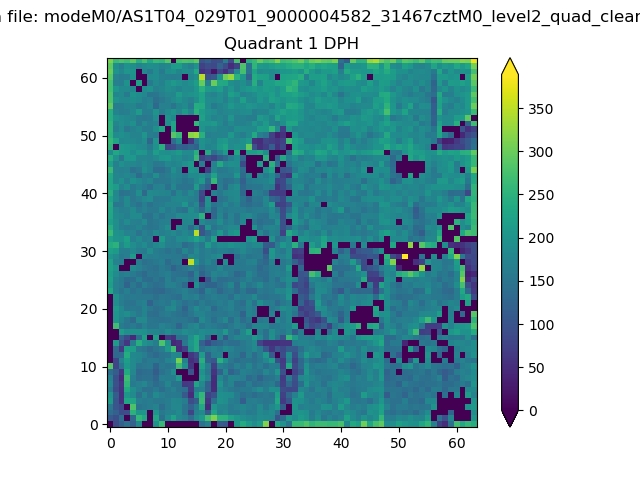 |
Quadrant B |
|---|---|---|---|
| Quadrant D | 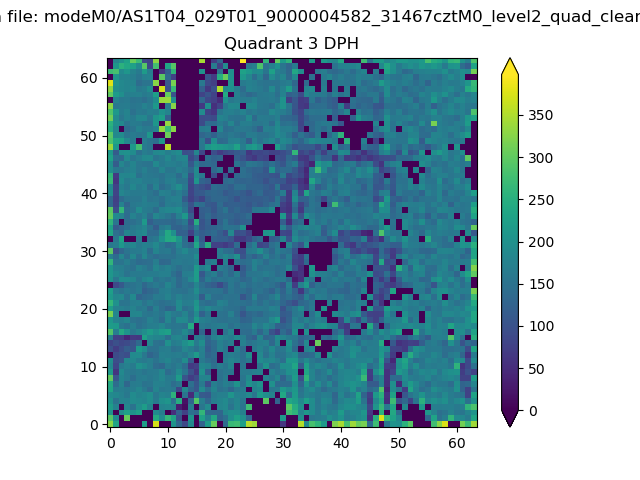 |
 |
Quadrant C |
| Plot type | Count rate plots | Images |
|---|---|---|
| Comparison with Poisson distribution Blue bars denote a histogram of data divided into 1 sec bins. Red curve is a Poisson curve with rate = median count rate of data. |
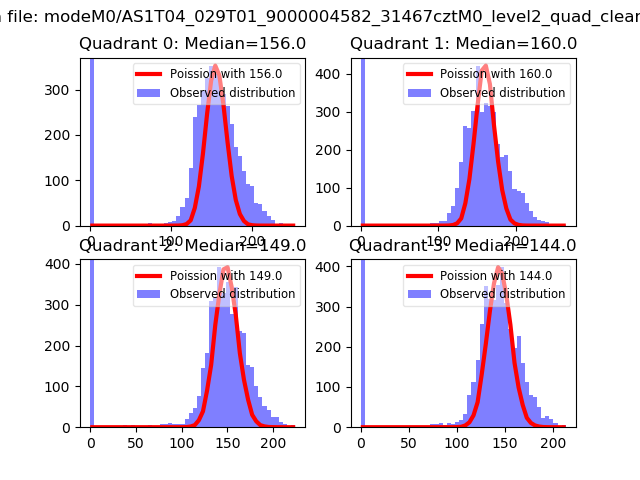 |
 |
| Quadrant-wise count rates Data is divided into 100 sec bins |
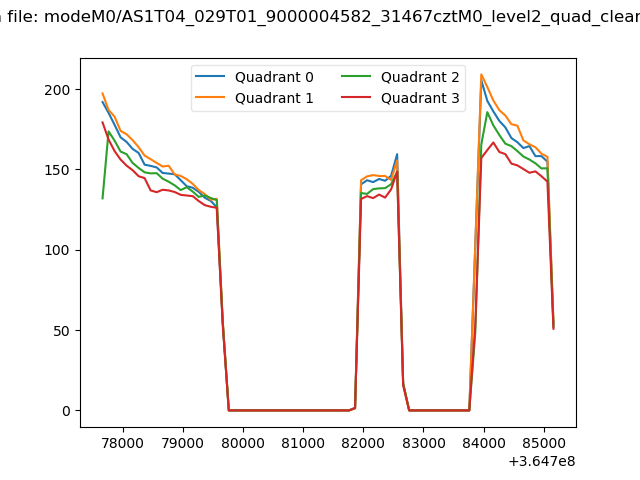 |
|
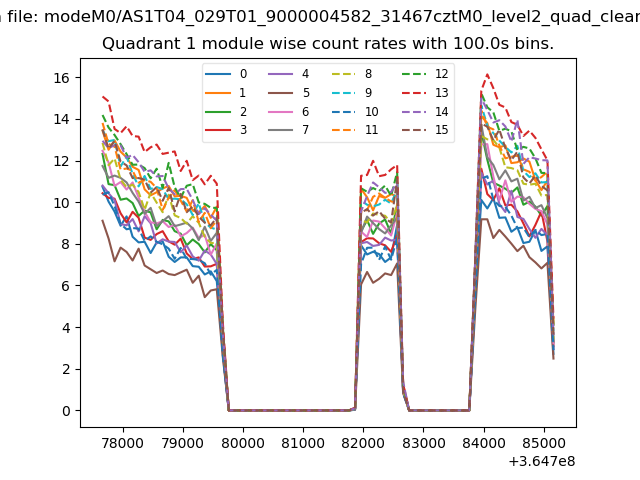
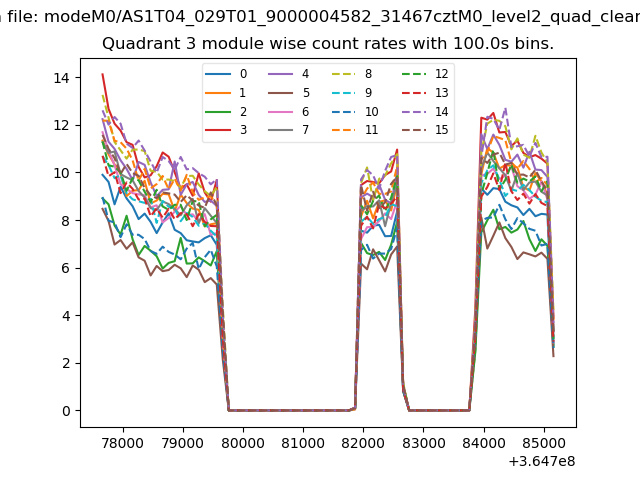
| Module-wise count rates for Quadrant A Data is divided into 100 sec bins |
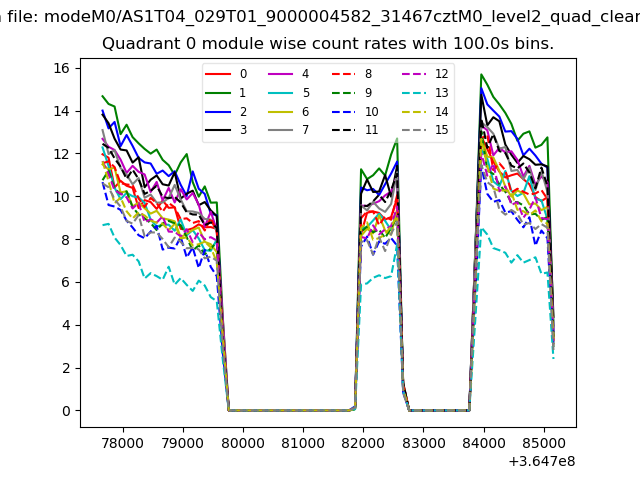 |
 |
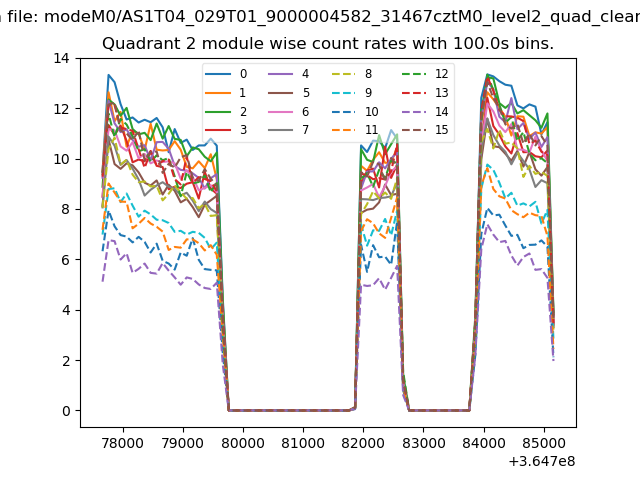
| Module-wise count rates for Quadrant B Data is divided into 100 sec bins |
 |
 |
| Module-wise count rates for Quadrant C Data is divided into 100 sec bins |
 |
 |
| Module-wise count rates for Quadrant D Data is divided into 100 sec bins |
 |
 |
| Parameter | Plot |
|---|---|
| CZT HV Monitor | 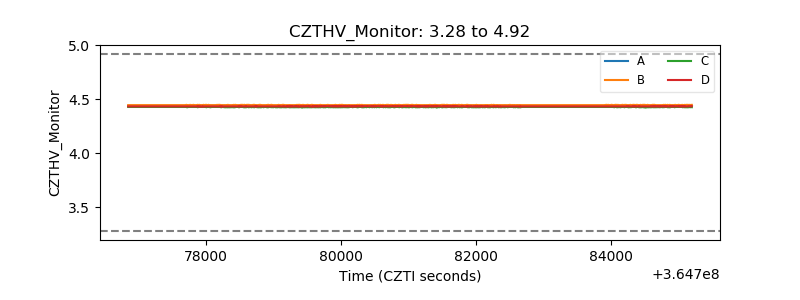 |
| D_VDD | 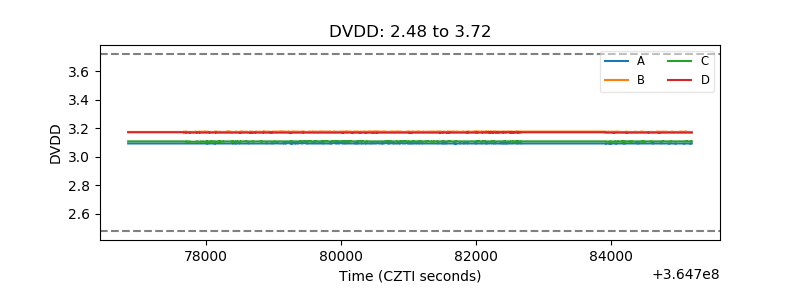 |
| Temperature 1 | 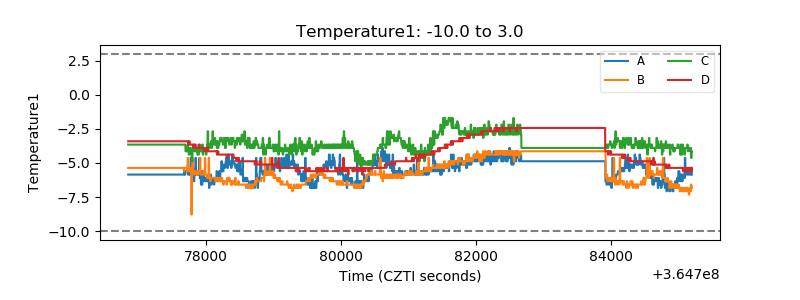 |
| Veto HV Monitor | 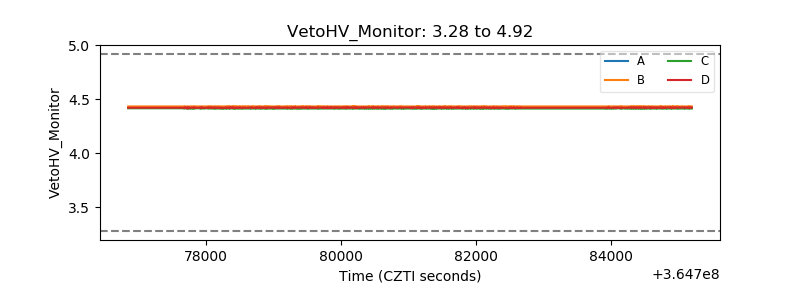 |
| Veto LLD | 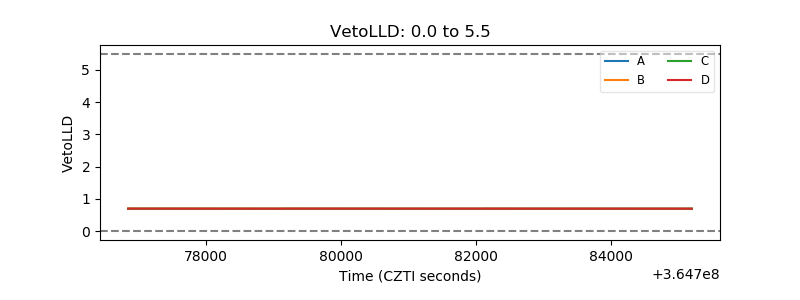 |
| Alpha Counter | 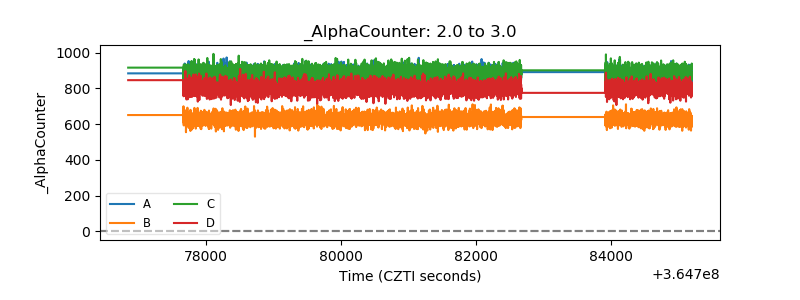 |
| _CPM_Rate | 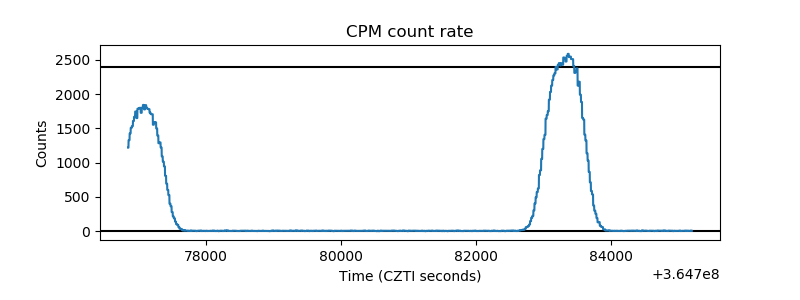 |
| CZT Counter | 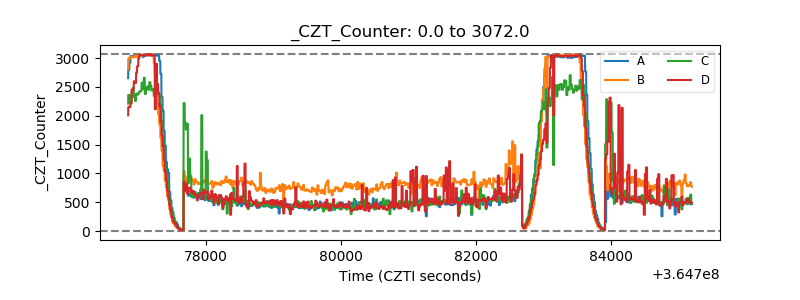 |
| +2.5 Volts monitor | 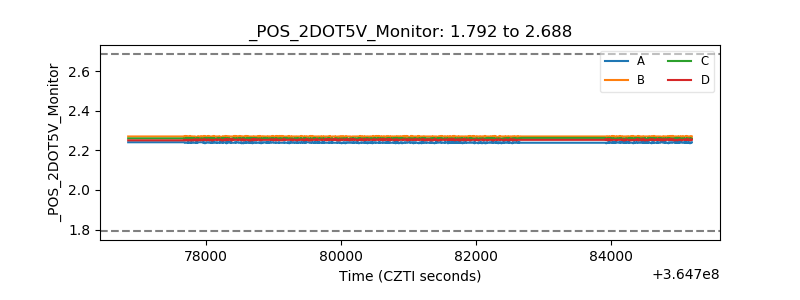 |
| +5 Volts monitor |  |
| _ROLL_ROT | 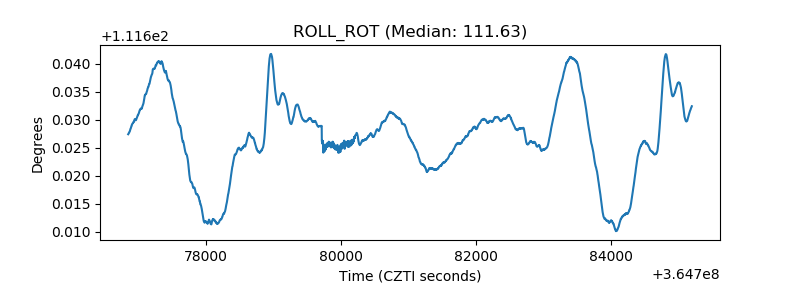 |
| _Roll_DEC | 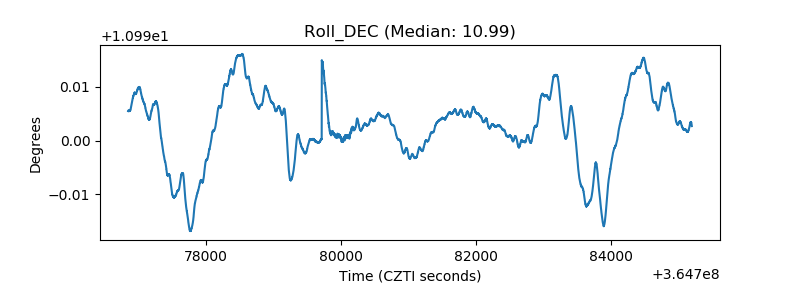 |
| _Roll_RA | 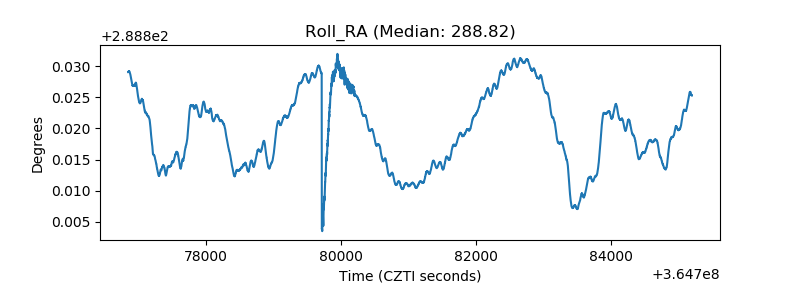 |
| Veto Counter | 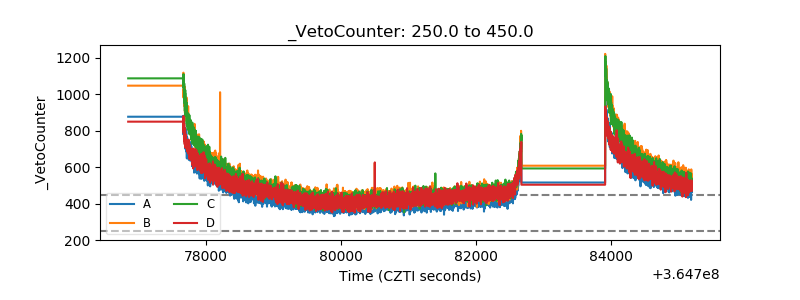 |