| Param | Original file | Final file |
|---|---|---|
| Filename | modeM0/AS1T04_029T01_9000004582_31469cztM0_level2.evt | modeM0/AS1T04_029T01_9000004582_31469cztM0_level2_quad_clean.evt |
| Size (bytes) | 538,485,120 | 86,302,080 |
| Size | 513.5 MB | 82.3 MB |
| Events in quadrant A | 3,201,121 | 572,279 |
| Events in quadrant B | 4,992,359 | 582,928 |
| Events in quadrant C | 4,189,075 | 511,874 |
| Events in quadrant D | 3,515,526 | 523,302 |
| Mode SS | |||
|---|---|---|---|
| Quadrant | BADHDUFLAG | Total packets | Discarded packets |
| A | 0 | 124 | 0 |
| B | 0 | 124 | 0 |
| C | 0 | 124 | 0 |
| D | 0 | 124 | 0 |
| Mode M9 | |||
|---|---|---|---|
| Quadrant | BADHDUFLAG | Total packets | Discarded packets |
| A | 0 | 18 | 0 |
| B | 0 | 19 | 0 |
| C | 0 | 19 | 0 |
| D | 0 | 19 | 0 |
| Mode M0 | |||
|---|---|---|---|
| Quadrant | BADHDUFLAG | Total packets | Discarded packets |
| A | 0 | 12952 | 2 |
| B | 0 | 18485 | 2 |
| C | 0 | 16061 | 3 |
| D | 0 | 14263 | 2 |
| Quadrant | Total seconds | Saturated seconds | Saturation percentage |
|---|---|---|---|
| A | 6053 | 25 | 0.413018% |
| B | 6053 | 88 | 1.453825% |
| C | 6052 | 459 | 7.584270% |
| D | 6052 | 23 | 0.380040% |
Noise dominated data is calculated using 1-second bins in cleaned event files. If a bin has >2000 counts, and if more than 50% of those come from <1% of pixels, then it is considered to be noise-dominated and hence unusable.
| Quadrant | # 1 sec bins | Bins with >0 counts | Bins with >2000 counts | High rate bins dominated by noise | Noise dominated (total time) | Noise dominated (detector-on time) | Marked lightcurve |
|---|---|---|---|---|---|---|---|
| A | 7418 | 6054 | 0 | 0 | 0.00% | 0.00% | 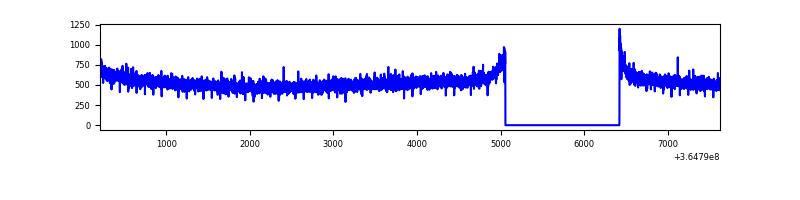 |
| B | 7418 | 6053 | 1 | 1 | 0.01% | 0.02% | 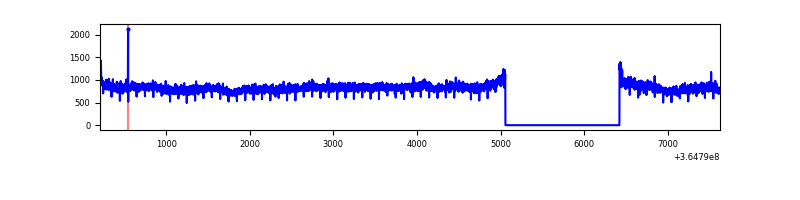 |
| C | 7417 | 6052 | 312 | 312 | 4.21% | 5.16% | 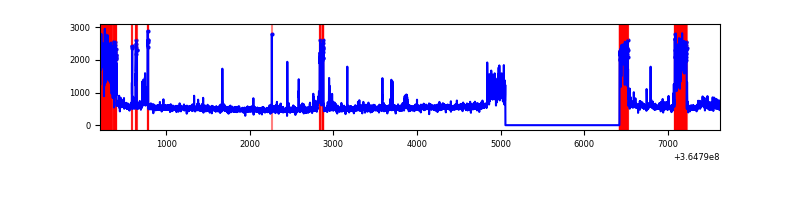 |
| D | 7417 | 6053 | 11 | 11 | 0.15% | 0.18% | 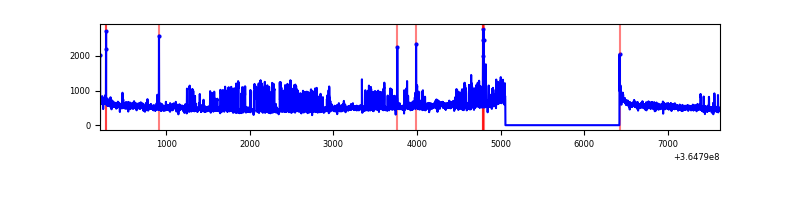 |
Top three noisy pixels from each quadrant. If the there are fewer than three noisy pixels in the level2.evt file, extra rows are filled as -1
| Pixel properties | Quadrant properties | ||||||
|---|---|---|---|---|---|---|---|
| Quadrant | DetID | PixID | Counts | Sigma | Mean | Median | Sigma |
| A | 13 | 254 | 9433 | 52.1 | 830 | 819 | 165.3 |
| A | 3 | 137 | 8025 | 43.58 | 830 | 819 | 165.3 |
| A | 0 | 226 | 6860 | 36.54 | 830 | 819 | 165.3 |
| B | 6 | 159 | 1722142 | 11183.15 | 822 | 805 | 153.9 |
| B | 0 | 190 | 23377 | 146.65 | 822 | 805 | 153.9 |
| B | 4 | 80 | 18964 | 117.98 | 822 | 805 | 153.9 |
| C | 10 | 22 | 679773 | 3830.18 | 760 | 767 | 177.3 |
| C | 0 | 10 | 393588 | 2215.85 | 760 | 767 | 177.3 |
| C | 14 | 238 | 125269 | 702.3 | 760 | 767 | 177.3 |
| D | 8 | 195 | 498625 | 2684.91 | 783 | 764 | 185.4 |
| D | 2 | 250 | 31232 | 164.31 | 783 | 764 | 185.4 |
| D | 2 | 234 | 20968 | 108.96 | 783 | 764 | 185.4 |
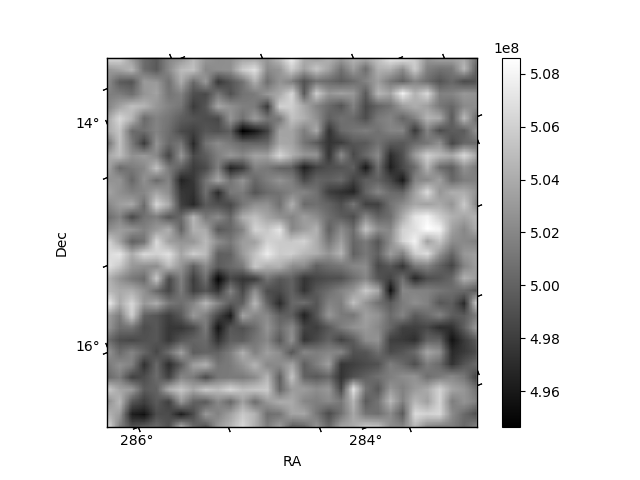
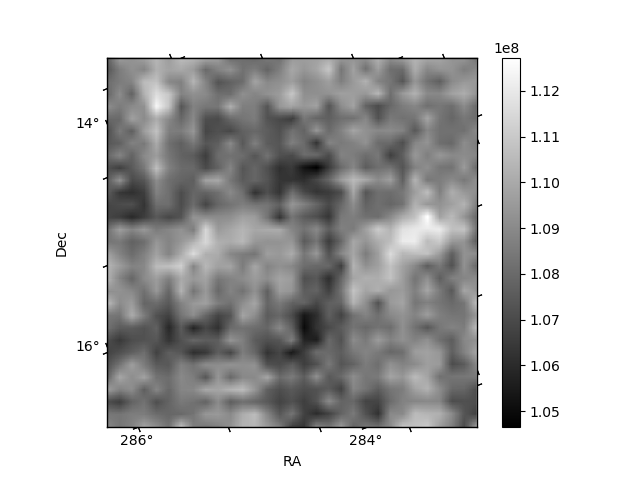
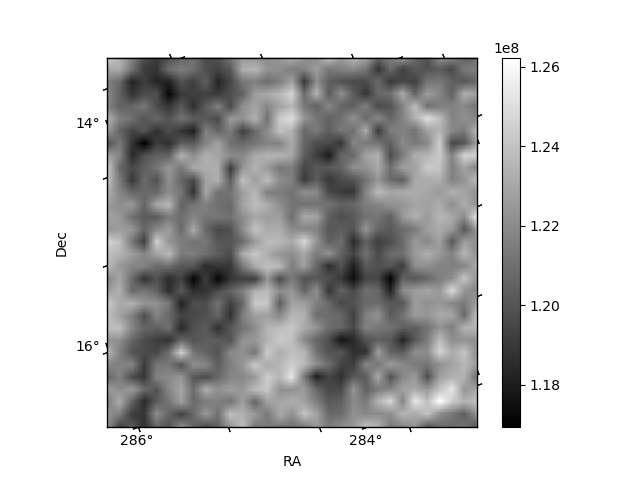
Histogram calculated using DETX and DETY for each event in the final _common_clean file
| Quadrant A | 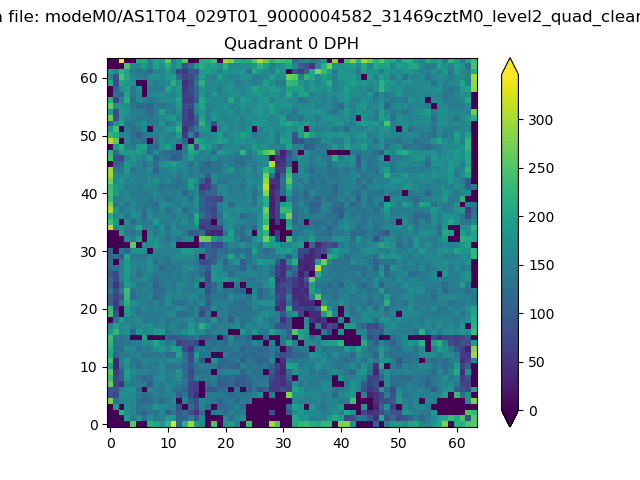 |
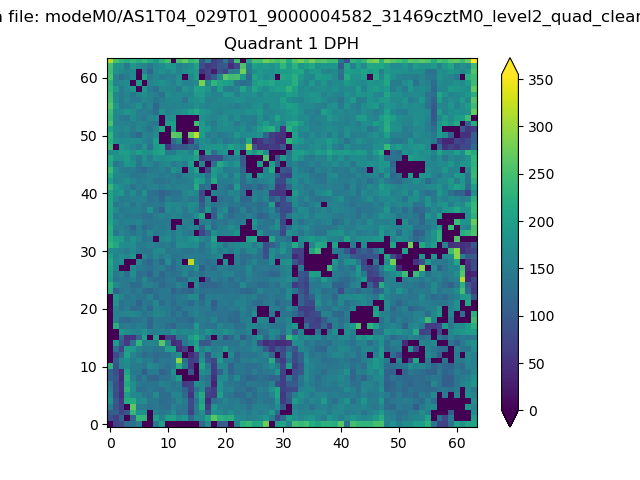 |
Quadrant B |
|---|---|---|---|
| Quadrant D | 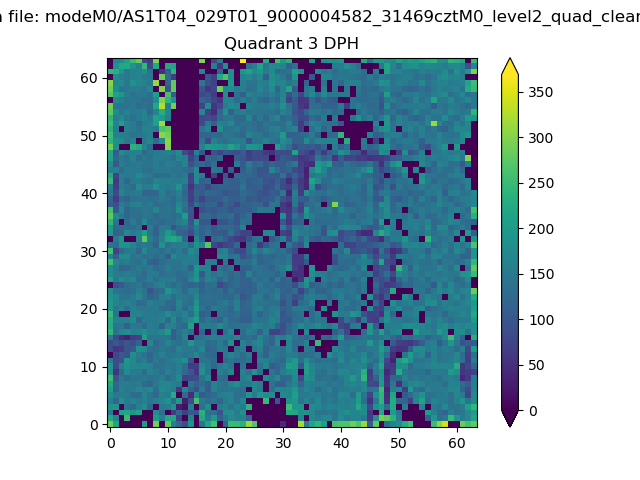 |
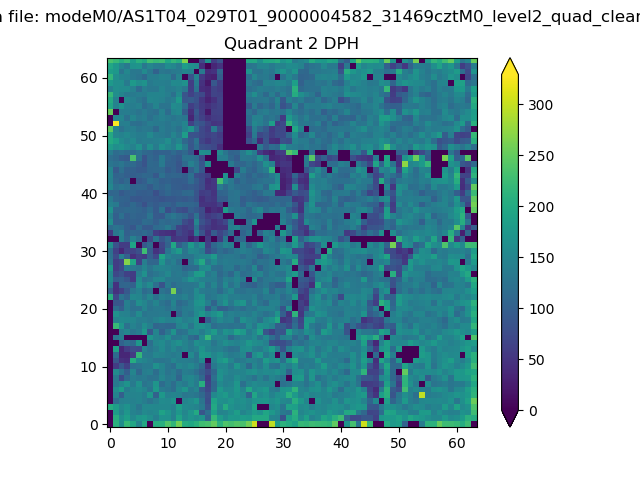 |
Quadrant C |
| Plot type | Count rate plots | Images |
|---|---|---|
| Comparison with Poisson distribution Blue bars denote a histogram of data divided into 1 sec bins. Red curve is a Poisson curve with rate = median count rate of data. |
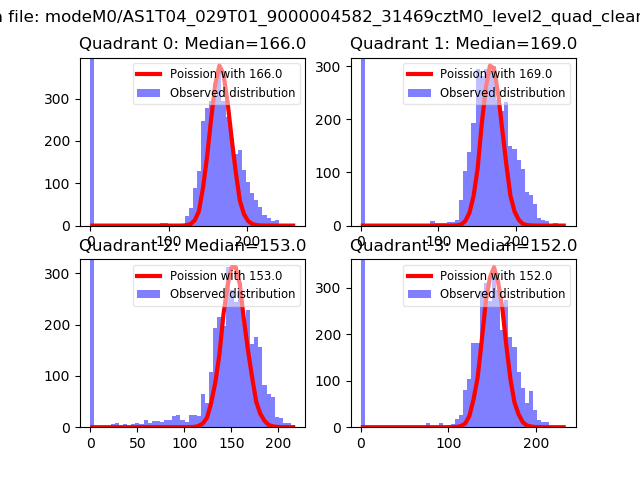 |
 |
| Quadrant-wise count rates Data is divided into 100 sec bins |
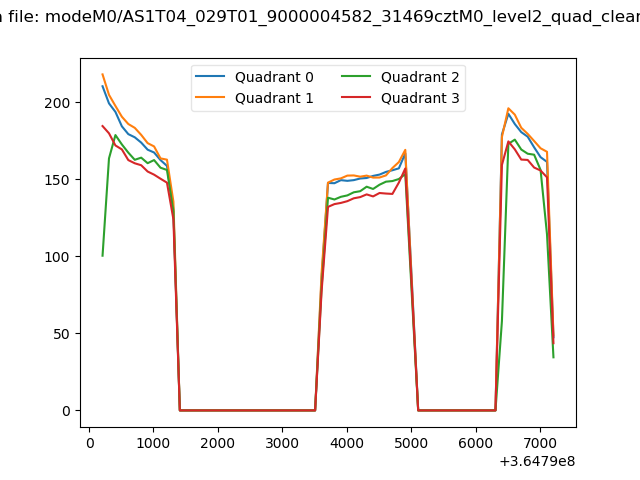 |
|
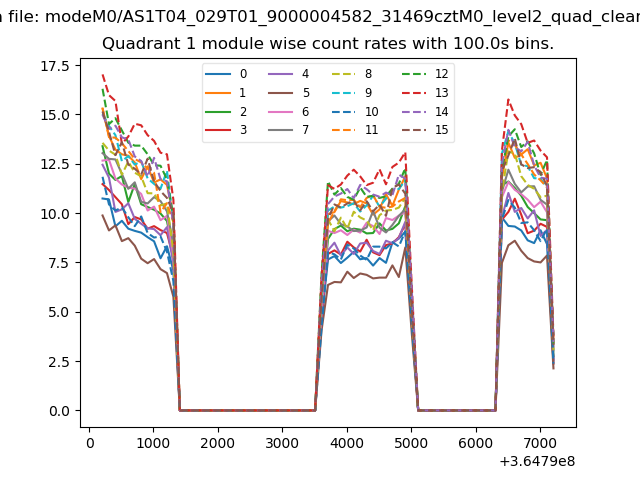
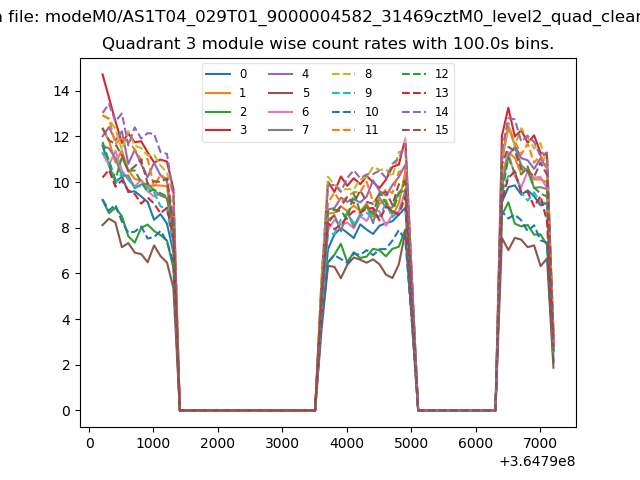
| Module-wise count rates for Quadrant A Data is divided into 100 sec bins |
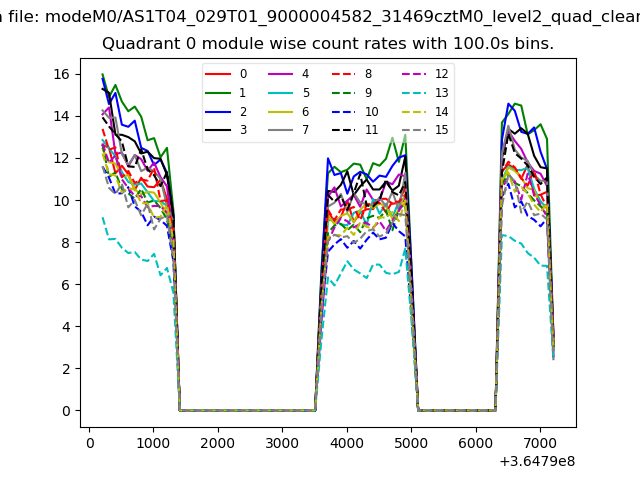 |
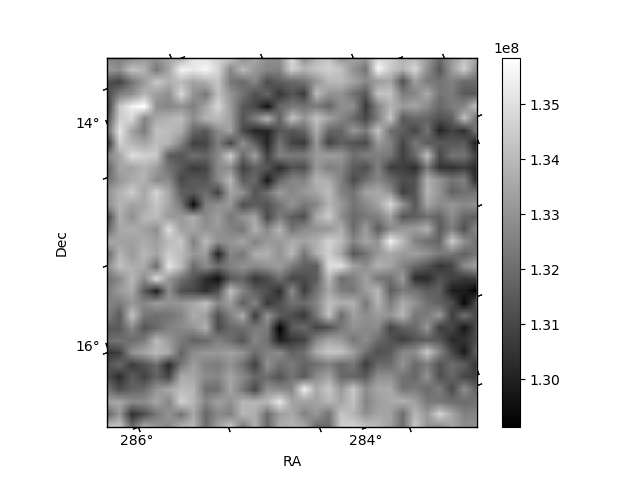 |
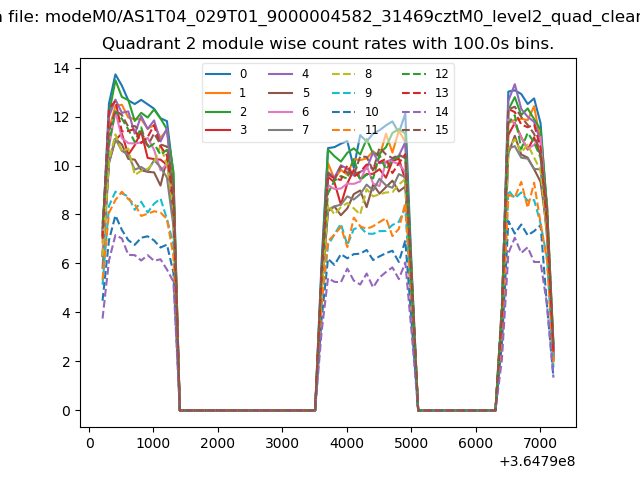
| Module-wise count rates for Quadrant B Data is divided into 100 sec bins |
 |
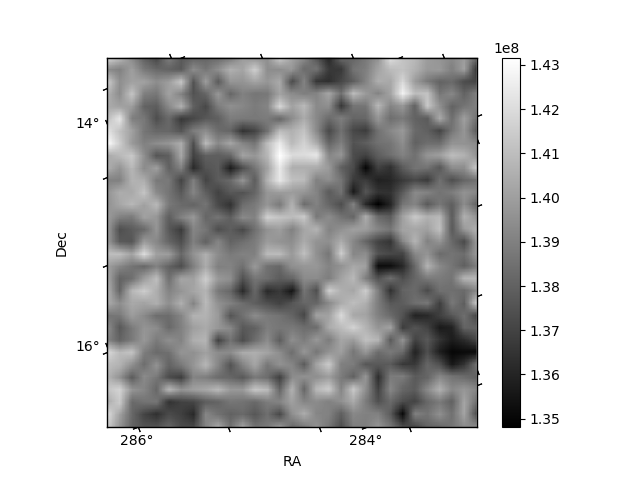 |
| Module-wise count rates for Quadrant C Data is divided into 100 sec bins |
 |
 |
| Module-wise count rates for Quadrant D Data is divided into 100 sec bins |
 |
 |
| Parameter | Plot |
|---|---|
| CZT HV Monitor | 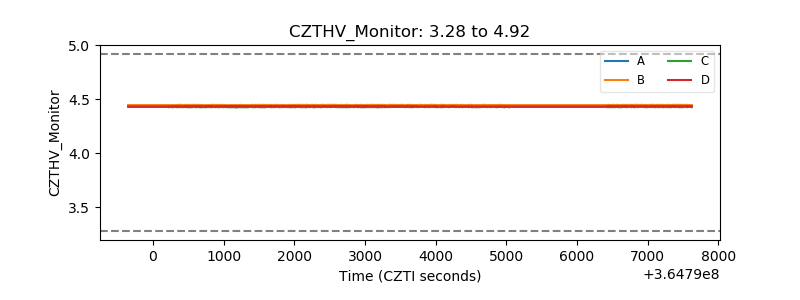 |
| D_VDD | 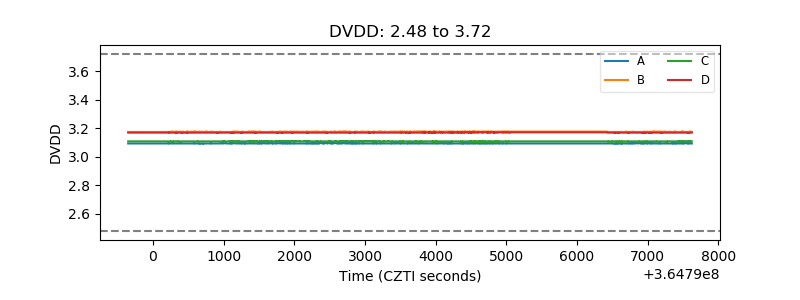 |
| Temperature 1 | 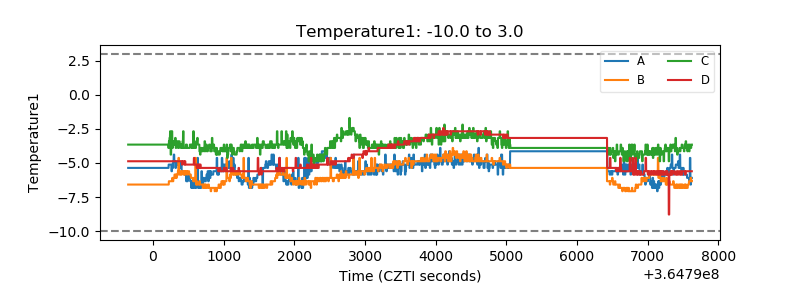 |
| Veto HV Monitor | 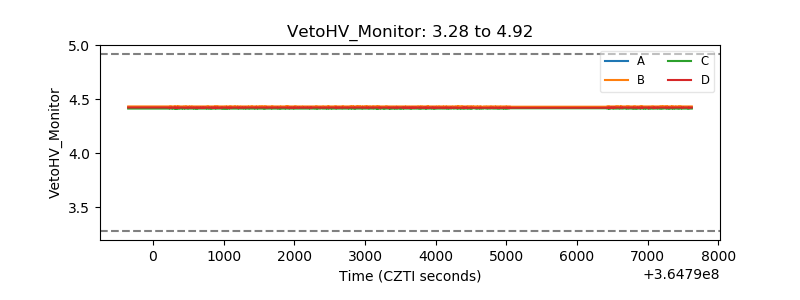 |
| Veto LLD | 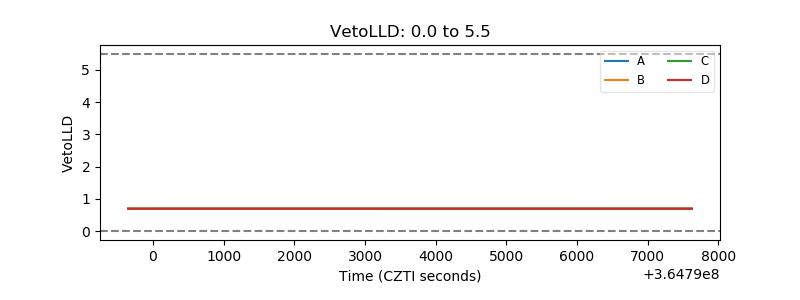 |
| Alpha Counter | 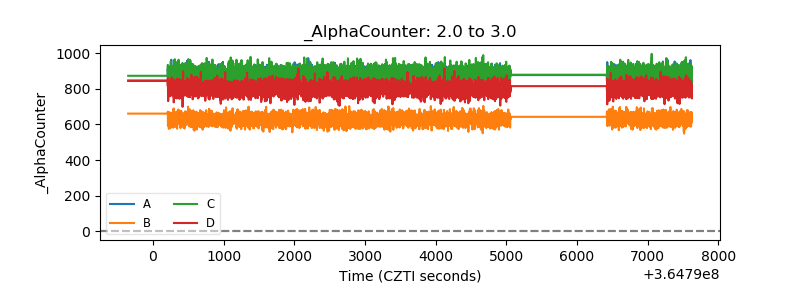 |
| _CPM_Rate | 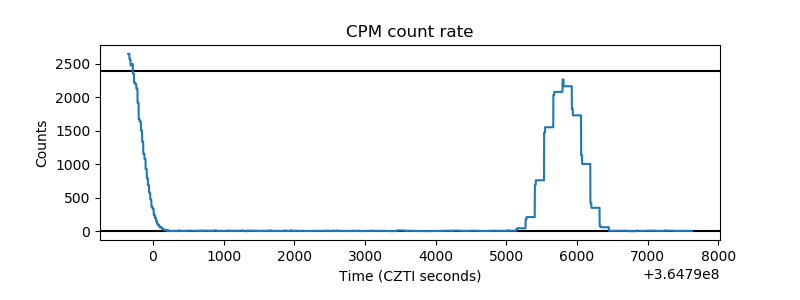 |
| CZT Counter | 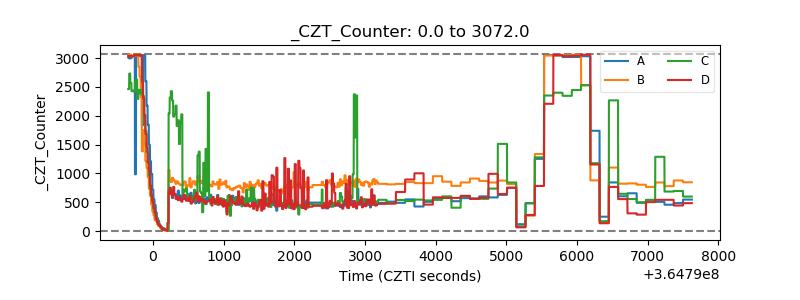 |
| +2.5 Volts monitor |  |
| +5 Volts monitor |  |
| _ROLL_ROT | 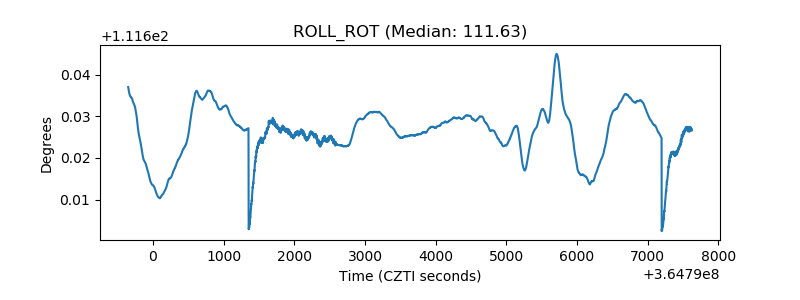 |
| _Roll_DEC | 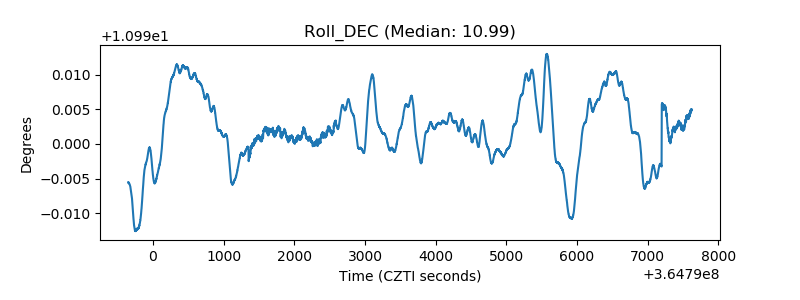 |
| _Roll_RA | 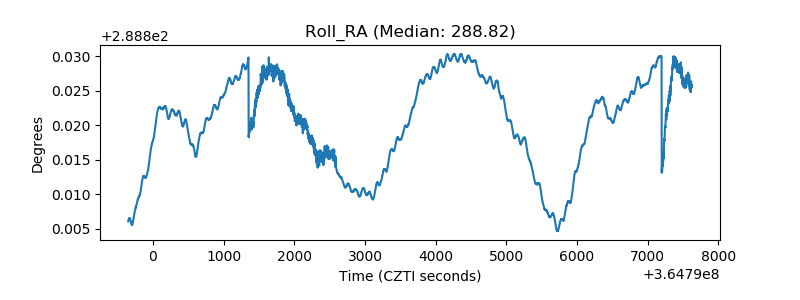 |
| Veto Counter | 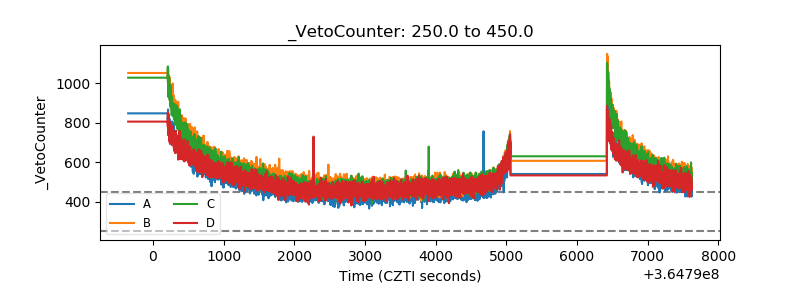 |