| Param | Original file | Final file |
|---|---|---|
| Filename | modeM0/AS1T04_029T01_9000004582_31470cztM0_level2.evt | modeM0/AS1T04_029T01_9000004582_31470cztM0_level2_quad_clean.evt |
| Size (bytes) | 543,075,840 | 77,198,400 |
| Size | 517.9 MB | 73.6 MB |
| Events in quadrant A | 3,285,017 | 494,014 |
| Events in quadrant B | 5,171,507 | 501,213 |
| Events in quadrant C | 4,012,765 | 448,003 |
| Events in quadrant D | 3,552,582 | 455,851 |
| Mode SS | |||
|---|---|---|---|
| Quadrant | BADHDUFLAG | Total packets | Discarded packets |
| A | 0 | 126 | 0 |
| B | 0 | 126 | 0 |
| C | 0 | 126 | 0 |
| D | 0 | 126 | 0 |
| Mode M9 | |||
|---|---|---|---|
| Quadrant | BADHDUFLAG | Total packets | Discarded packets |
| A | 0 | 18 | 0 |
| B | 0 | 19 | 0 |
| C | 0 | 19 | 0 |
| D | 0 | 19 | 0 |
| Mode M0 | |||
|---|---|---|---|
| Quadrant | BADHDUFLAG | Total packets | Discarded packets |
| A | 0 | 13272 | 2 |
| B | 0 | 19293 | 2 |
| C | 0 | 15666 | 2 |
| D | 0 | 14475 | 2 |
| Quadrant | Total seconds | Saturated seconds | Saturation percentage |
|---|---|---|---|
| A | 6288 | 29 | 0.461196% |
| B | 6288 | 107 | 1.701654% |
| C | 6288 | 332 | 5.279898% |
| D | 6288 | 21 | 0.333969% |
Noise dominated data is calculated using 1-second bins in cleaned event files. If a bin has >2000 counts, and if more than 50% of those come from <1% of pixels, then it is considered to be noise-dominated and hence unusable.
| Quadrant | # 1 sec bins | Bins with >0 counts | Bins with >2000 counts | High rate bins dominated by noise | Noise dominated (total time) | Noise dominated (detector-on time) | Marked lightcurve |
|---|---|---|---|---|---|---|---|
| A | 7613 | 6289 | 0 | 0 | 0.00% | 0.00% | 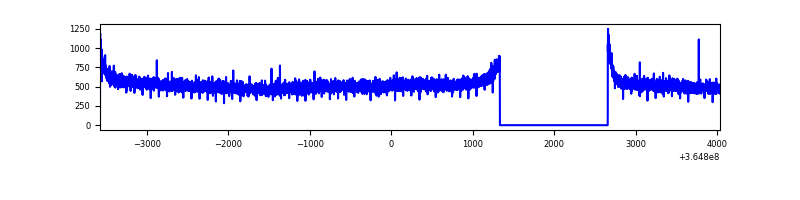 |
| B | 7613 | 6289 | 1 | 1 | 0.01% | 0.02% | 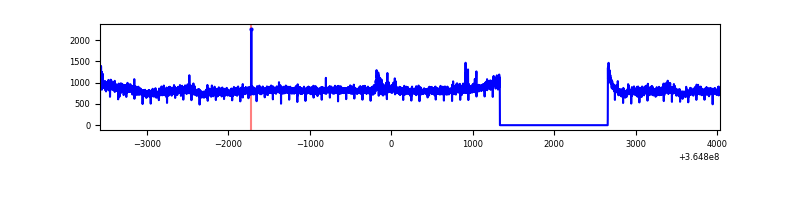 |
| C | 7613 | 6289 | 225 | 225 | 2.96% | 3.58% | 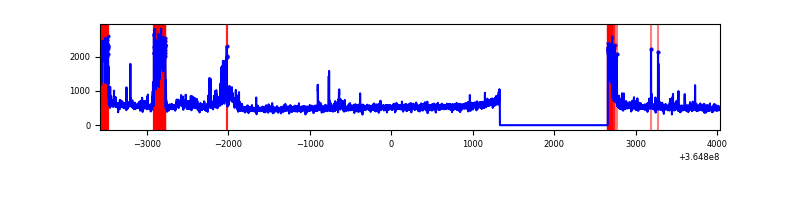 |
| D | 7613 | 6289 | 6 | 6 | 0.08% | 0.10% | 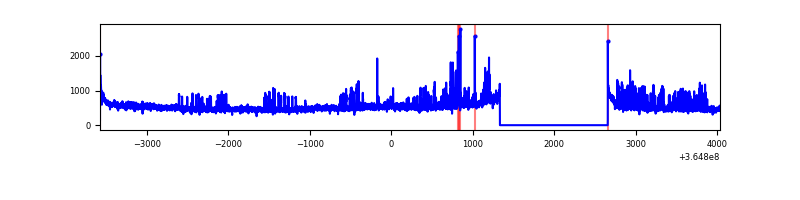 |
Top three noisy pixels from each quadrant. If the there are fewer than three noisy pixels in the level2.evt file, extra rows are filled as -1
| Pixel properties | Quadrant properties | ||||||
|---|---|---|---|---|---|---|---|
| Quadrant | DetID | PixID | Counts | Sigma | Mean | Median | Sigma |
| A | 13 | 254 | 9868 | 53.14 | 852 | 838 | 169.9 |
| A | 3 | 137 | 8283 | 43.81 | 852 | 838 | 169.9 |
| A | 0 | 226 | 7065 | 36.64 | 852 | 838 | 169.9 |
| B | 6 | 159 | 1809427 | 11297.91 | 841 | 822 | 160.1 |
| B | 0 | 190 | 36904 | 225.4 | 841 | 822 | 160.1 |
| B | 12 | 111 | 19673 | 117.76 | 841 | 822 | 160.1 |
| C | 10 | 22 | 438160 | 2402.3 | 783 | 791 | 182.1 |
| C | 0 | 10 | 362819 | 1988.48 | 783 | 791 | 182.1 |
| C | 14 | 238 | 128467 | 701.27 | 783 | 791 | 182.1 |
| D | 8 | 195 | 405390 | 2141.28 | 804 | 787 | 189.0 |
| D | 2 | 250 | 77055 | 403.63 | 804 | 787 | 189.0 |
| D | 2 | 234 | 21422 | 109.21 | 804 | 787 | 189.0 |
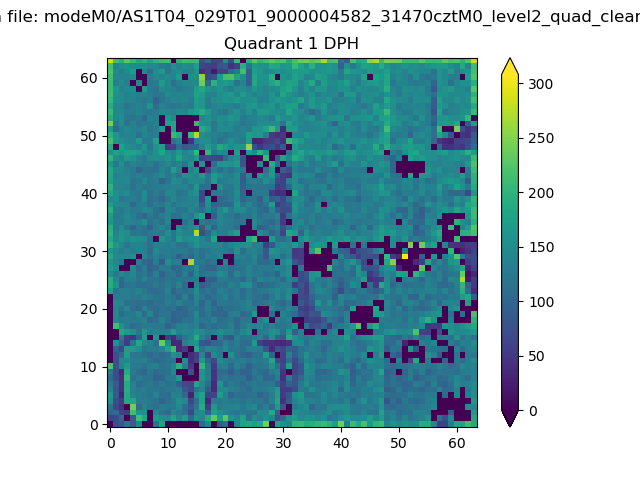
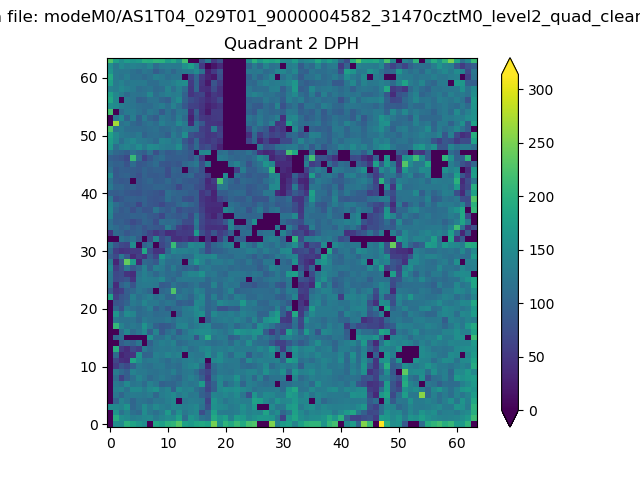
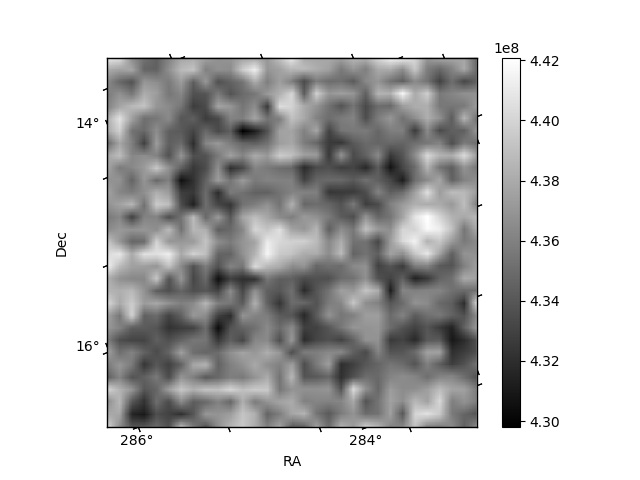
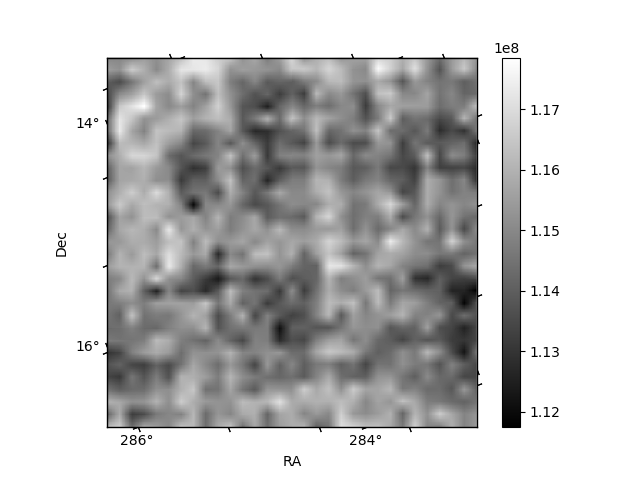
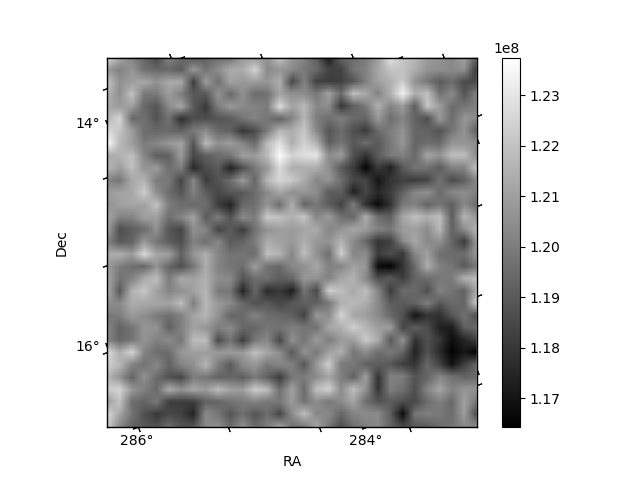
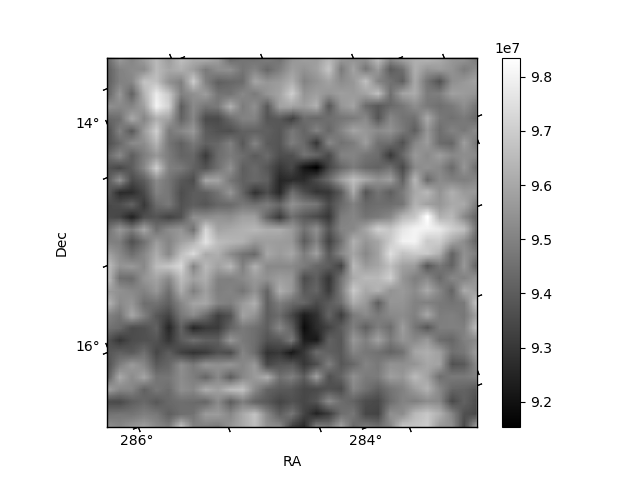
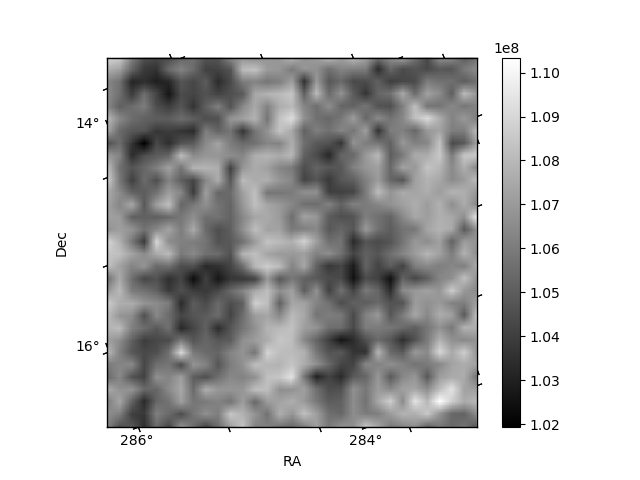
Histogram calculated using DETX and DETY for each event in the final _common_clean file
| Quadrant A |  |
 |
Quadrant B |
|---|---|---|---|
| Quadrant D | 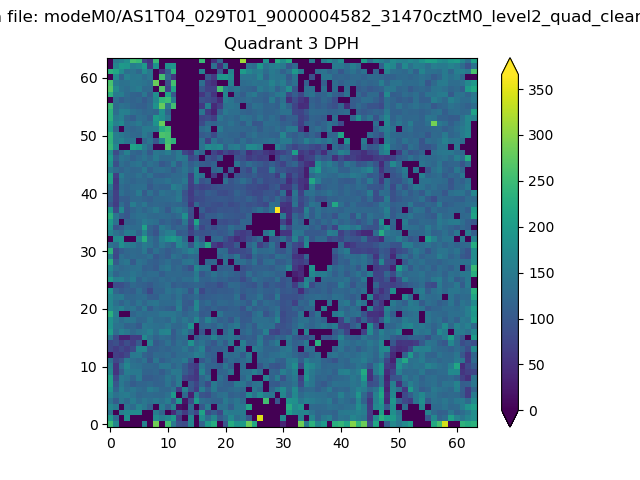 |
 |
Quadrant C |
| Plot type | Count rate plots | Images |
|---|---|---|
| Comparison with Poisson distribution Blue bars denote a histogram of data divided into 1 sec bins. Red curve is a Poisson curve with rate = median count rate of data. |
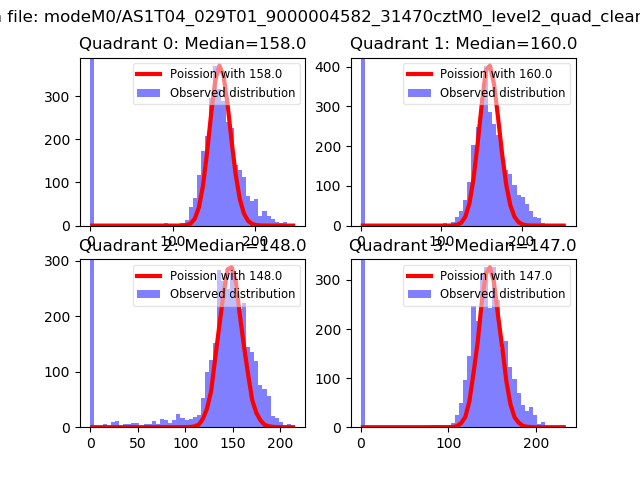 |
 |
| Quadrant-wise count rates Data is divided into 100 sec bins |
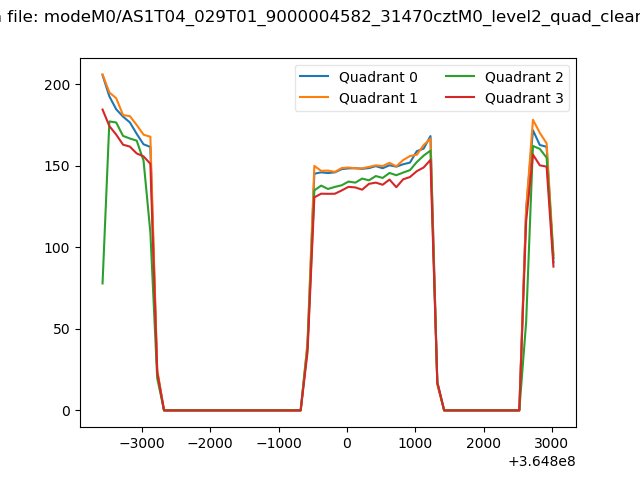 |
|
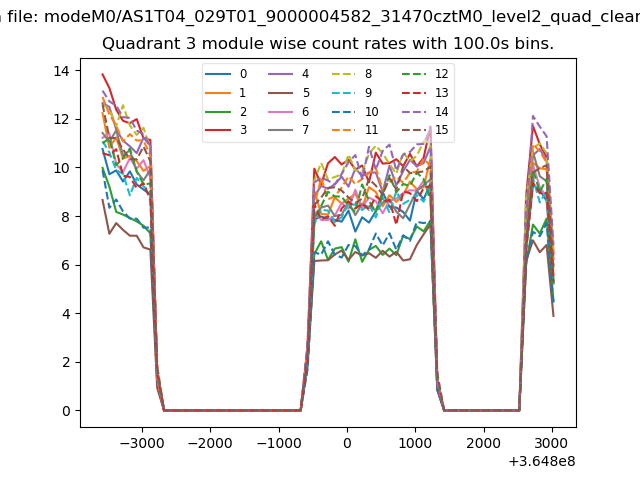
| Module-wise count rates for Quadrant A Data is divided into 100 sec bins |
 |
 |
| Module-wise count rates for Quadrant B Data is divided into 100 sec bins |
 |
 |
| Module-wise count rates for Quadrant C Data is divided into 100 sec bins |
 |
 |
| Module-wise count rates for Quadrant D Data is divided into 100 sec bins |
 |
 |
| Parameter | Plot |
|---|---|
| CZT HV Monitor | 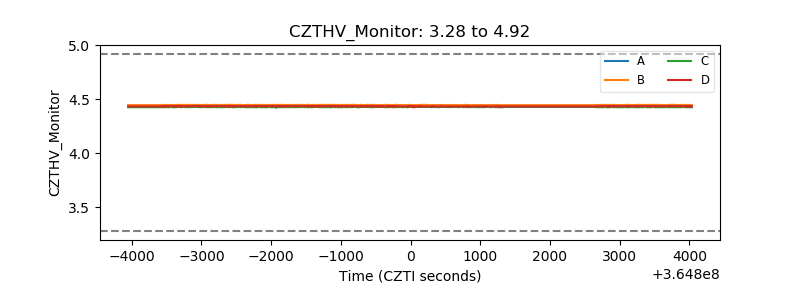 |
| D_VDD | 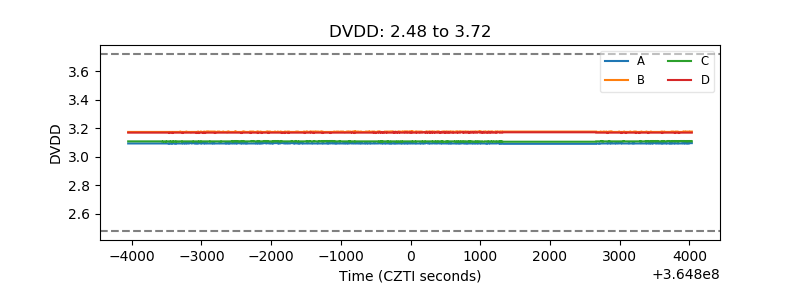 |
| Temperature 1 | 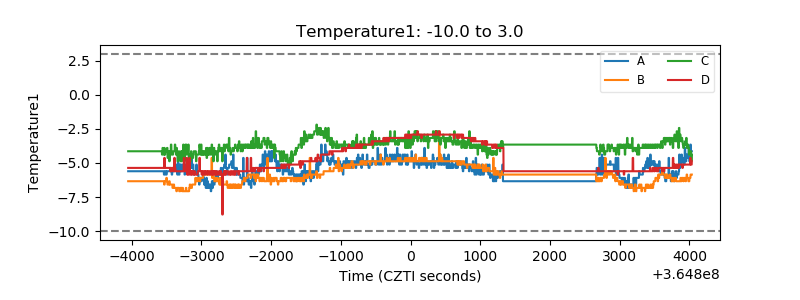 |
| Veto HV Monitor | 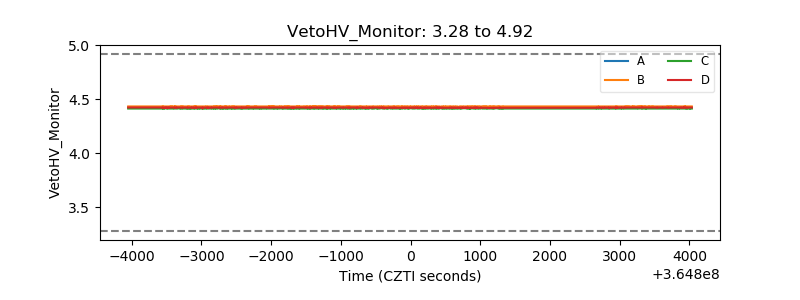 |
| Veto LLD | 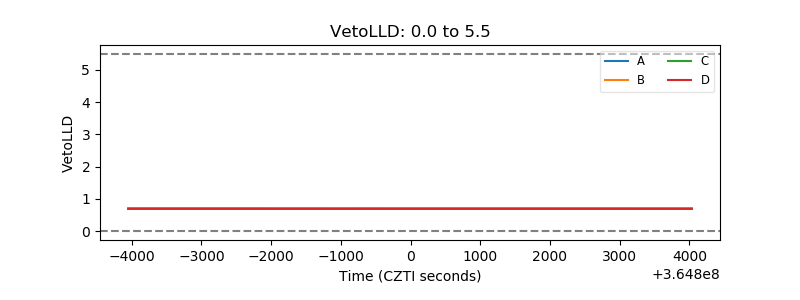 |
| Alpha Counter | 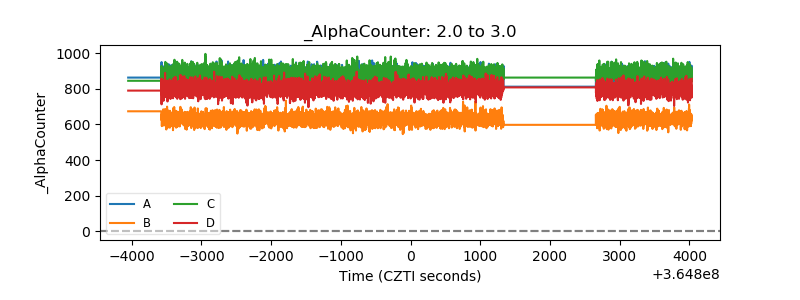 |
| _CPM_Rate | 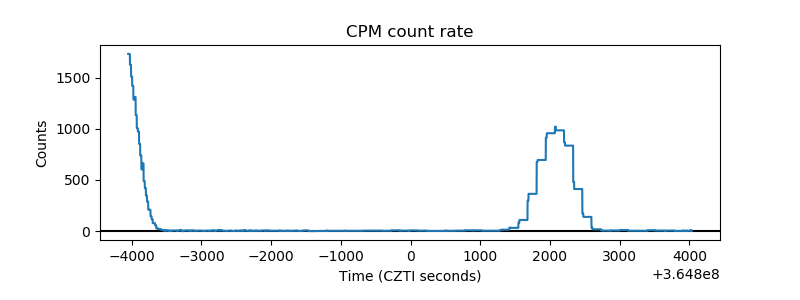 |
| CZT Counter | 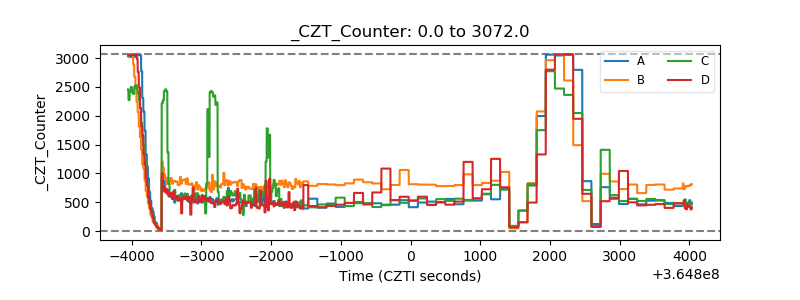 |
| +2.5 Volts monitor |  |
| +5 Volts monitor | 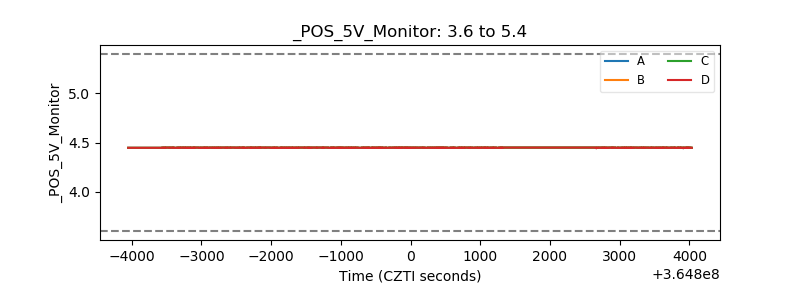 |
| _ROLL_ROT | 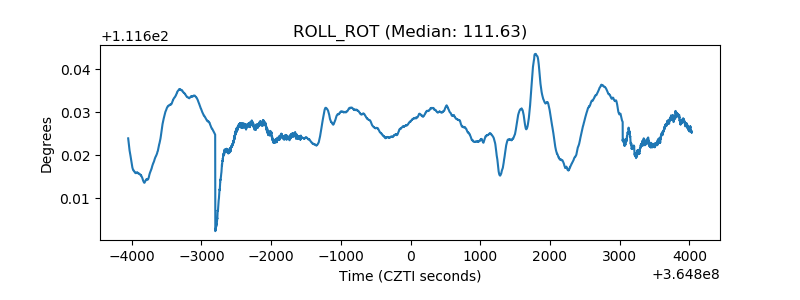 |
| _Roll_DEC | 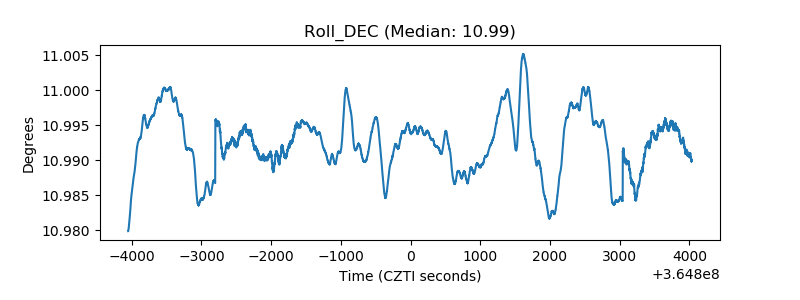 |
| _Roll_RA | 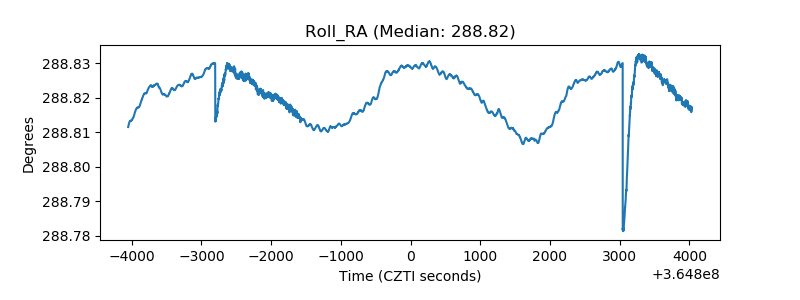 |
| Veto Counter | 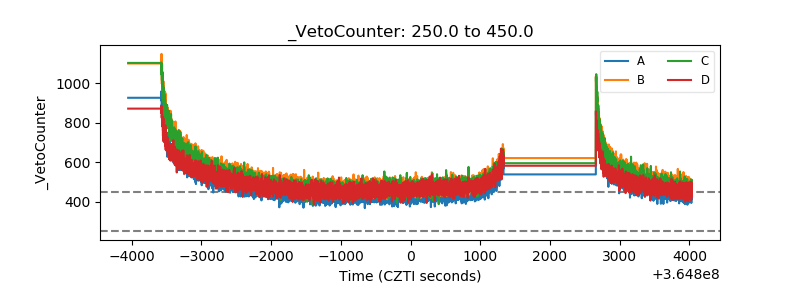 |