| Param | Original file | Final file |
|---|---|---|
| Filename | modeM0/AS1T04_029T01_9000004582_31472cztM0_level2.evt | modeM0/AS1T04_029T01_9000004582_31472cztM0_level2_quad_clean.evt |
| Size (bytes) | 609,425,280 | 74,931,840 |
| Size | 581.2 MB | 71.5 MB |
| Events in quadrant A | 3,549,262 | 463,409 |
| Events in quadrant B | 5,619,558 | 463,545 |
| Events in quadrant C | 3,975,966 | 444,694 |
| Events in quadrant D | 4,830,704 | 402,380 |
| Mode SS | |||
|---|---|---|---|
| Quadrant | BADHDUFLAG | Total packets | Discarded packets |
| A | 0 | 144 | 0 |
| B | 0 | 144 | 0 |
| C | 0 | 144 | 0 |
| D | 0 | 144 | 0 |
| Mode M9 | |||
|---|---|---|---|
| Quadrant | BADHDUFLAG | Total packets | Discarded packets |
| A | 0 | 17 | 0 |
| B | 0 | 17 | 0 |
| C | 0 | 17 | 0 |
| D | 0 | 17 | 0 |
| Mode M0 | |||
|---|---|---|---|
| Quadrant | BADHDUFLAG | Total packets | Discarded packets |
| A | 0 | 14874 | 2 |
| B | 0 | 21661 | 2 |
| C | 0 | 16061 | 2 |
| D | 0 | 19040 | 2 |
| Quadrant | Total seconds | Saturated seconds | Saturation percentage |
|---|---|---|---|
| A | 7107 | 189 | 2.659350% |
| B | 7108 | 314 | 4.417558% |
| C | 7108 | 368 | 5.177265% |
| D | 7108 | 551 | 7.751829% |
Noise dominated data is calculated using 1-second bins in cleaned event files. If a bin has >2000 counts, and if more than 50% of those come from <1% of pixels, then it is considered to be noise-dominated and hence unusable.
| Quadrant | # 1 sec bins | Bins with >0 counts | Bins with >2000 counts | High rate bins dominated by noise | Noise dominated (total time) | Noise dominated (detector-on time) | Marked lightcurve |
|---|---|---|---|---|---|---|---|
| A | 8767 | 7108 | 0 | 0 | 0.00% | 0.00% | 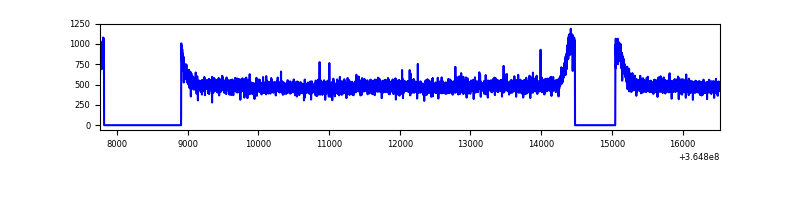 |
| B | 8768 | 7108 | 2 | 2 | 0.02% | 0.03% | 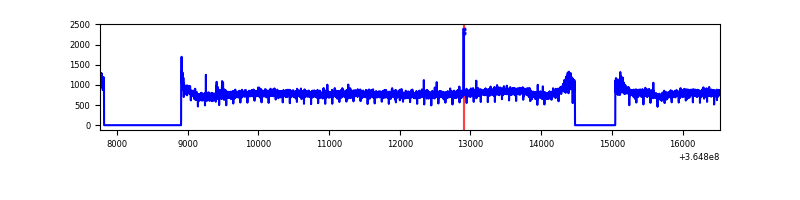 |
| C | 8768 | 7108 | 90 | 90 | 1.03% | 1.27% | 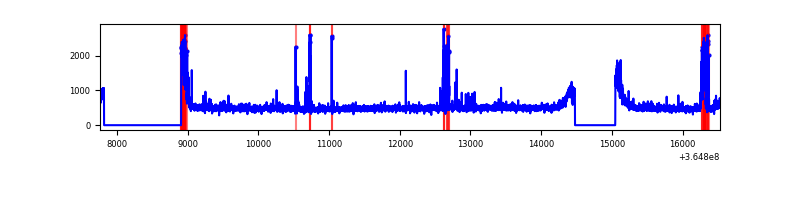 |
| D | 8768 | 7109 | 420 | 420 | 4.79% | 5.91% | 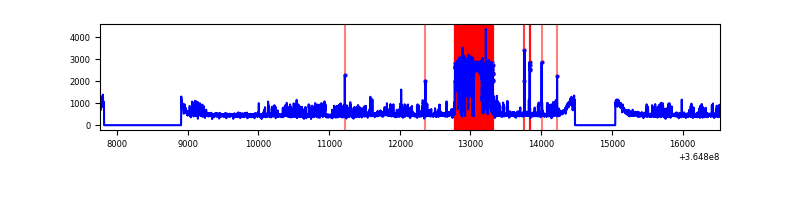 |
Top three noisy pixels from each quadrant. If the there are fewer than three noisy pixels in the level2.evt file, extra rows are filled as -1
| Pixel properties | Quadrant properties | ||||||
|---|---|---|---|---|---|---|---|
| Quadrant | DetID | PixID | Counts | Sigma | Mean | Median | Sigma |
| A | 13 | 254 | 12465 | 62.55 | 919 | 900 | 184.9 |
| A | 3 | 137 | 9953 | 48.96 | 919 | 900 | 184.9 |
| A | 0 | 226 | 7681 | 36.67 | 919 | 900 | 184.9 |
| B | 6 | 159 | 2044831 | 11661.75 | 899 | 877 | 175.3 |
| B | 12 | 111 | 22637 | 124.15 | 899 | 877 | 175.3 |
| B | 11 | 111 | 20895 | 114.21 | 899 | 877 | 175.3 |
| C | 0 | 10 | 290686 | 1407.7 | 862 | 867 | 205.9 |
| C | 10 | 22 | 148346 | 716.33 | 862 | 867 | 205.9 |
| C | 14 | 238 | 139741 | 674.53 | 862 | 867 | 205.9 |
| D | 12 | 218 | 1129896 | 5523.7 | 854 | 833 | 204.4 |
| D | 8 | 195 | 438052 | 2139.0 | 854 | 833 | 204.4 |
| D | 2 | 234 | 24760 | 117.06 | 854 | 833 | 204.4 |
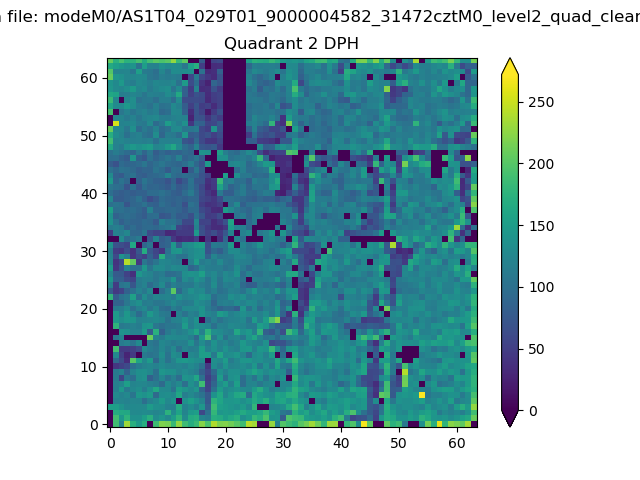
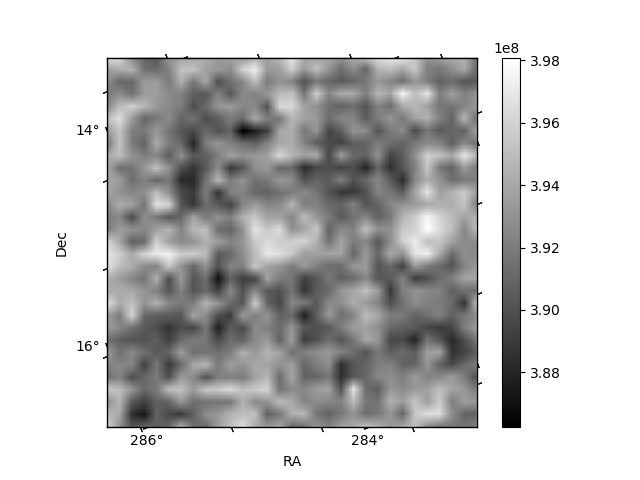
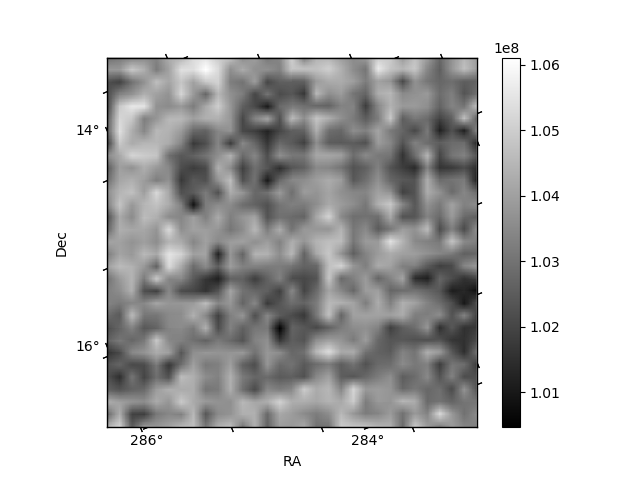
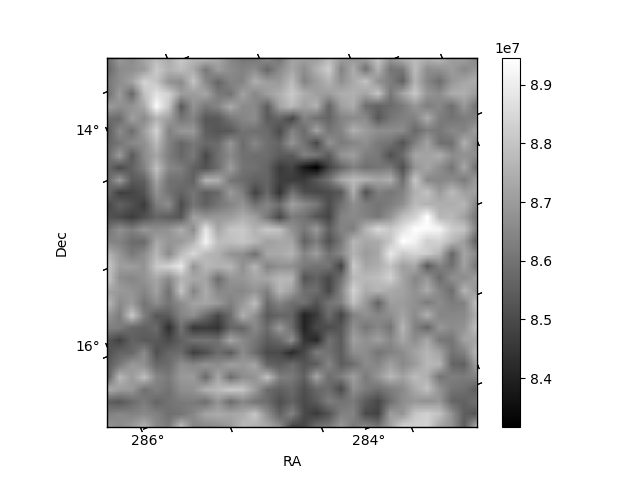
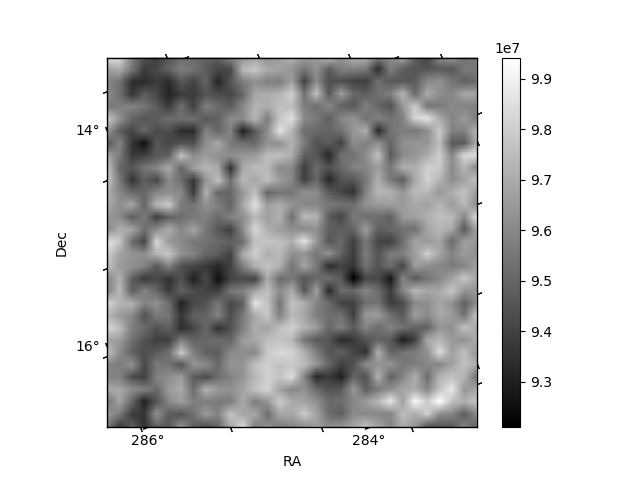
Histogram calculated using DETX and DETY for each event in the final _common_clean file
| Quadrant A | 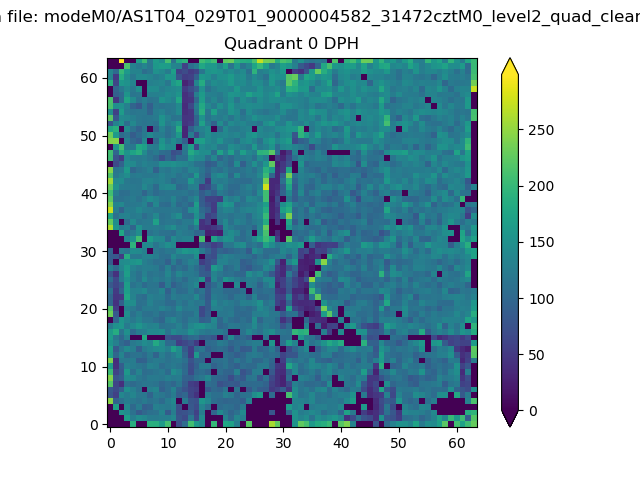 |
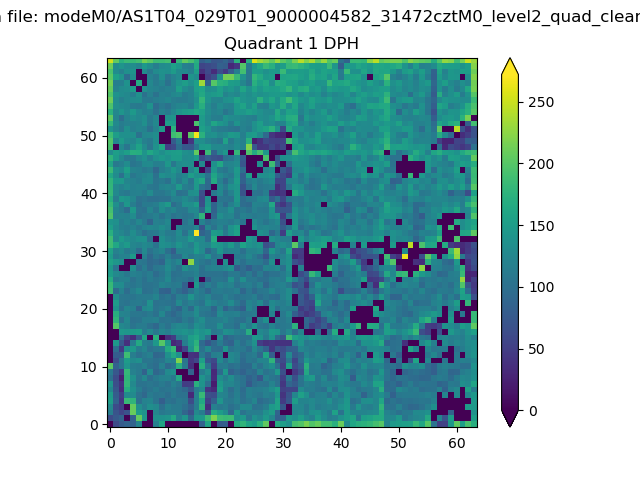 |
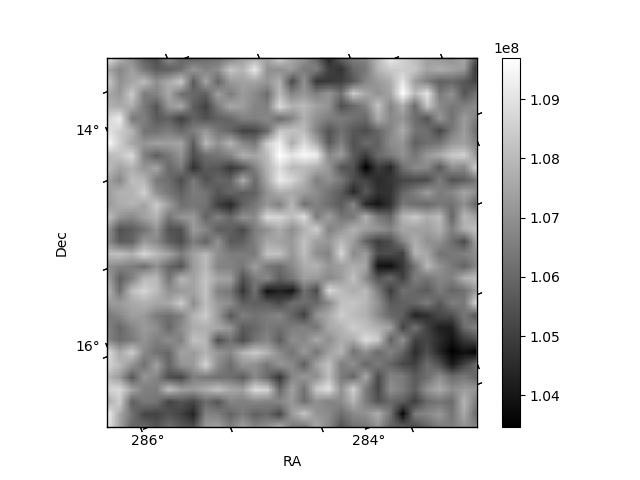
Quadrant B |
|---|---|---|---|
| Quadrant D | 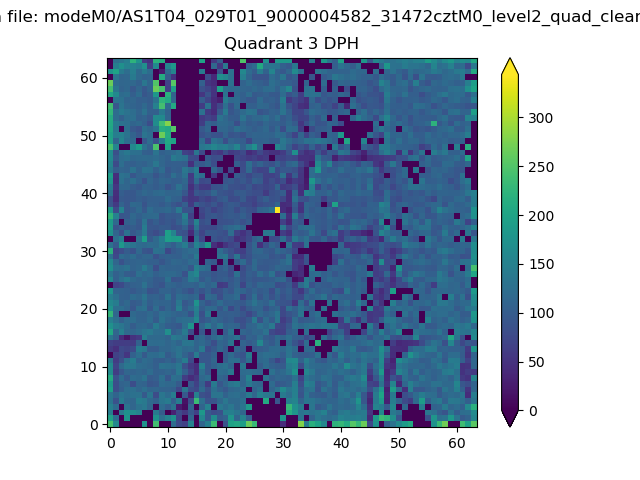 |
 |
Quadrant C |
| Plot type | Count rate plots | Images |
|---|---|---|
| Comparison with Poisson distribution Blue bars denote a histogram of data divided into 1 sec bins. Red curve is a Poisson curve with rate = median count rate of data. |
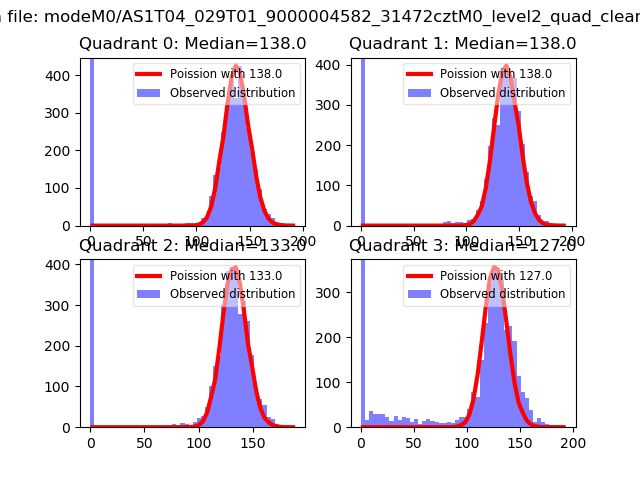 |
 |
| Quadrant-wise count rates Data is divided into 100 sec bins |
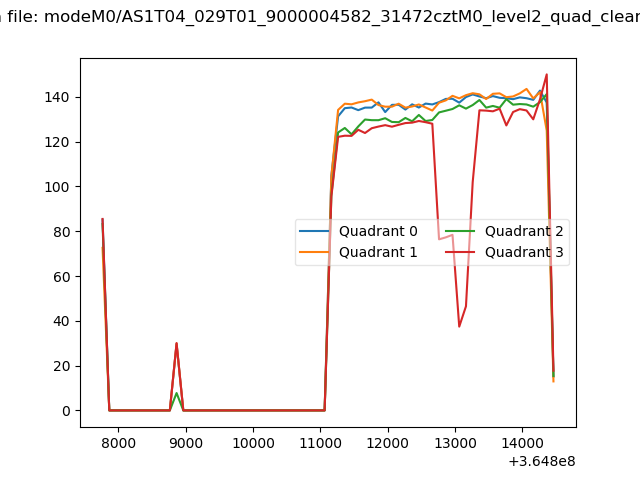 |
|
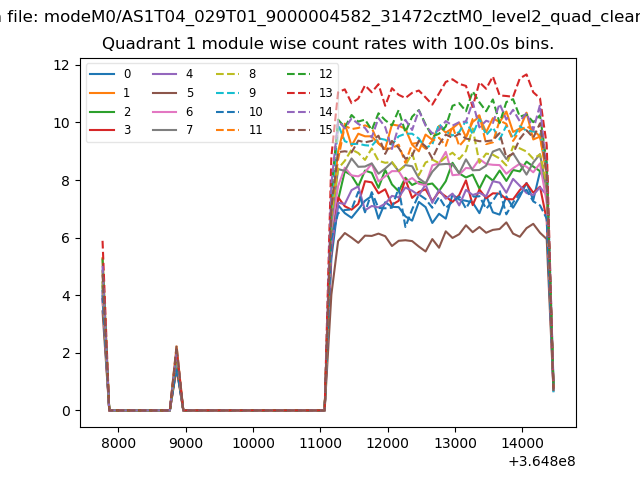
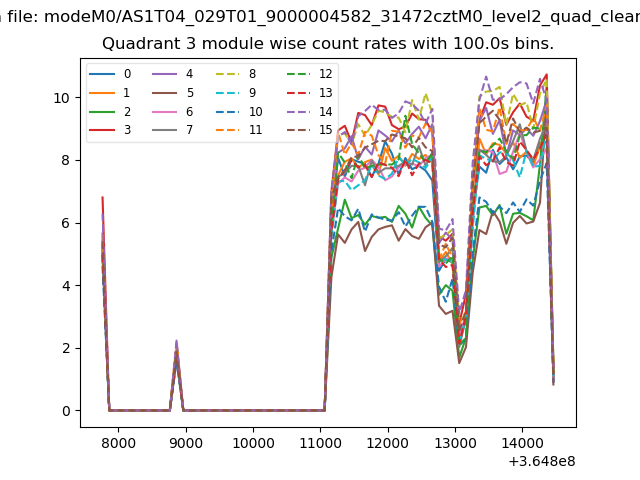
| Module-wise count rates for Quadrant A Data is divided into 100 sec bins |
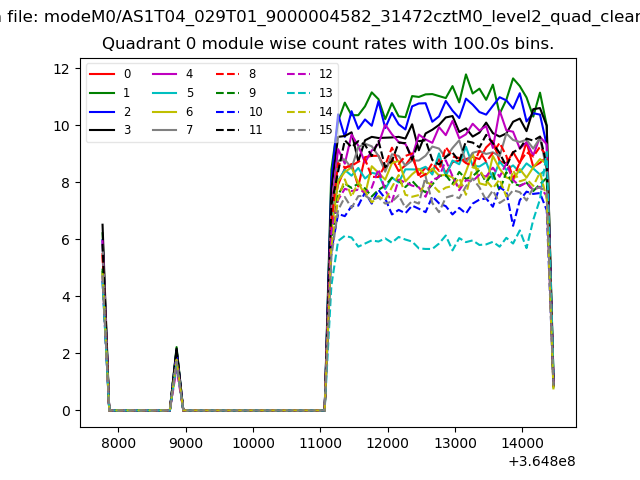 |
 |
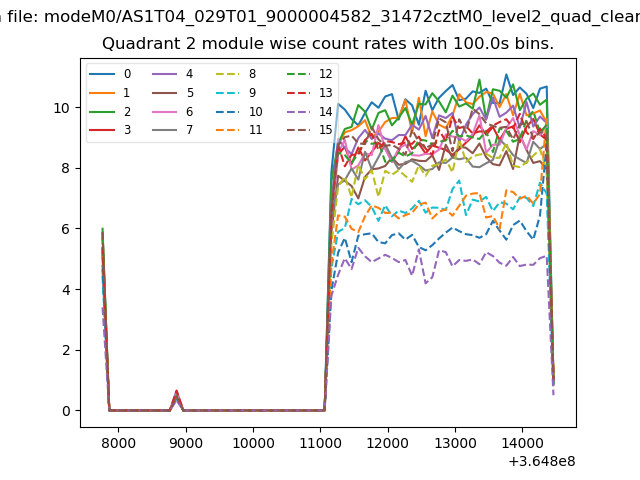
| Module-wise count rates for Quadrant B Data is divided into 100 sec bins |
 |
 |
| Module-wise count rates for Quadrant C Data is divided into 100 sec bins |
 |
 |
| Module-wise count rates for Quadrant D Data is divided into 100 sec bins |
 |
 |
| Parameter | Plot |
|---|---|
| CZT HV Monitor | 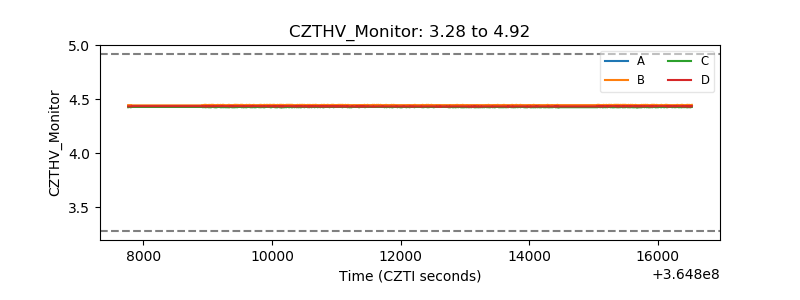 |
| D_VDD | 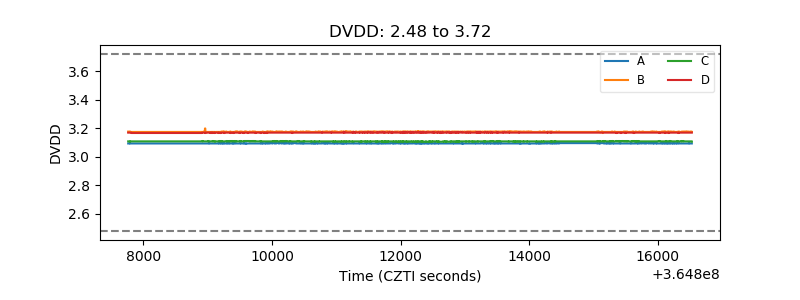 |
| Temperature 1 | 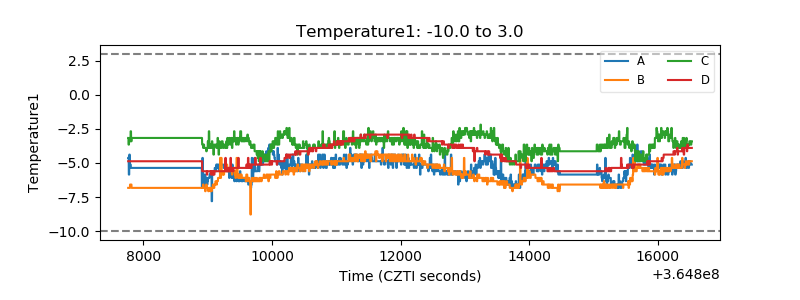 |
| Veto HV Monitor | 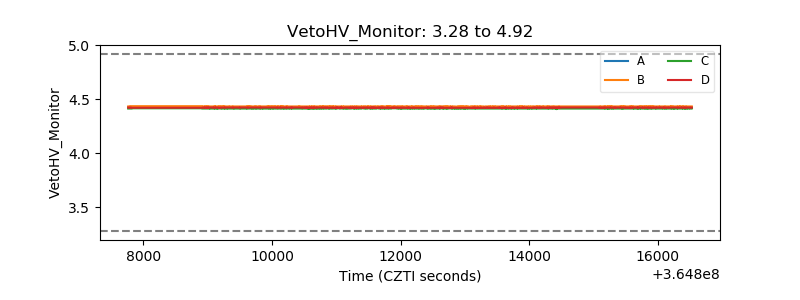 |
| Veto LLD | 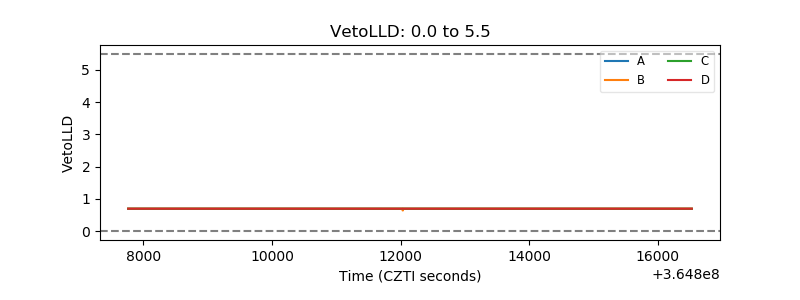 |
| Alpha Counter | 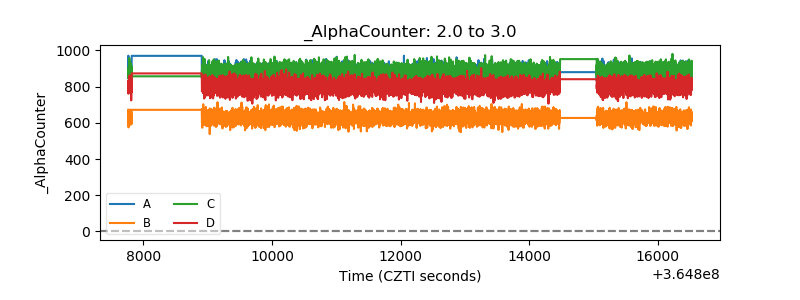 |
| _CPM_Rate | 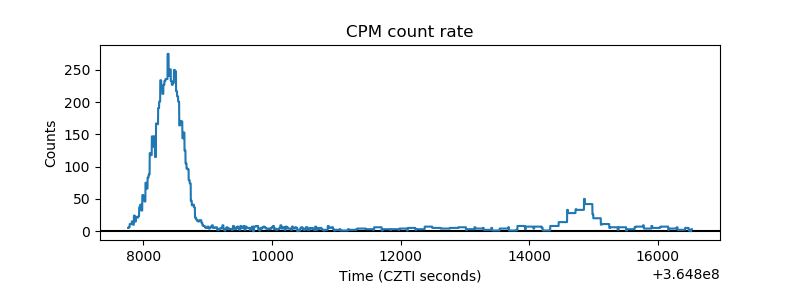 |
| CZT Counter | 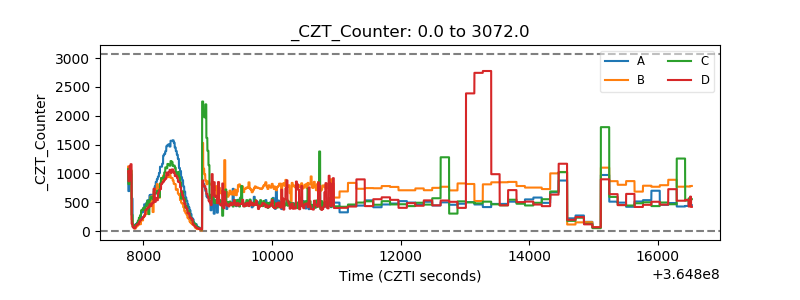 |
| +2.5 Volts monitor | 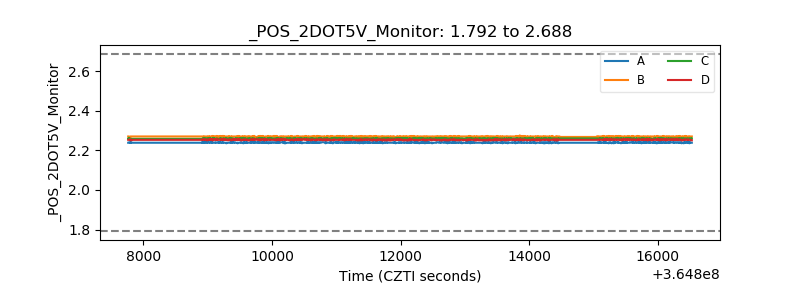 |
| +5 Volts monitor | 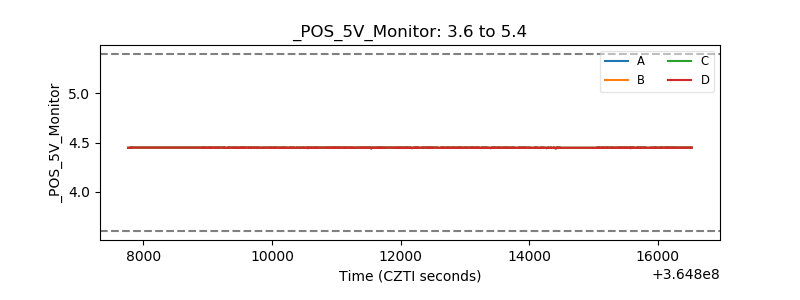 |
| _ROLL_ROT | 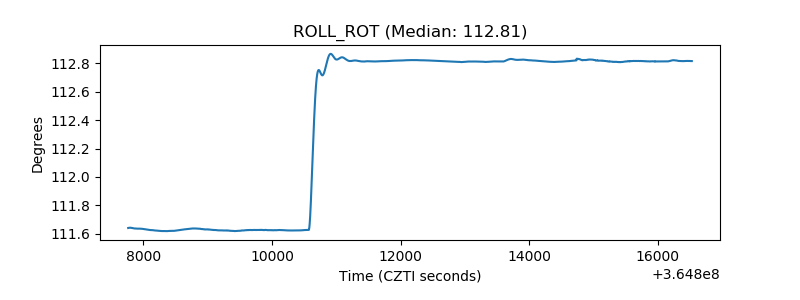 |
| _Roll_DEC | 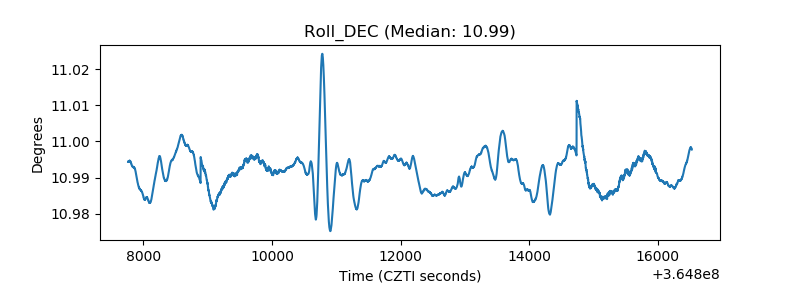 |
| _Roll_RA | 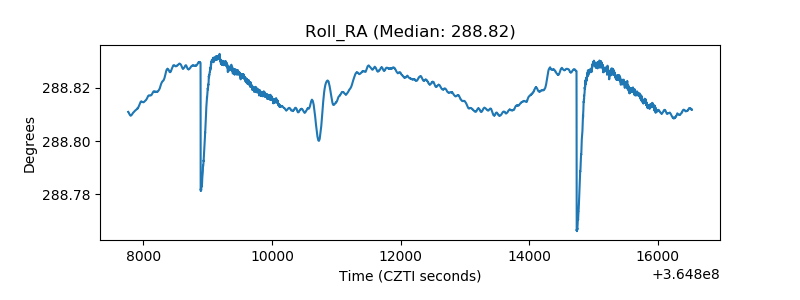 |
| Veto Counter | 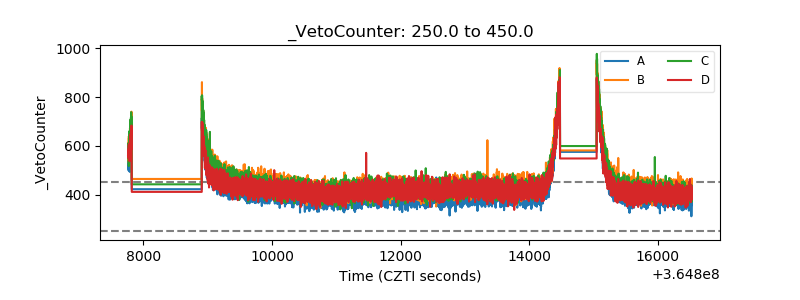 |