| Param | Original file | Final file |
|---|---|---|
| Filename | modeM0/AS1T04_029T01_9000004582_31473cztM0_level2.evt | modeM0/AS1T04_029T01_9000004582_31473cztM0_level2_quad_clean.evt |
| Size (bytes) | 612,619,200 | 79,182,720 |
| Size | 584.2 MB | 75.5 MB |
| Events in quadrant A | 3,748,968 | 477,985 |
| Events in quadrant B | 6,055,310 | 479,738 |
| Events in quadrant C | 4,033,559 | 459,812 |
| Events in quadrant D | 4,197,906 | 448,913 |
| Mode SS | |||
|---|---|---|---|
| Quadrant | BADHDUFLAG | Total packets | Discarded packets |
| A | 0 | 154 | 0 |
| B | 0 | 154 | 0 |
| C | 0 | 154 | 0 |
| D | 0 | 154 | 0 |
| Mode M9 | |||
|---|---|---|---|
| Quadrant | BADHDUFLAG | Total packets | Discarded packets |
| A | 0 | 5 | 0 |
| B | 0 | 6 | 0 |
| C | 0 | 6 | 0 |
| D | 0 | 6 | 0 |
| Mode M0 | |||
|---|---|---|---|
| Quadrant | BADHDUFLAG | Total packets | Discarded packets |
| A | 0 | 15926 | 3 |
| B | 0 | 23336 | 2 |
| C | 0 | 16693 | 2 |
| D | 0 | 17568 | 2 |
| Quadrant | Total seconds | Saturated seconds | Saturation percentage |
|---|---|---|---|
| A | 7640 | 238 | 3.115183% |
| B | 7640 | 389 | 5.091623% |
| C | 7640 | 348 | 4.554974% |
| D | 7640 | 199 | 2.604712% |
Noise dominated data is calculated using 1-second bins in cleaned event files. If a bin has >2000 counts, and if more than 50% of those come from <1% of pixels, then it is considered to be noise-dominated and hence unusable.
| Quadrant | # 1 sec bins | Bins with >0 counts | Bins with >2000 counts | High rate bins dominated by noise | Noise dominated (total time) | Noise dominated (detector-on time) | Marked lightcurve |
|---|---|---|---|---|---|---|---|
| A | 7845 | 7640 | 0 | 0 | 0.00% | 0.00% | 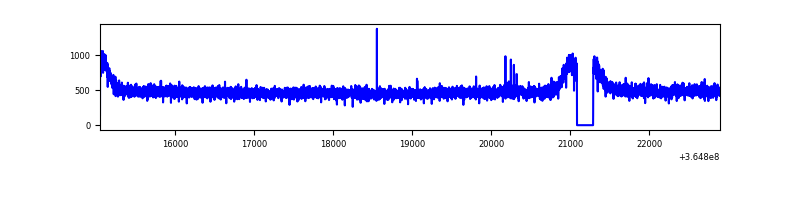 |
| B | 7845 | 7640 | 0 | 0 | 0.00% | 0.00% | 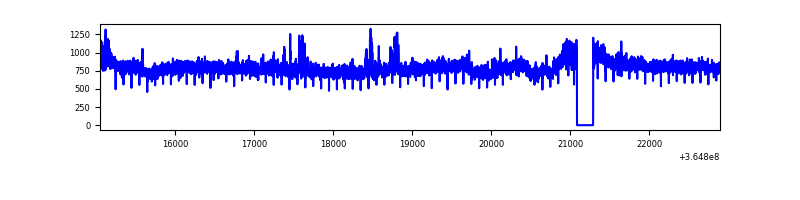 |
| C | 7845 | 7640 | 28 | 28 | 0.36% | 0.37% | 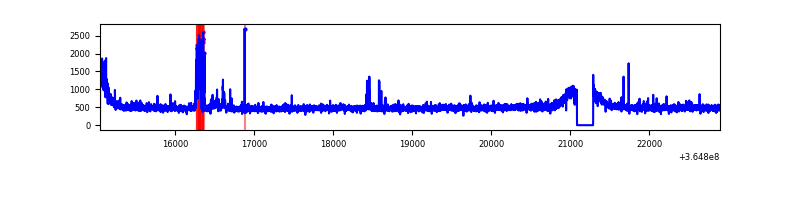 |
| D | 7845 | 7640 | 21 | 21 | 0.27% | 0.27% | 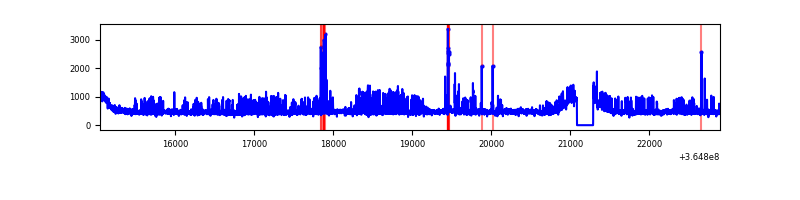 |
Top three noisy pixels from each quadrant. If the there are fewer than three noisy pixels in the level2.evt file, extra rows are filled as -1
| Pixel properties | Quadrant properties | ||||||
|---|---|---|---|---|---|---|---|
| Quadrant | DetID | PixID | Counts | Sigma | Mean | Median | Sigma |
| A | 13 | 254 | 12717 | 59.75 | 971 | 947 | 197.0 |
| A | 3 | 137 | 10528 | 48.64 | 971 | 947 | 197.0 |
| A | 0 | 226 | 8130 | 36.47 | 971 | 947 | 197.0 |
| B | 6 | 159 | 2226468 | 12081.19 | 947 | 922 | 184.2 |
| B | 0 | 190 | 80234 | 430.54 | 947 | 922 | 184.2 |
| B | 12 | 111 | 24249 | 126.63 | 947 | 922 | 184.2 |
| C | 10 | 22 | 192833 | 883.52 | 917 | 923 | 217.2 |
| C | 14 | 238 | 147099 | 672.97 | 917 | 923 | 217.2 |
| C | 0 | 10 | 73327 | 333.33 | 917 | 923 | 217.2 |
| D | 8 | 195 | 560622 | 2511.47 | 933 | 907 | 222.9 |
| D | 2 | 250 | 82680 | 366.92 | 933 | 907 | 222.9 |
| D | 2 | 234 | 28805 | 125.18 | 933 | 907 | 222.9 |
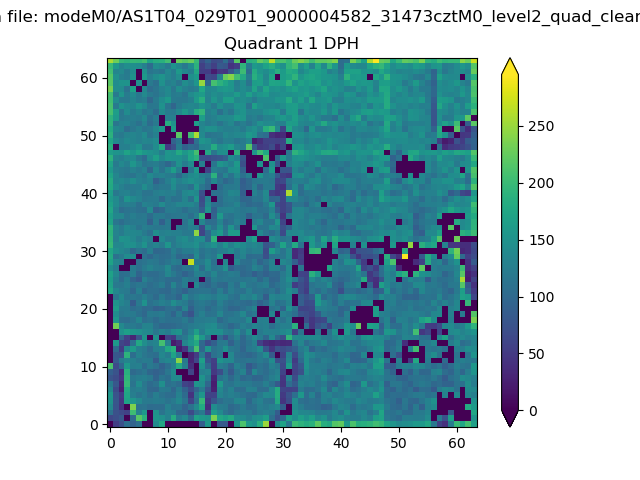
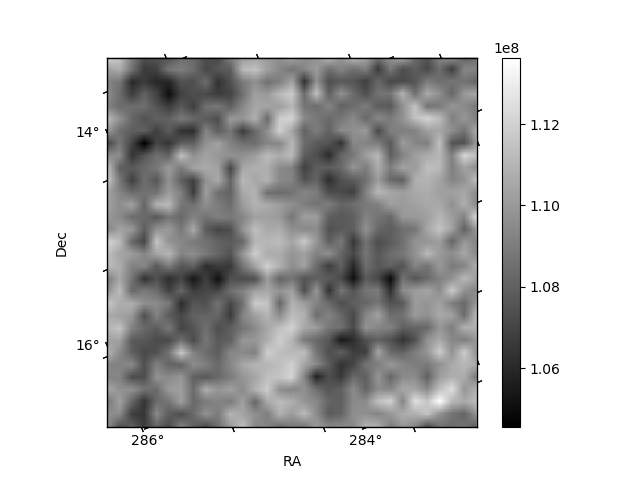
Histogram calculated using DETX and DETY for each event in the final _common_clean file
| Quadrant A |  |
 |
Quadrant B |
|---|---|---|---|
| Quadrant D |  |
 |
Quadrant C |
| Plot type | Count rate plots | Images |
|---|---|---|
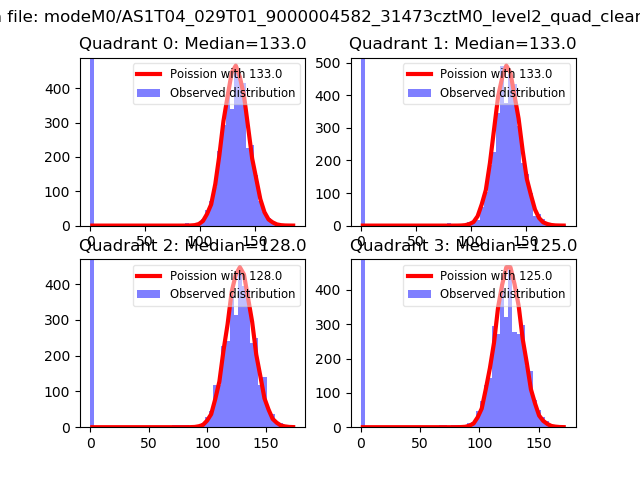
| Comparison with Poisson distribution Blue bars denote a histogram of data divided into 1 sec bins. Red curve is a Poisson curve with rate = median count rate of data. |
 |
 |
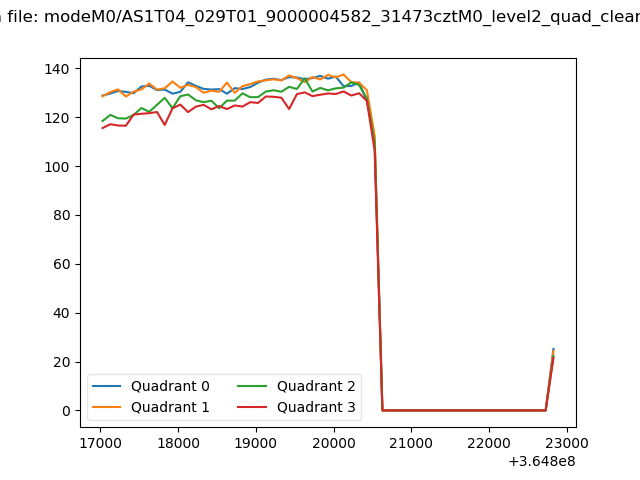
| Quadrant-wise count rates Data is divided into 100 sec bins |
 |
|
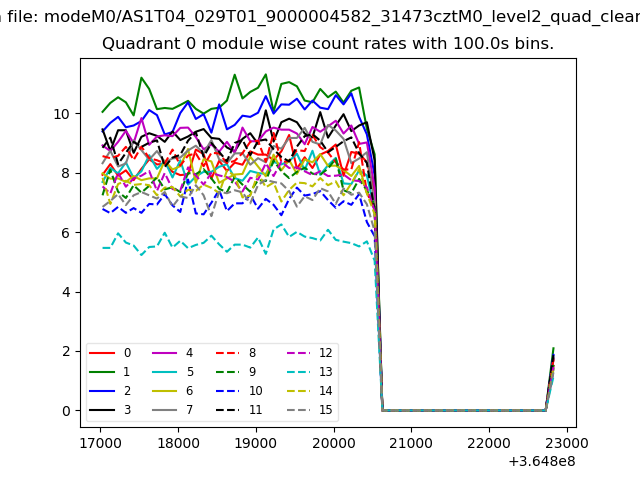
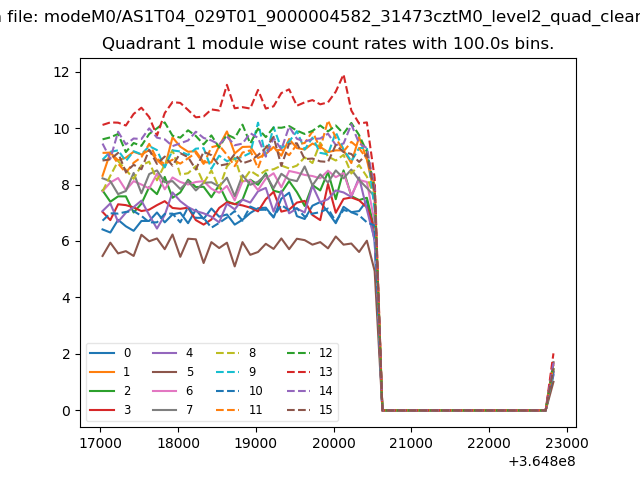
| Module-wise count rates for Quadrant A Data is divided into 100 sec bins |
 |
 |
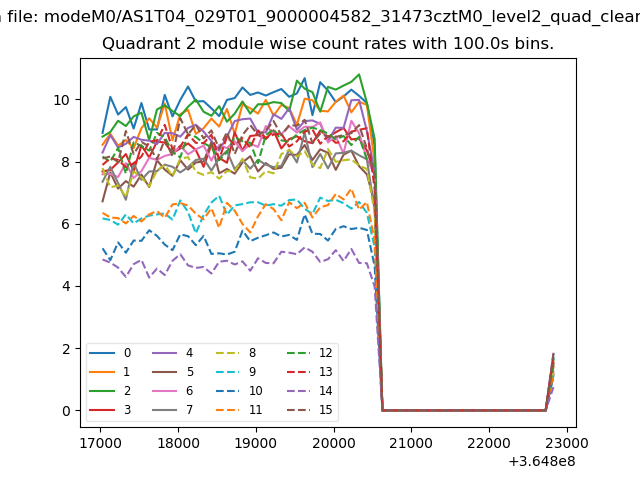
| Module-wise count rates for Quadrant B Data is divided into 100 sec bins |
 |
 |
| Module-wise count rates for Quadrant C Data is divided into 100 sec bins |
 |
 |
| Module-wise count rates for Quadrant D Data is divided into 100 sec bins |
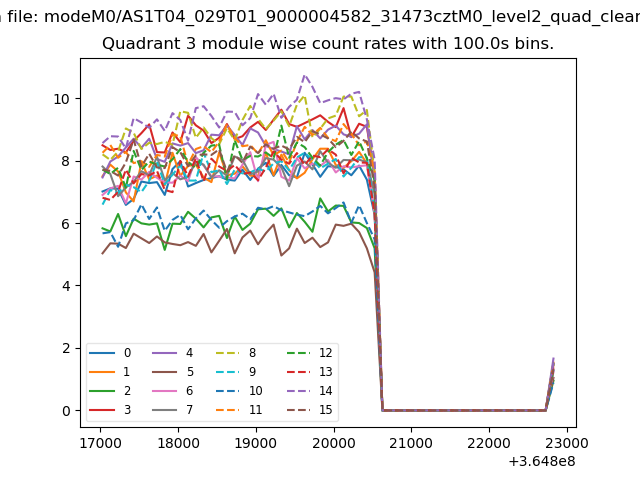 |
 |
| Parameter | Plot |
|---|---|
| CZT HV Monitor |  |
| D_VDD | 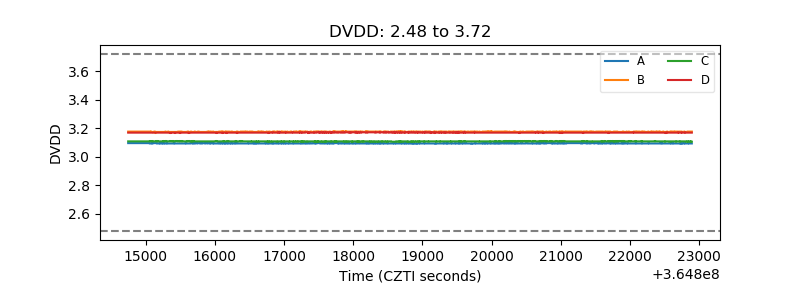 |
| Temperature 1 | 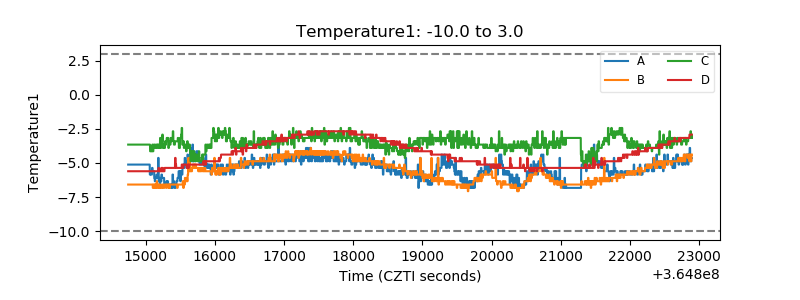 |
| Veto HV Monitor | 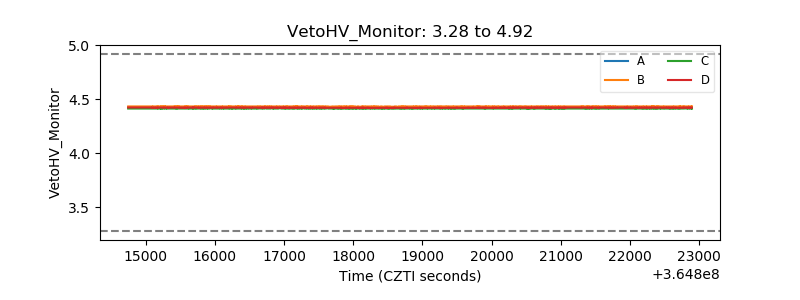 |
| Veto LLD | 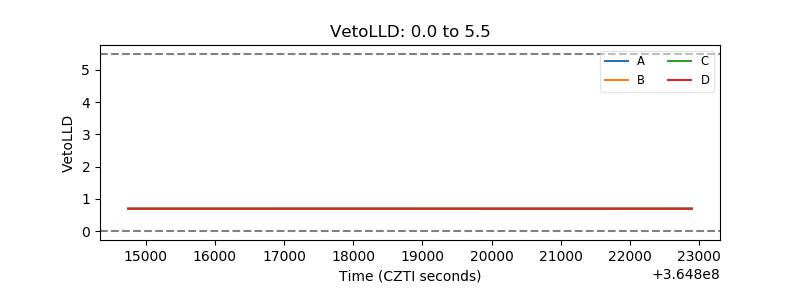 |
| Alpha Counter | 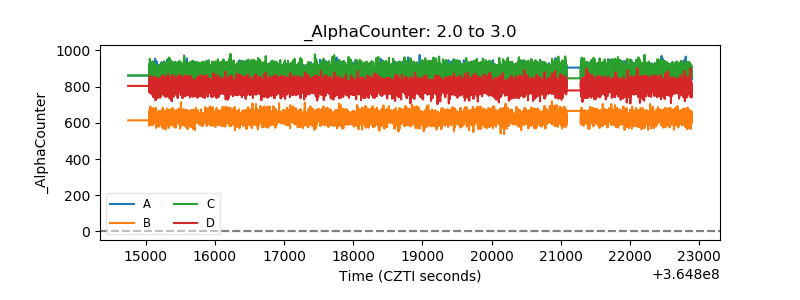 |
| _CPM_Rate | 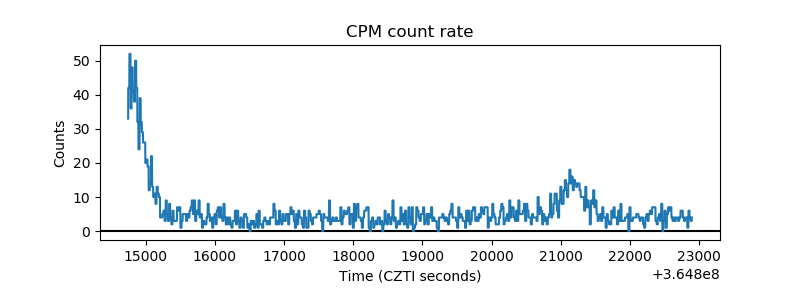 |
| CZT Counter |  |
| +2.5 Volts monitor |  |
| +5 Volts monitor | 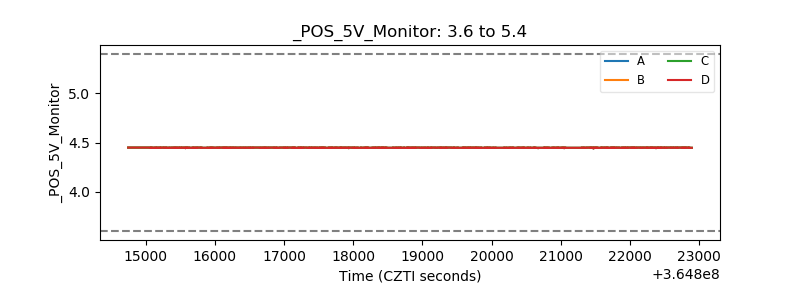 |
| _ROLL_ROT | 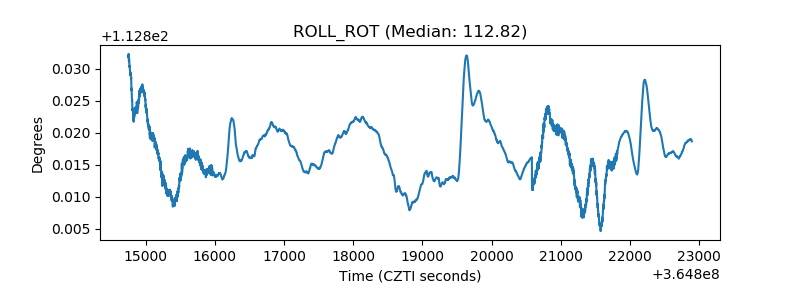 |
| _Roll_DEC | 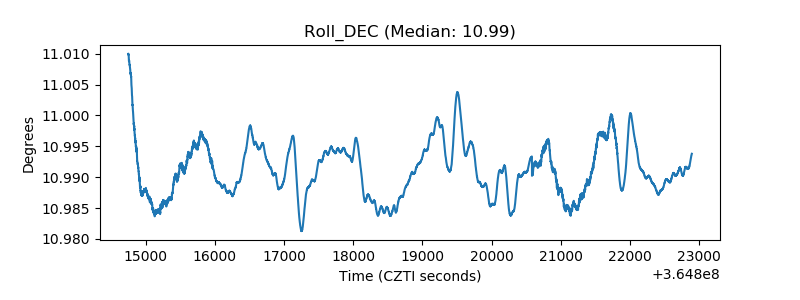 |
| _Roll_RA |  |
| Veto Counter | 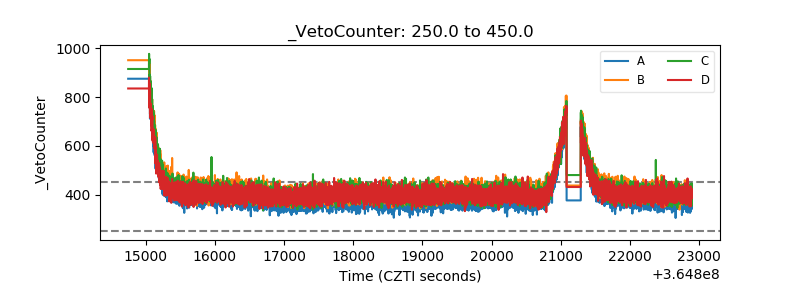 |