| Param | Original file | Final file |
|---|---|---|
| Filename | modeM0/AS1T04_029T01_9000004582_31474cztM0_level2.evt | modeM0/AS1T04_029T01_9000004582_31474cztM0_level2_quad_clean.evt |
| Size (bytes) | 257,333,760 | 33,491,520 |
| Size | 245.4 MB | 31.9 MB |
| Events in quadrant A | 1,717,920 | 208,257 |
| Events in quadrant B | 2,299,244 | 176,540 |
| Events in quadrant C | 1,751,317 | 202,668 |
| Events in quadrant D | 1,801,361 | 195,353 |
| Mode SS | |||
|---|---|---|---|
| Quadrant | BADHDUFLAG | Total packets | Discarded packets |
| A | 0 | 182 | 128 |
| B | 0 | 182 | 125 |
| C | 0 | 182 | 106 |
| D | 0 | 184 | 110 |
| Mode M9 | |||
|---|---|---|---|
| Quadrant | BADHDUFLAG | Total packets | Discarded packets |
| A | 0 | 4 | 2 |
| B | 0 | 4 | 2 |
| C | 0 | 3 | 1 |
| D | 0 | 4 | 2 |
| Mode M0 | |||
|---|---|---|---|
| Quadrant | BADHDUFLAG | Total packets | Discarded packets |
| A | 0 | 18488 | 11304 |
| B | 0 | 26876 | 18101 |
| C | 0 | 18712 | 11467 |
| D | 0 | 20229 | 12707 |
| Quadrant | Total seconds | Saturated seconds | Saturation percentage |
|---|---|---|---|
| A | 3419 | 134 | 3.919275% |
| B | 2860 | 201 | 7.027972% |
| C | 3400 | 170 | 5.000000% |
| D | 3303 | 113 | 3.421132% |
Noise dominated data is calculated using 1-second bins in cleaned event files. If a bin has >2000 counts, and if more than 50% of those come from <1% of pixels, then it is considered to be noise-dominated and hence unusable.
| Quadrant | # 1 sec bins | Bins with >0 counts | Bins with >2000 counts | High rate bins dominated by noise | Noise dominated (total time) | Noise dominated (detector-on time) | Marked lightcurve |
|---|---|---|---|---|---|---|---|
| A | 9184 | 4344 | 0 | 0 | 0.00% | 0.00% | 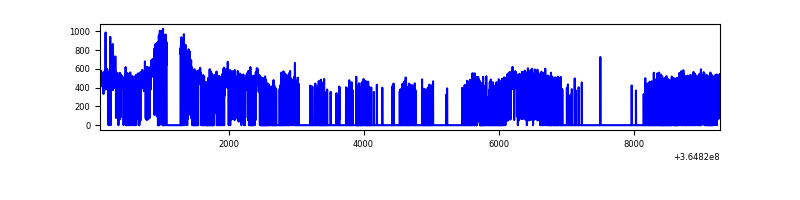 |
| B | 9184 | 3671 | 0 | 0 | 0.00% | 0.00% |  |
| C | 9185 | 4331 | 0 | 0 | 0.00% | 0.00% | 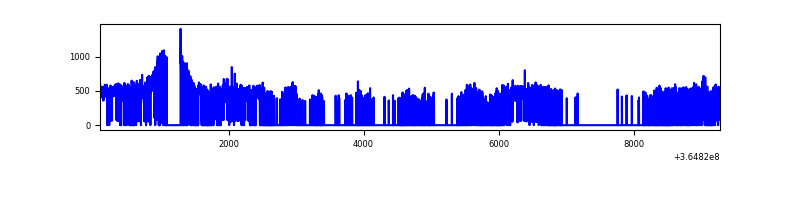 |
| D | 9185 | 4255 | 2 | 2 | 0.02% | 0.05% | 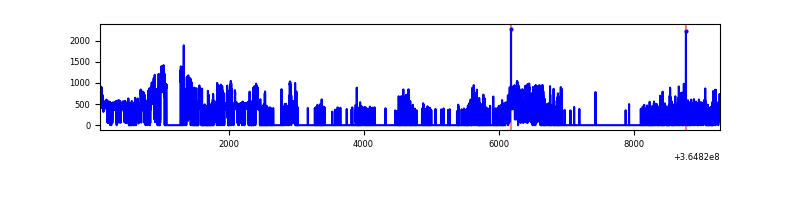 |
Top three noisy pixels from each quadrant. If the there are fewer than three noisy pixels in the level2.evt file, extra rows are filled as -1
| Pixel properties | Quadrant properties | ||||||
|---|---|---|---|---|---|---|---|
| Quadrant | DetID | PixID | Counts | Sigma | Mean | Median | Sigma |
| A | 13 | 254 | 5519 | 54.51 | 444 | 432 | 93.3 |
| A | 3 | 137 | 5028 | 49.25 | 444 | 432 | 93.3 |
| A | 0 | 226 | 3725 | 35.29 | 444 | 432 | 93.3 |
| B | 6 | 159 | 834471 | 11389.87 | 364 | 354 | 73.2 |
| B | 4 | 80 | 20555 | 275.84 | 364 | 354 | 73.2 |
| B | 12 | 111 | 9639 | 126.79 | 364 | 354 | 73.2 |
| C | 14 | 238 | 65533 | 651.93 | 418 | 420 | 99.9 |
| C | 10 | 22 | 21023 | 206.28 | 418 | 420 | 99.9 |
| C | 0 | 10 | 13238 | 128.34 | 418 | 420 | 99.9 |
| D | 8 | 195 | 235439 | 2352.08 | 411 | 400 | 99.9 |
| D | 2 | 234 | 13393 | 130.02 | 411 | 400 | 99.9 |
| D | 12 | 218 | 4340 | 39.43 | 411 | 400 | 99.9 |
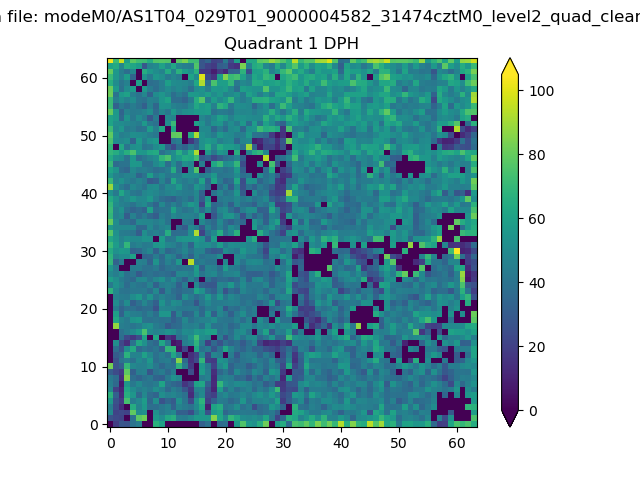
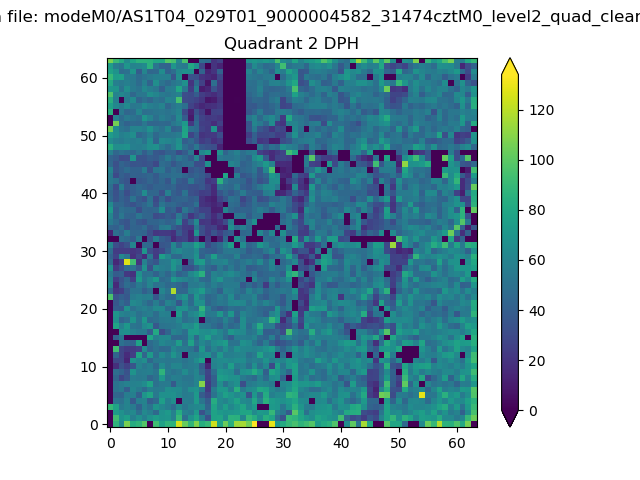
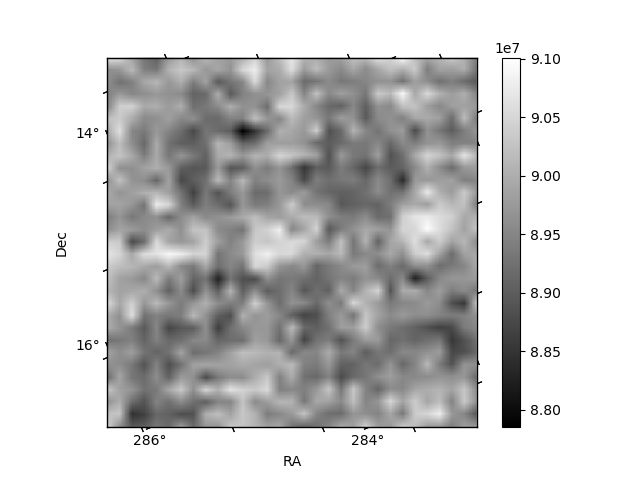
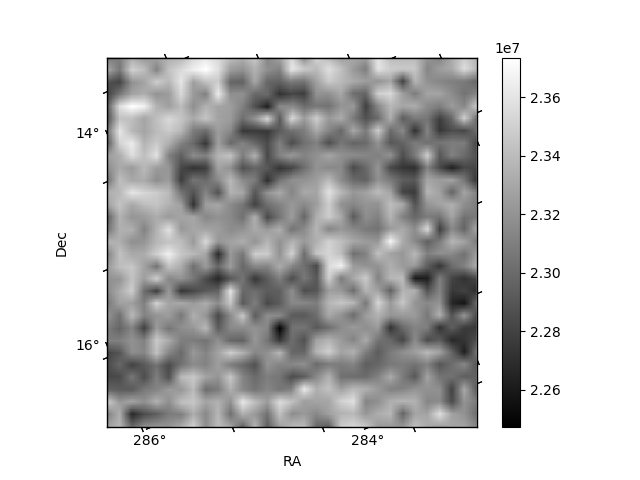
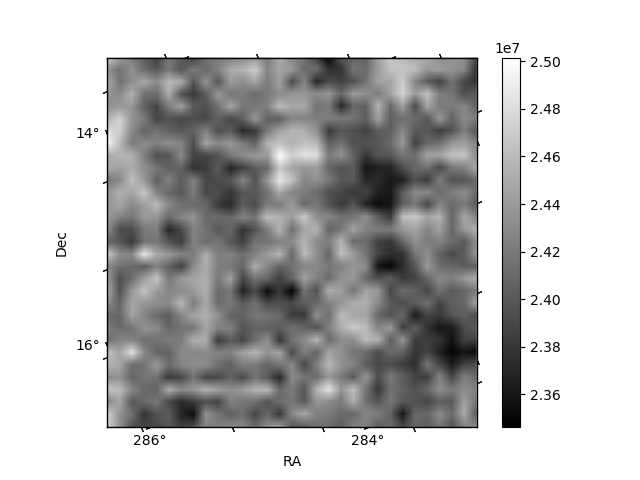
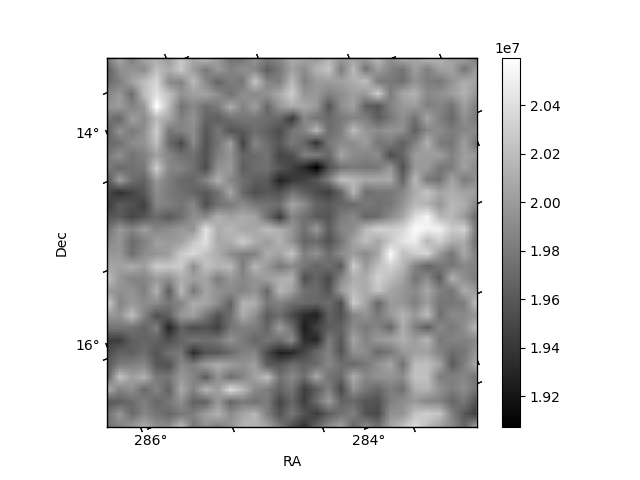
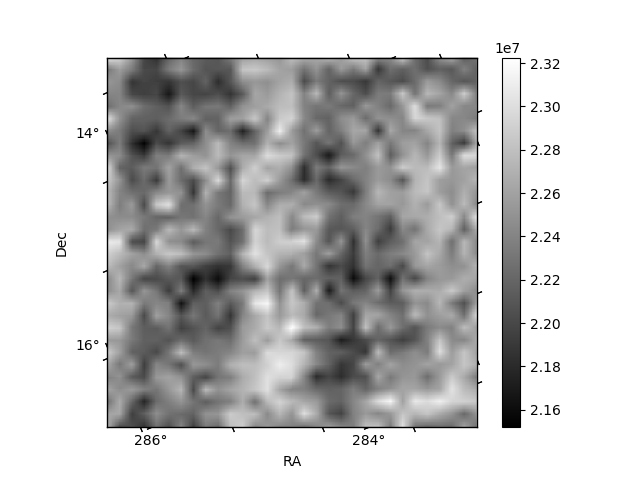
Histogram calculated using DETX and DETY for each event in the final _common_clean file
| Quadrant A | 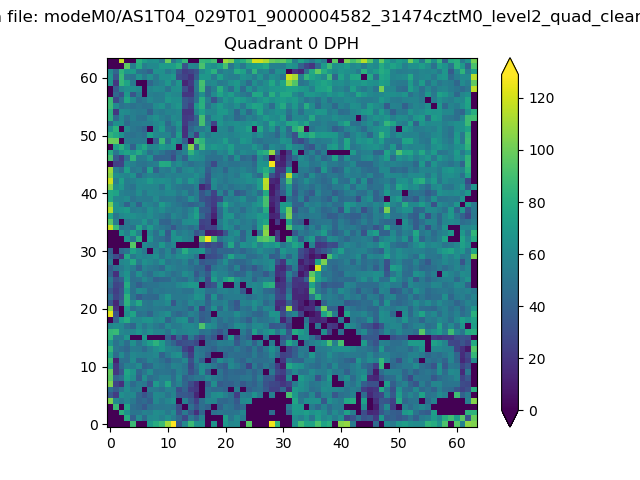 |
 |
Quadrant B |
|---|---|---|---|
| Quadrant D | 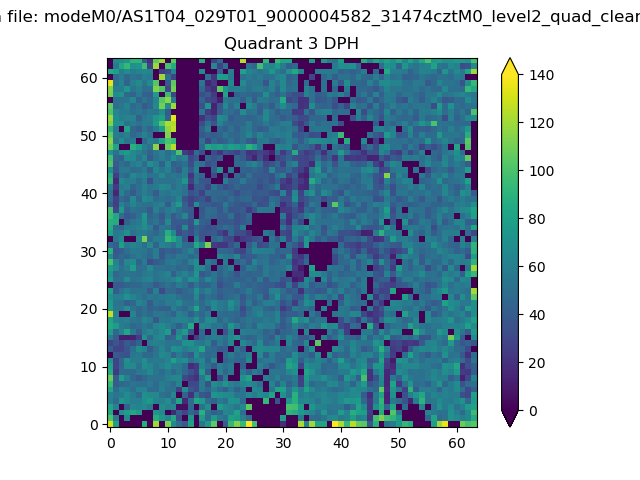 |
 |
Quadrant C |
| Plot type | Count rate plots | Images |
|---|---|---|
| Comparison with Poisson distribution Blue bars denote a histogram of data divided into 1 sec bins. Red curve is a Poisson curve with rate = median count rate of data. |
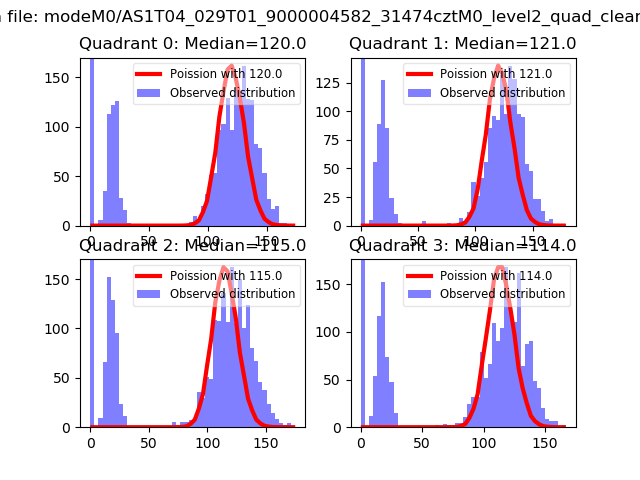 |
 |
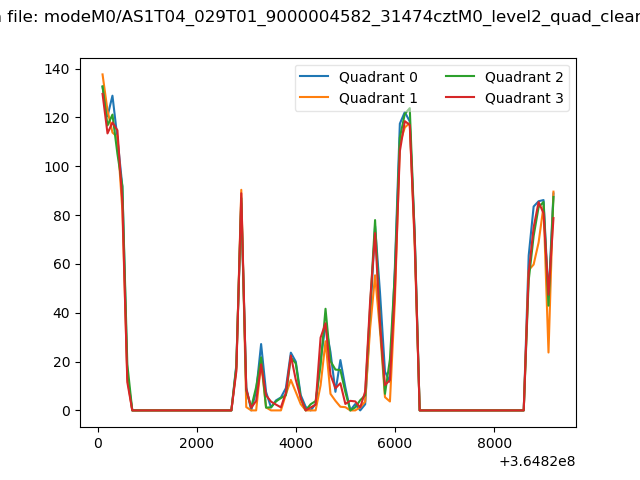
| Quadrant-wise count rates Data is divided into 100 sec bins |
 |
|
| Module-wise count rates for Quadrant A Data is divided into 100 sec bins |
 |
 |
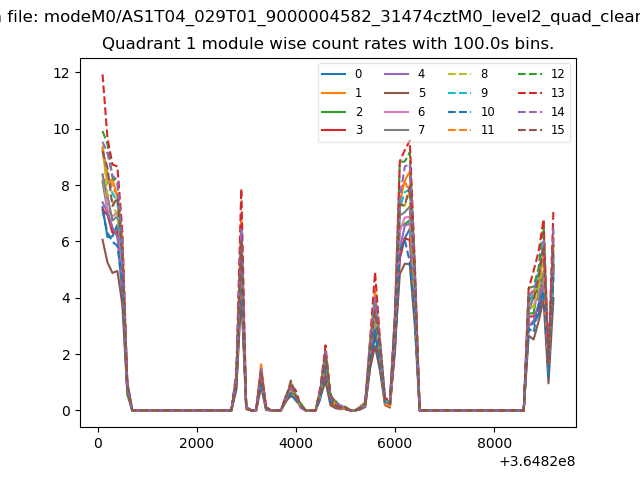
| Module-wise count rates for Quadrant B Data is divided into 100 sec bins |
 |
 |
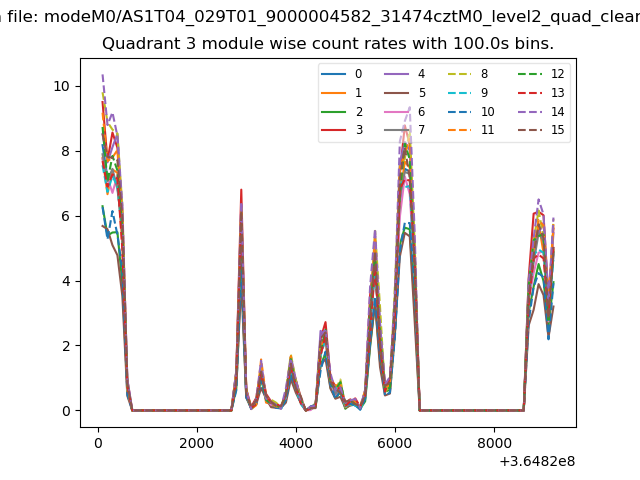
| Module-wise count rates for Quadrant C Data is divided into 100 sec bins |
 |
 |
| Module-wise count rates for Quadrant D Data is divided into 100 sec bins |
 |
 |
| Parameter | Plot |
|---|---|
| CZT HV Monitor | 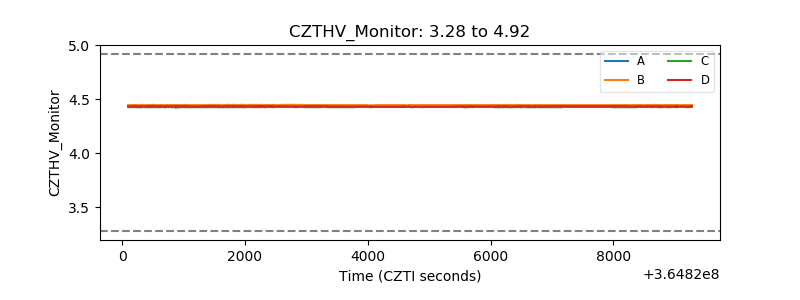 |
| D_VDD | 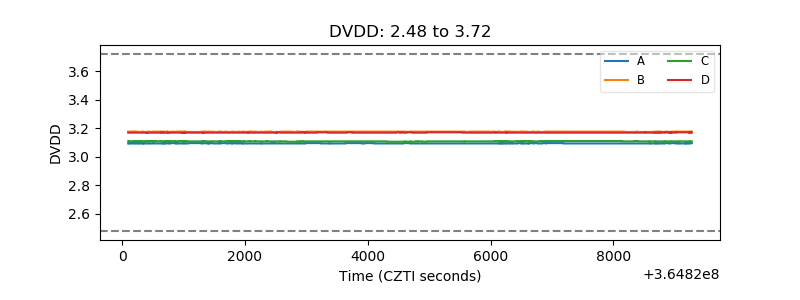 |
| Temperature 1 | 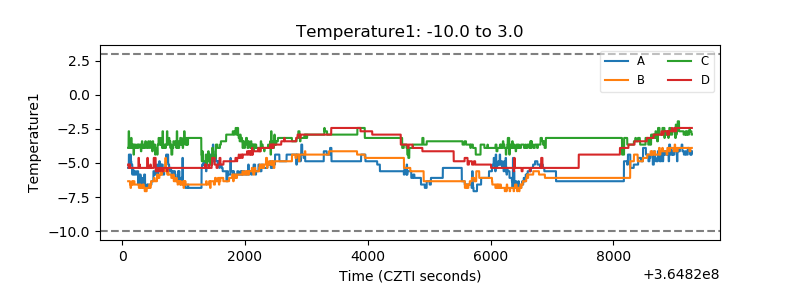 |
| Veto HV Monitor | 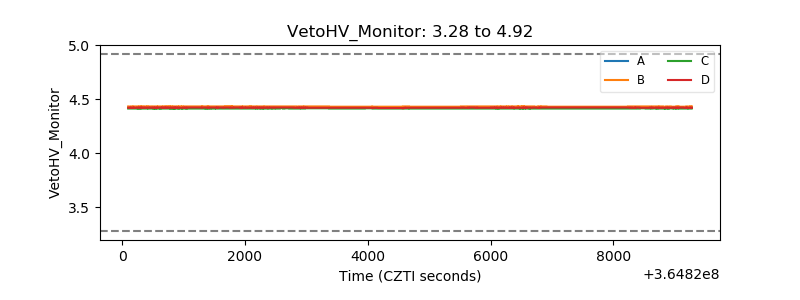 |
| Veto LLD |  |
| Alpha Counter | 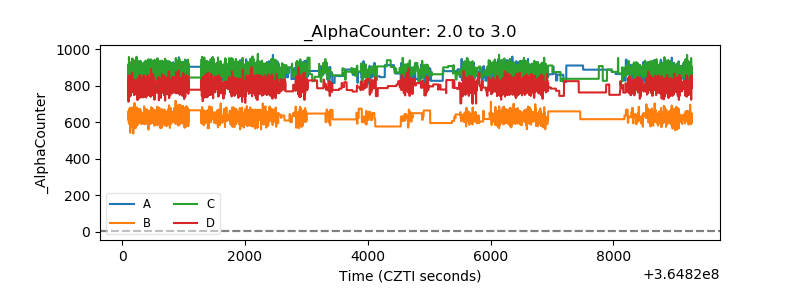 |
| _CPM_Rate | 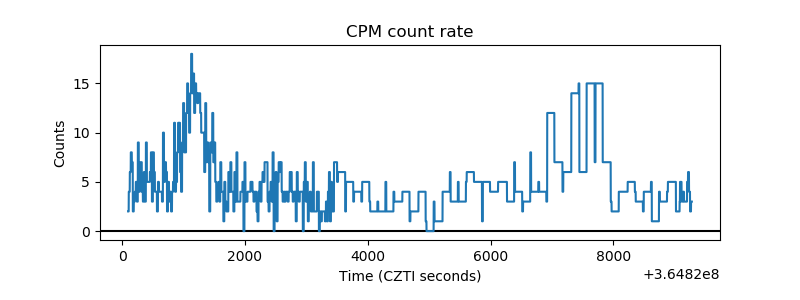 |
| CZT Counter | 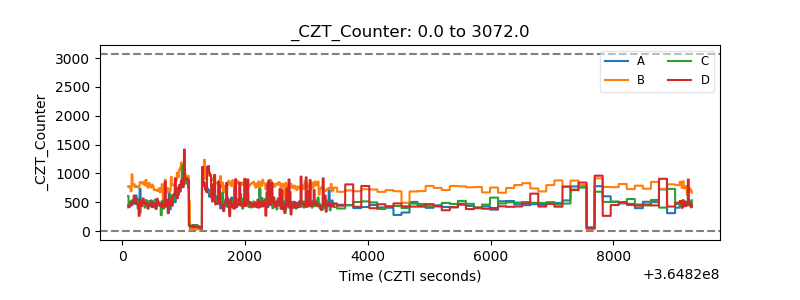 |
| +2.5 Volts monitor |  |
| +5 Volts monitor |  |
| _ROLL_ROT | 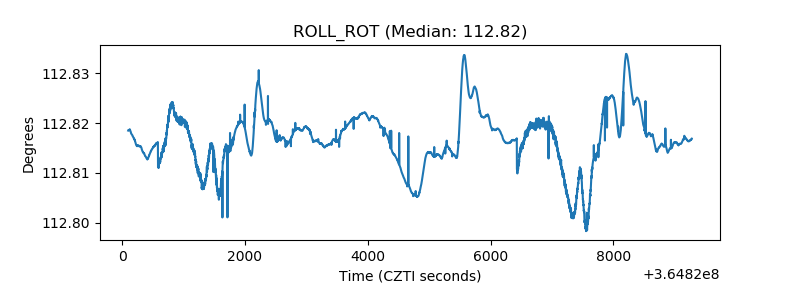 |
| _Roll_DEC | 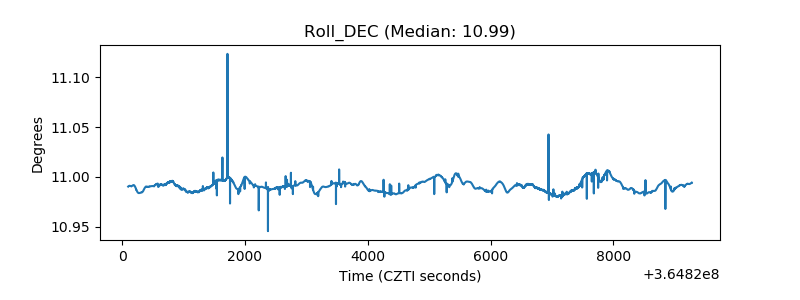 |
| _Roll_RA | 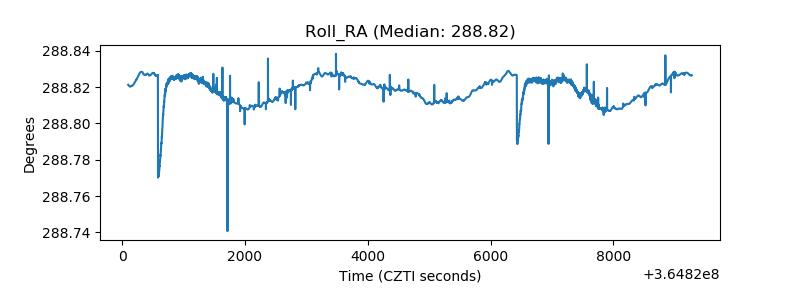 |
| Veto Counter | 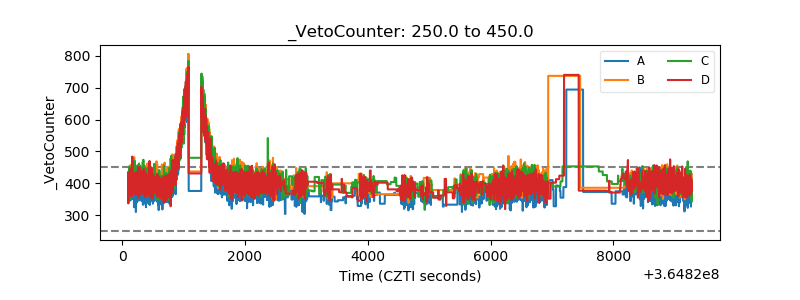 |