| Param | Original file | Final file |
|---|---|---|
| Filename | modeM0/AS1T04_029T01_9000004582_31477cztM0_level2.evt | modeM0/AS1T04_029T01_9000004582_31477cztM0_level2_quad_clean.evt |
| Size (bytes) | 630,466,560 | 112,250,880 |
| Size | 601.3 MB | 107.1 MB |
| Events in quadrant A | 3,749,164 | 733,212 |
| Events in quadrant B | 6,080,479 | 731,450 |
| Events in quadrant C | 4,200,385 | 692,684 |
| Events in quadrant D | 4,521,113 | 685,445 |
| Mode SS | |||
|---|---|---|---|
| Quadrant | BADHDUFLAG | Total packets | Discarded packets |
| A | 0 | 162 | 2 |
| B | 0 | 162 | 0 |
| C | 0 | 162 | 0 |
| D | 0 | 162 | 0 |
| Mode M9 | |||
|---|---|---|---|
| Quadrant | BADHDUFLAG | Total packets | Discarded packets |
| A | 0 | 3 | 0 |
| B | 0 | 3 | 0 |
| C | 0 | 3 | 0 |
| D | 0 | 3 | 0 |
| Mode M0 | |||
|---|---|---|---|
| Quadrant | BADHDUFLAG | Total packets | Discarded packets |
| A | 0 | 16381 | 15 |
| B | 0 | 24302 | 47 |
| C | 0 | 17513 | 33 |
| D | 0 | 18654 | 17 |
| Quadrant | Total seconds | Saturated seconds | Saturation percentage |
|---|---|---|---|
| A | 8017 | 135 | 1.683922% |
| B | 8008 | 205 | 2.559940% |
| C | 8008 | 358 | 4.470529% |
| D | 8017 | 212 | 2.644381% |
Noise dominated data is calculated using 1-second bins in cleaned event files. If a bin has >2000 counts, and if more than 50% of those come from <1% of pixels, then it is considered to be noise-dominated and hence unusable.
| Quadrant | # 1 sec bins | Bins with >0 counts | Bins with >2000 counts | High rate bins dominated by noise | Noise dominated (total time) | Noise dominated (detector-on time) | Marked lightcurve |
|---|---|---|---|---|---|---|---|
| A | 8349 | 8024 | 0 | 0 | 0.00% | 0.00% | 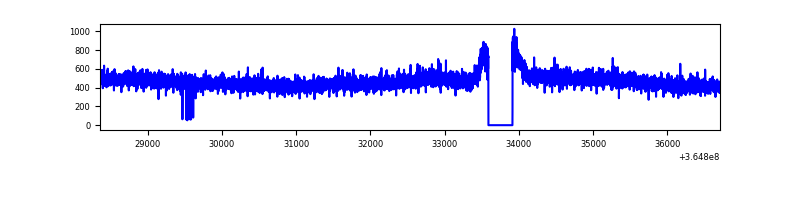 |
| B | 8349 | 8023 | 2 | 2 | 0.02% | 0.02% | 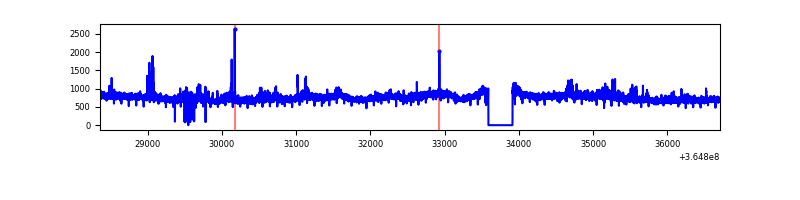 |
| C | 8349 | 8020 | 1 | 1 | 0.01% | 0.01% | 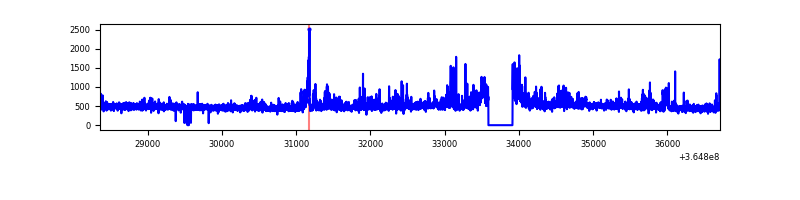 |
| D | 8349 | 8023 | 109 | 109 | 1.31% | 1.36% | 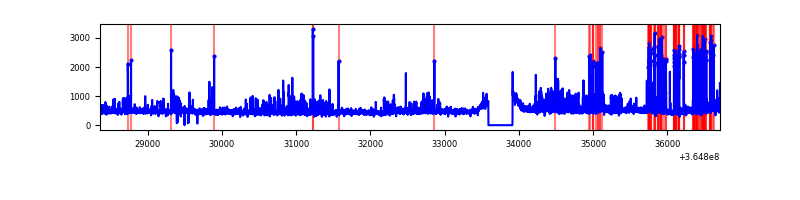 |
Top three noisy pixels from each quadrant. If the there are fewer than three noisy pixels in the level2.evt file, extra rows are filled as -1
| Pixel properties | Quadrant properties | ||||||
|---|---|---|---|---|---|---|---|
| Quadrant | DetID | PixID | Counts | Sigma | Mean | Median | Sigma |
| A | 13 | 254 | 11652 | 54.44 | 972 | 953 | 196.5 |
| A | 3 | 137 | 10449 | 48.32 | 972 | 953 | 196.5 |
| A | 0 | 226 | 8008 | 35.9 | 972 | 953 | 196.5 |
| B | 6 | 159 | 2146498 | 11685.22 | 950 | 925 | 183.6 |
| B | 4 | 80 | 146008 | 790.15 | 950 | 925 | 183.6 |
| B | 0 | 190 | 41149 | 219.07 | 950 | 925 | 183.6 |
| C | 14 | 238 | 204999 | 931.74 | 923 | 928 | 219.0 |
| C | 3 | 233 | 175730 | 798.1 | 923 | 928 | 219.0 |
| C | 14 | 254 | 83789 | 378.32 | 923 | 928 | 219.0 |
| D | 8 | 195 | 771538 | 3422.57 | 944 | 920 | 225.2 |
| D | 2 | 250 | 72126 | 316.25 | 944 | 920 | 225.2 |
| D | 5 | 233 | 69741 | 305.66 | 944 | 920 | 225.2 |
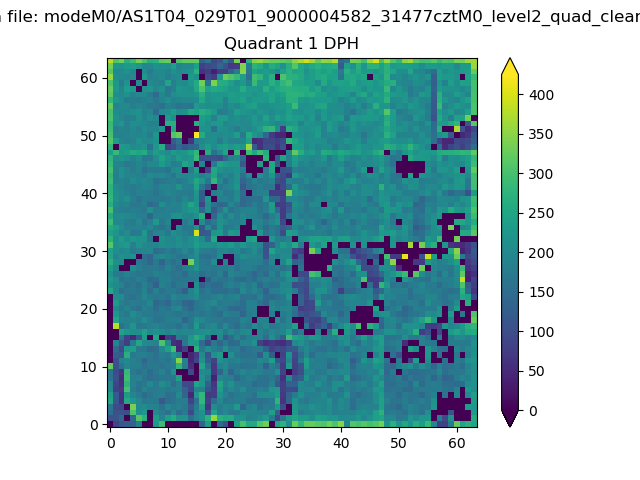
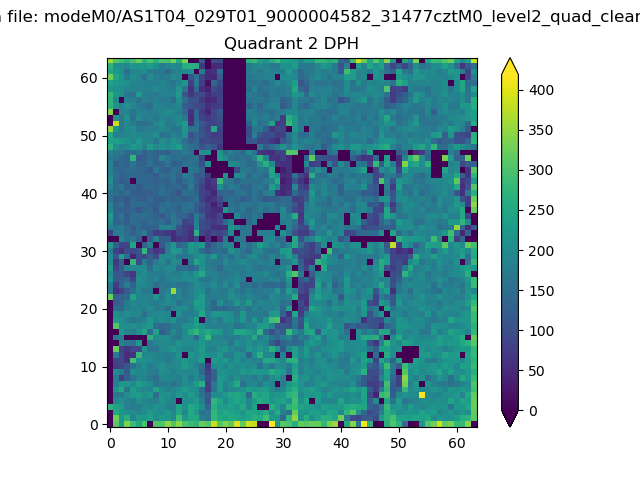
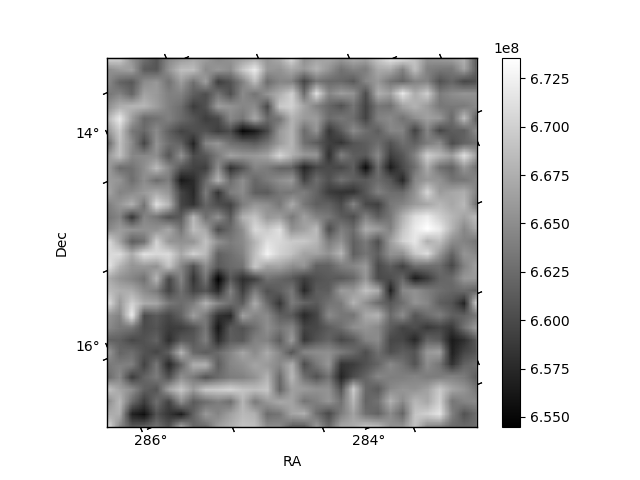
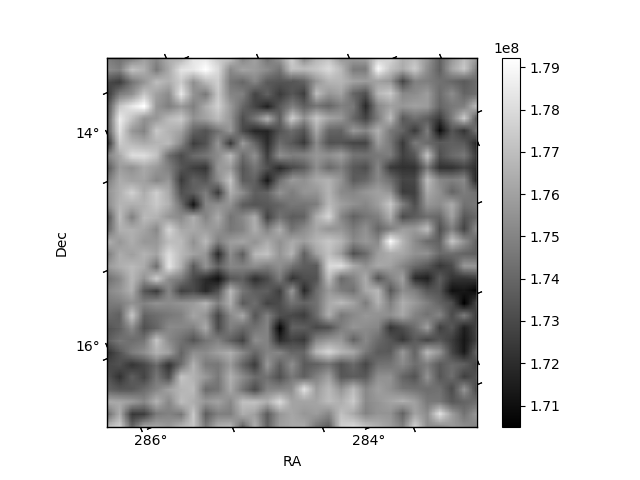
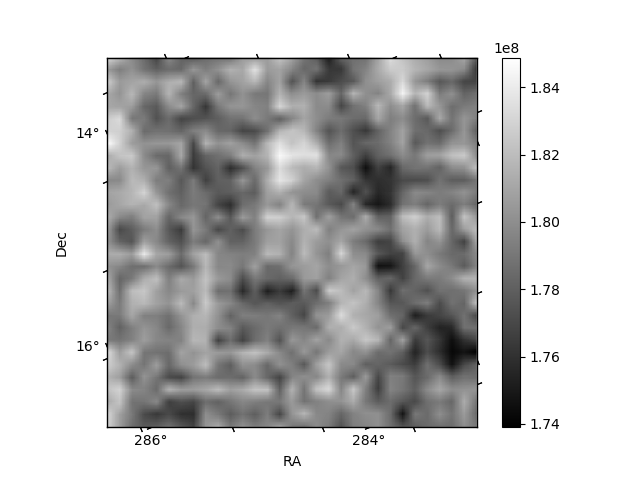
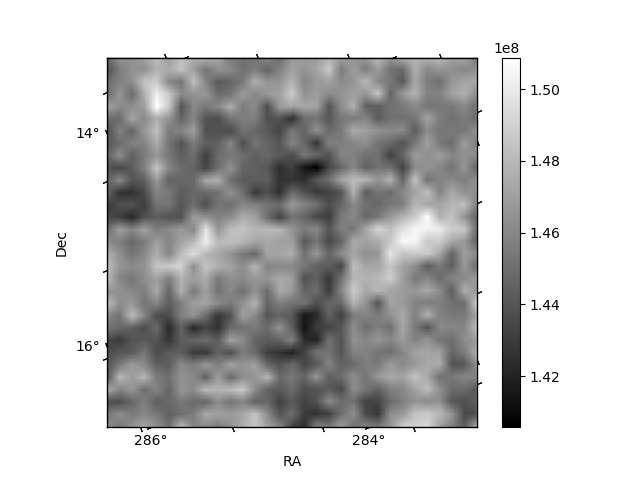
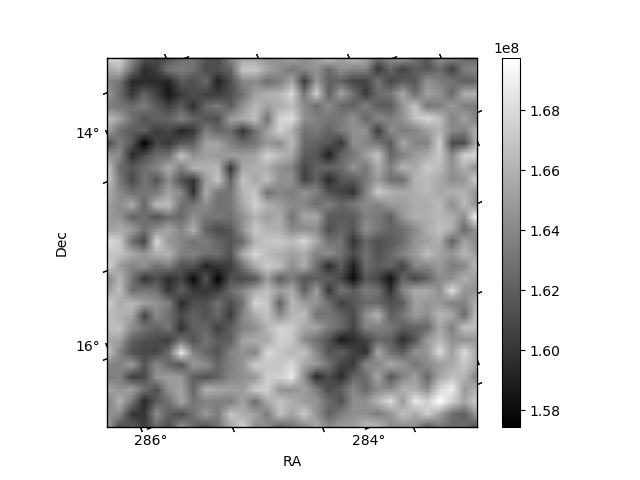
Histogram calculated using DETX and DETY for each event in the final _common_clean file
| Quadrant A |  |
 |
Quadrant B |
|---|---|---|---|
| Quadrant D | 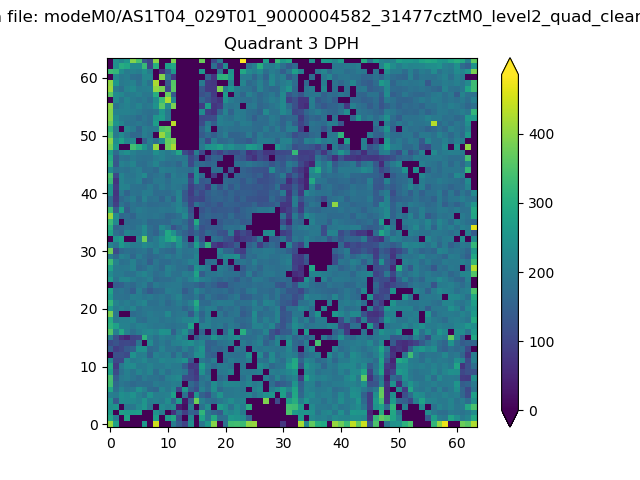 |
 |
Quadrant C |
| Plot type | Count rate plots | Images |
|---|---|---|
| Comparison with Poisson distribution Blue bars denote a histogram of data divided into 1 sec bins. Red curve is a Poisson curve with rate = median count rate of data. |
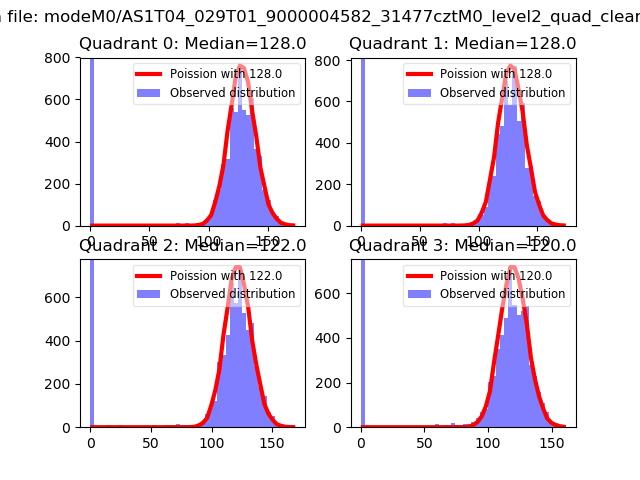 |
 |
| Quadrant-wise count rates Data is divided into 100 sec bins |
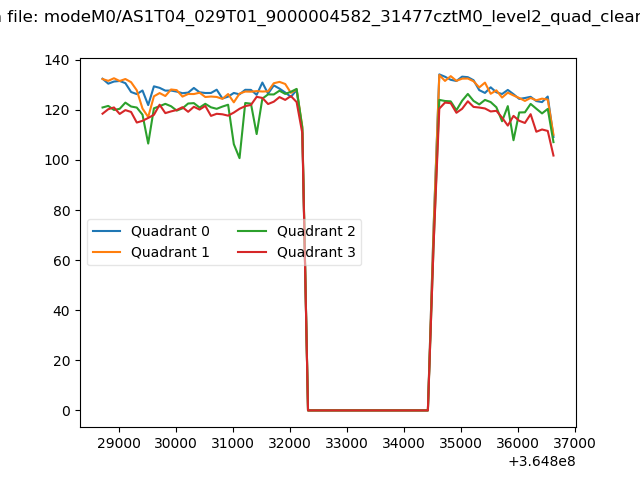 |
|
| Module-wise count rates for Quadrant A Data is divided into 100 sec bins |
 |
 |
| Module-wise count rates for Quadrant B Data is divided into 100 sec bins |
 |
 |
| Module-wise count rates for Quadrant C Data is divided into 100 sec bins |
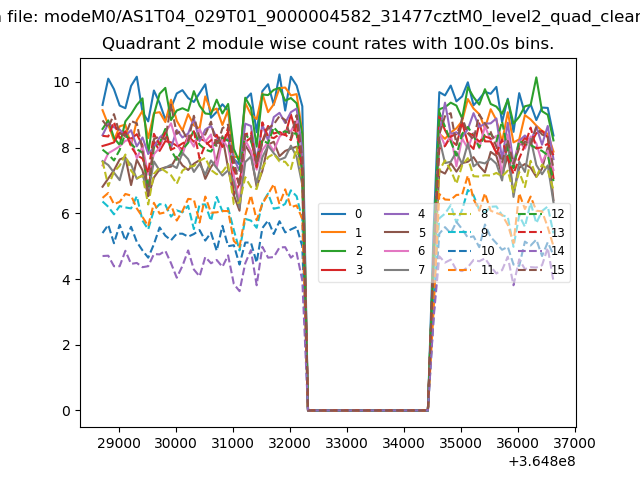 |
 |
| Module-wise count rates for Quadrant D Data is divided into 100 sec bins |
 |
 |
| Parameter | Plot |
|---|---|
| CZT HV Monitor | 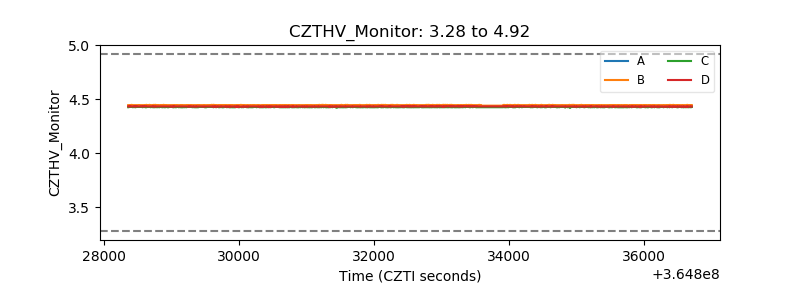 |
| D_VDD | 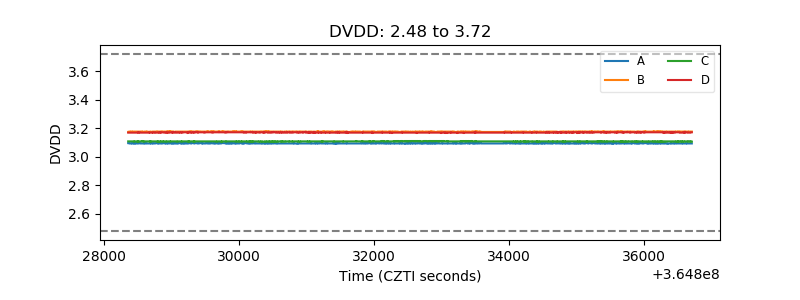 |
| Temperature 1 | 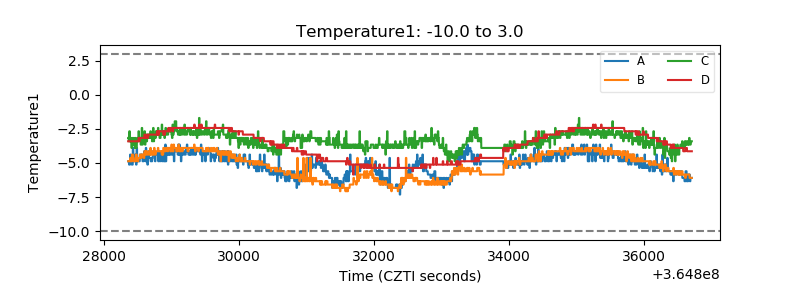 |
| Veto HV Monitor | 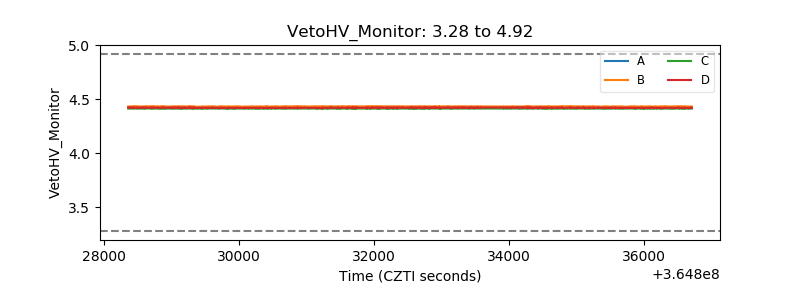 |
| Veto LLD | 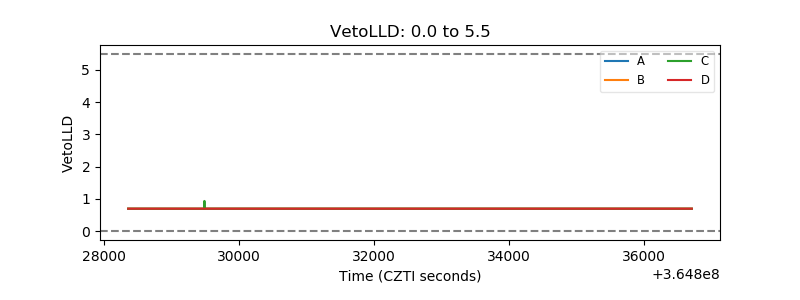 |
| Alpha Counter | 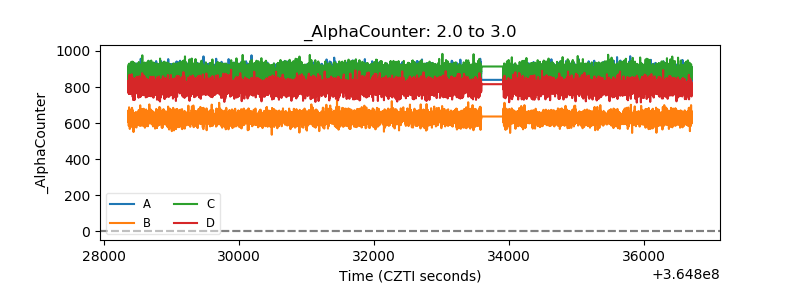 |
| _CPM_Rate | 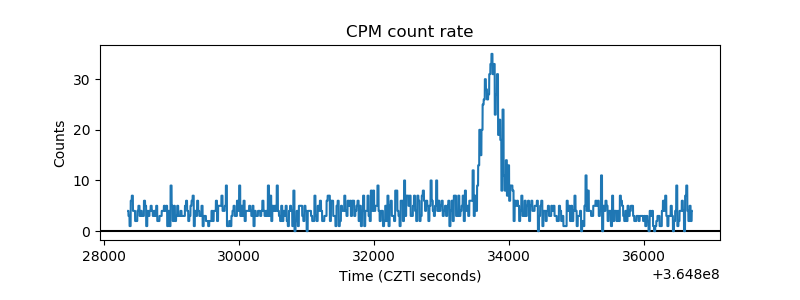 |
| CZT Counter | 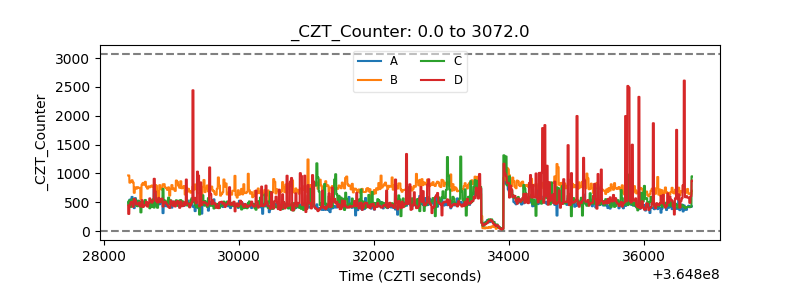 |
| +2.5 Volts monitor |  |
| +5 Volts monitor | 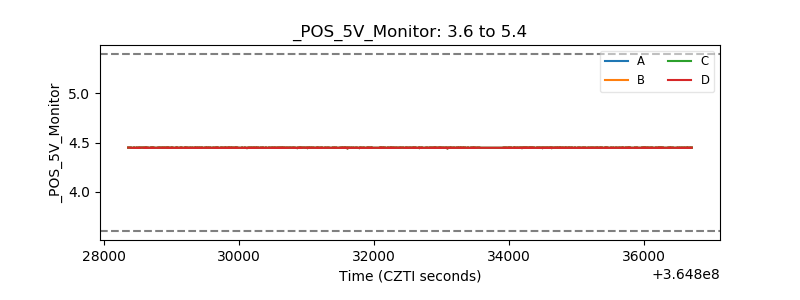 |
| _ROLL_ROT | 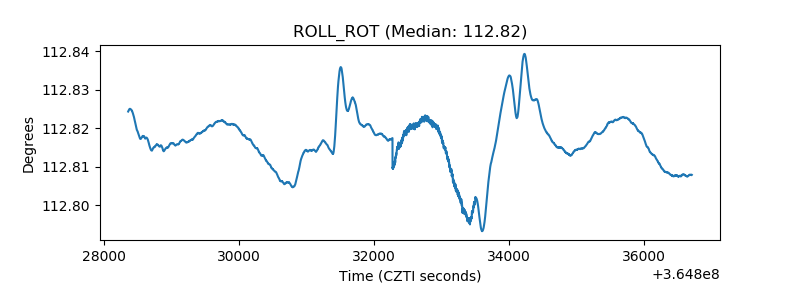 |
| _Roll_DEC | 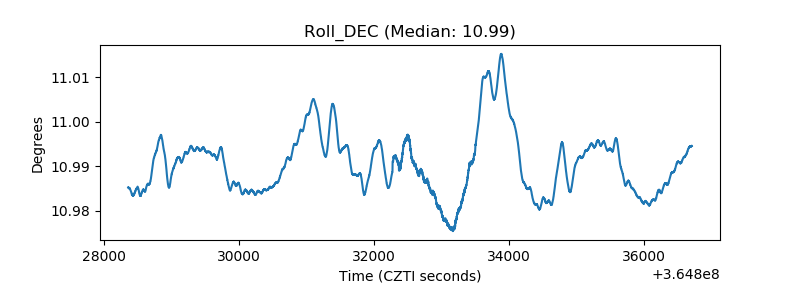 |
| _Roll_RA | 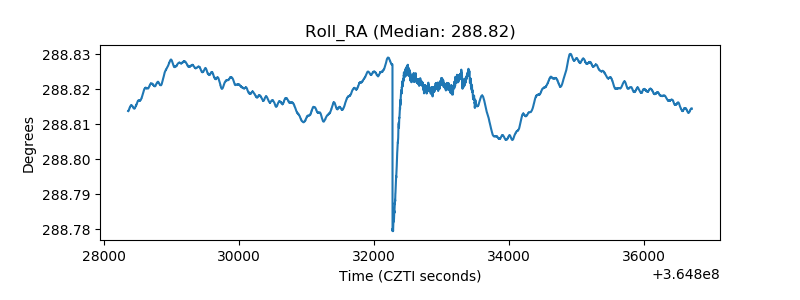 |
| Veto Counter | 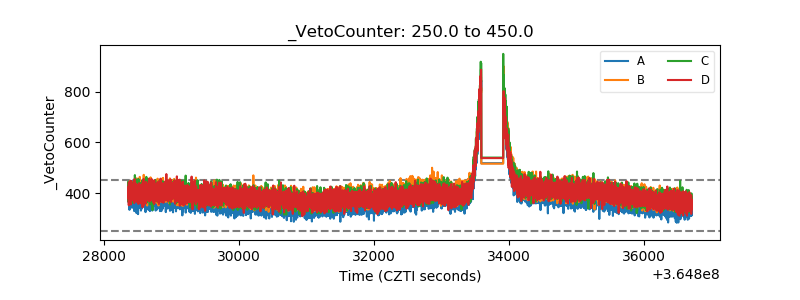 |