| Param | Original file | Final file |
|---|---|---|
| Filename | modeM0/AS1T04_028T01_9000004584cztM0_level2.fits | modeM0/AS1T04_028T01_9000004584cztM0_level2_quad_clean.evt |
| Size (bytes) | 817,174,080 | 643,561,920 |
| Size | 779.3 MB | 613.7 MB |
| Events in quadrant A | 5,175,772 | 3,729,493 |
| Events in quadrant B | 4,472,264 | 3,294,568 |
| Events in quadrant C | 4,990,154 | 3,561,809 |
| Events in quadrant D | 4,354,198 | 3,152,534 |
| Mode SS | |||
|---|---|---|---|
| Quadrant | BADHDUFLAG | Total packets | Discarded packets |
| A | 0 | 1704 | 0 |
| B | 0 | 1700 | 0 |
| C | 0 | 1703 | 0 |
| D | 0 | 1702 | 0 |
| Mode M0 | |||
|---|---|---|---|
| Quadrant | BADHDUFLAG | Total packets | Discarded packets |
| A | 0 | 180479 | 0 |
| B | 0 | 303718 | 0 |
| C | 0 | 186114 | 0 |
| D | 0 | 225281 | 0 |
| Mode M9 | |||
|---|---|---|---|
| Quadrant | BADHDUFLAG | Total packets | Discarded packets |
| A | 0 | 149 | 0 |
| B | 0 | 149 | 0 |
| C | 0 | 150 | 0 |
| D | 0 | 150 | 0 |
| Quadrant | Total seconds | Saturated seconds | Saturation percentage |
|---|---|---|---|
| A | 83887 | 1409 | 1.679640% |
| B | 83774 | 11214 | 13.386015% |
| C | 83931 | 2561 | 3.051316% |
| D | 83925 | 3395 | 4.045279% |
Noise dominated data is calculated using 1-second bins in cleaned event files. If a bin has >2000 counts, and if more than 50% of those come from <1% of pixels, then it is considered to be noise-dominated and hence unusable.
| Quadrant | # 1 sec bins | Bins with >0 counts | Bins with >2000 counts | High rate bins dominated by noise | Noise dominated (total time) | Noise dominated (detector-on time) | Marked lightcurve |
|---|---|---|---|---|---|---|---|
| A | 112012 | 84006 | 0 | 0 | 0.00% | 0.00% |  |
| B | 112012 | 81865 | 0 | 0 | 0.00% | 0.00% | 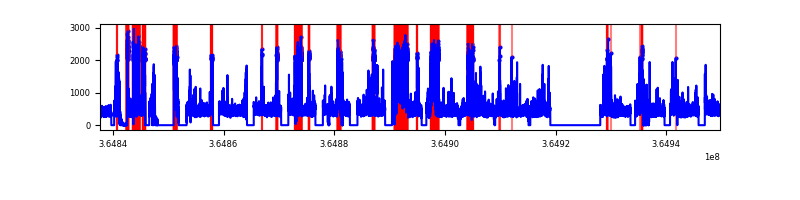 |
| C | 112012 | 84055 | 0 | 0 | 0.00% | 0.00% |  |
| D | 112012 | 83992 | 0 | 0 | 0.00% | 0.00% | 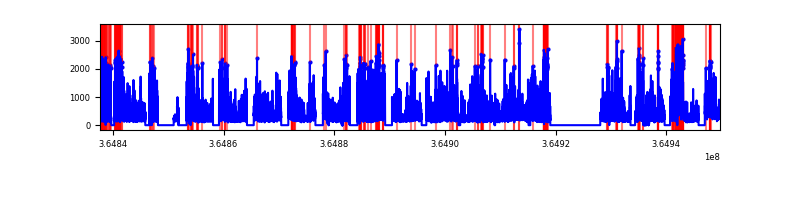 |
Top three noisy pixels from each quadrant. If the there are fewer than three noisy pixels in the level2.evt file, extra rows are filled as -1
| Pixel properties | Quadrant properties | ||||||
|---|---|---|---|---|---|---|---|
| Quadrant | DetID | PixID | Counts | Sigma | Mean | Median | Sigma |
| A | 0 | 29 | 4343 | 9.28 | 1348 | 1266 | 331.6 |
| A | 7 | 110 | 4116 | 8.59 | 1348 | 1266 | 331.6 |
| A | 9 | 19 | 3829 | 7.73 | 1348 | 1266 | 331.6 |
| B | 2 | 9 | 3604 | 10.51 | 1185 | 1131 | 235.2 |
| B | 3 | 80 | 3022 | 8.04 | 1185 | 1131 | 235.2 |
| B | 5 | 128 | 3022 | 8.04 | 1185 | 1131 | 235.2 |
| C | 1 | 80 | 3903 | 7.97 | 1321 | 1236 | 334.6 |
| C | 1 | 81 | 3888 | 7.93 | 1321 | 1236 | 334.6 |
| C | 12 | 241 | 3643 | 7.19 | 1321 | 1236 | 334.6 |
| D | 3 | 14 | 3113 | 5.94 | 1244 | 1132 | 333.5 |
| D | 15 | 47 | 3087 | 5.86 | 1244 | 1132 | 333.5 |
| D | 10 | 189 | 3078 | 5.83 | 1244 | 1132 | 333.5 |
Histogram calculated using DETX and DETY for each event in the final _common_clean file
| Quadrant A | 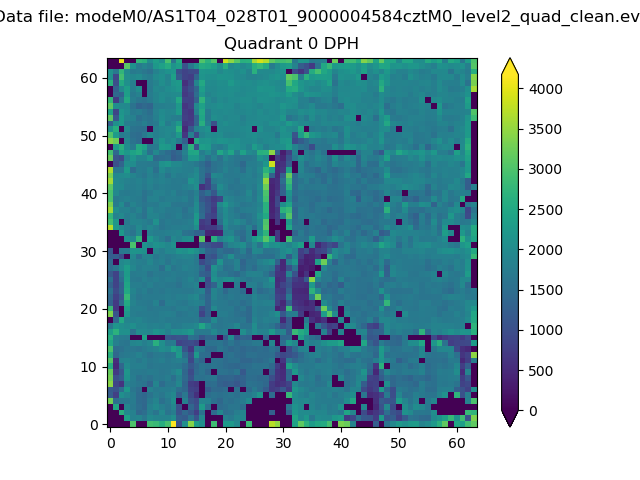 |
 |
Quadrant B |
|---|---|---|---|
| Quadrant D |  |
 |
Quadrant C |
| Plot type | Count rate plots | Images |
|---|---|---|
| Comparison with Poisson distribution Blue bars denote a histogram of data divided into 1 sec bins. Red curve is a Poisson curve with rate = median count rate of data. |
 |
 |
| Quadrant-wise count rates Data is divided into 100 sec bins |
 |
|
| Module-wise count rates for Quadrant A Data is divided into 100 sec bins |
 |
 |
| Module-wise count rates for Quadrant B Data is divided into 100 sec bins |
 |
 |
| Module-wise count rates for Quadrant C Data is divided into 100 sec bins |
 |
 |
| Module-wise count rates for Quadrant D Data is divided into 100 sec bins |
 |
 |
| Parameter | Plot |
|---|---|
| CZT HV Monitor |  |
| D_VDD |  |
| Temperature 1 | 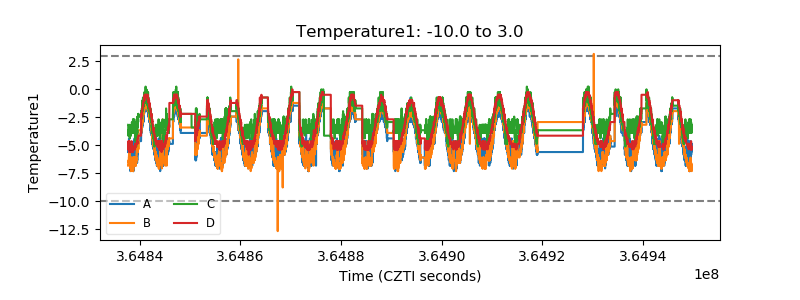 |
| Veto HV Monitor |  |
| Veto LLD |  |
| Alpha Counter |  |
| _CPM_Rate |  |
| CZT Counter |  |
| +2.5 Volts monitor |  |
| +5 Volts monitor |  |
| _ROLL_ROT |  |
| _Roll_DEC |  |
| _Roll_RA |  |
| Veto Counter |  |