| Param | Original file | Final file |
|---|---|---|
| Filename | modeM0/AS1T04_028T01_9000004584_31477cztM0_level2.evt | modeM0/AS1T04_028T01_9000004584_31477cztM0_level2_quad_clean.evt |
| Size (bytes) | 927,763,200 | 94,345,920 |
| Size | 884.8 MB | 90.0 MB |
| Events in quadrant A | 4,431,123 | 656,165 |
| Events in quadrant B | 11,909,439 | 338,115 |
| Events in quadrant C | 4,735,588 | 632,031 |
| Events in quadrant D | 6,399,693 | 591,735 |
| Mode SS | |||
|---|---|---|---|
| Quadrant | BADHDUFLAG | Total packets | Discarded packets |
| A | 0 | 186 | 0 |
| B | 0 | 186 | 0 |
| C | 0 | 186 | 0 |
| D | 0 | 186 | 0 |
| Mode M0 | |||
|---|---|---|---|
| Quadrant | BADHDUFLAG | Total packets | Discarded packets |
| A | 0 | 18990 | 2 |
| B | 0 | 41967 | 2 |
| C | 0 | 19829 | 2 |
| D | 0 | 25060 | 4 |
| Mode M9 | |||
|---|---|---|---|
| Quadrant | BADHDUFLAG | Total packets | Discarded packets |
| A | 0 | 13 | 0 |
| B | 0 | 13 | 0 |
| C | 0 | 13 | 0 |
| D | 0 | 13 | 0 |
| Quadrant | Total seconds | Saturated seconds | Saturation percentage |
|---|---|---|---|
| A | 9193 | 130 | 1.414119% |
| B | 9193 | 3717 | 40.432938% |
| C | 9193 | 232 | 2.523659% |
| D | 9192 | 584 | 6.353351% |
Noise dominated data is calculated using 1-second bins in cleaned event files. If a bin has >2000 counts, and if more than 50% of those come from <1% of pixels, then it is considered to be noise-dominated and hence unusable.
| Quadrant | # 1 sec bins | Bins with >0 counts | Bins with >2000 counts | High rate bins dominated by noise | Noise dominated (total time) | Noise dominated (detector-on time) | Marked lightcurve |
|---|---|---|---|---|---|---|---|
| A | 10453 | 9193 | 0 | 0 | 0.00% | 0.00% | 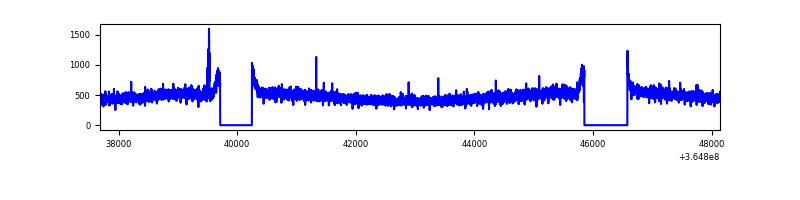 |
| B | 10452 | 9192 | 1896 | 1896 | 18.14% | 20.63% |  |
| C | 10453 | 9193 | 6 | 6 | 0.06% | 0.07% | 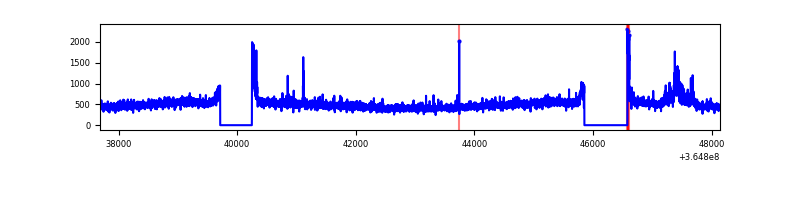 |
| D | 10452 | 9192 | 383 | 383 | 3.66% | 4.17% | 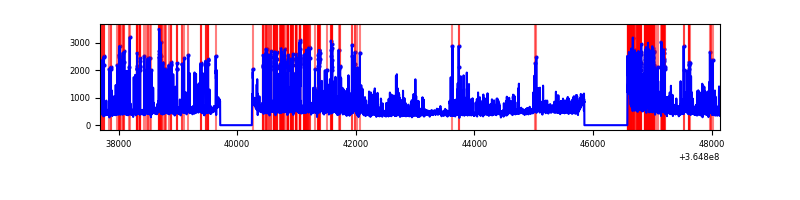 |
Top three noisy pixels from each quadrant. If the there are fewer than three noisy pixels in the level2.evt file, extra rows are filled as -1
| Pixel properties | Quadrant properties | ||||||
|---|---|---|---|---|---|---|---|
| Quadrant | DetID | PixID | Counts | Sigma | Mean | Median | Sigma |
| A | 13 | 254 | 15588 | 62.6 | 1143 | 1119 | 231.1 |
| A | 13 | 170 | 14751 | 58.98 | 1143 | 1119 | 231.1 |
| A | 3 | 137 | 12100 | 47.51 | 1143 | 1119 | 231.1 |
| B | 12 | 1 | 7012087 | 45227.57 | 791 | 771 | 155.0 |
| B | 6 | 159 | 1662294 | 10717.91 | 791 | 771 | 155.0 |
| B | 4 | 80 | 58210 | 370.52 | 791 | 771 | 155.0 |
| C | 14 | 238 | 176342 | 674.87 | 1092 | 1095 | 259.7 |
| C | 3 | 233 | 146854 | 561.31 | 1092 | 1095 | 259.7 |
| C | 0 | 10 | 116486 | 444.37 | 1092 | 1095 | 259.7 |
| D | 8 | 195 | 1236553 | 4757.09 | 1080 | 1050 | 259.7 |
| D | 12 | 218 | 689227 | 2649.71 | 1080 | 1050 | 259.7 |
| D | 12 | 233 | 113448 | 432.77 | 1080 | 1050 | 259.7 |
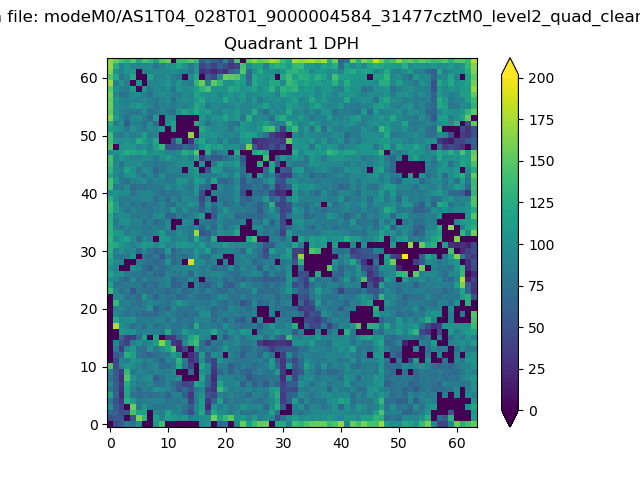
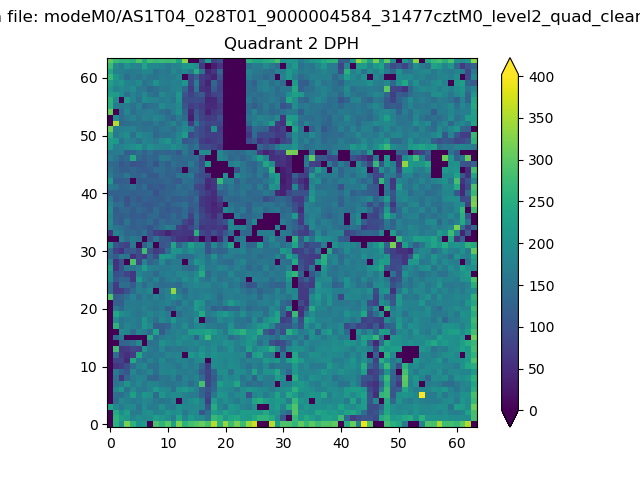
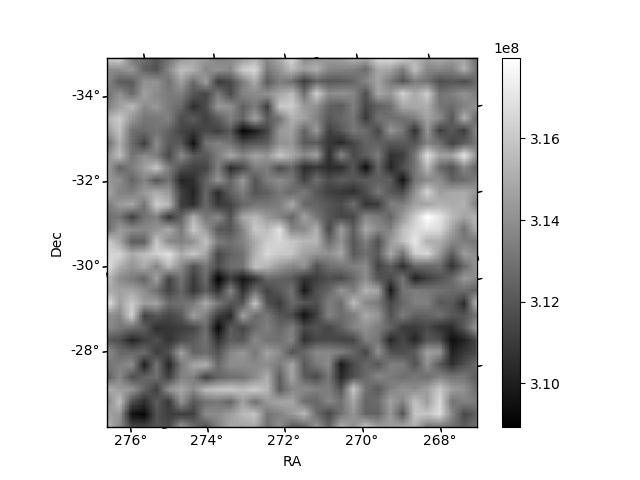
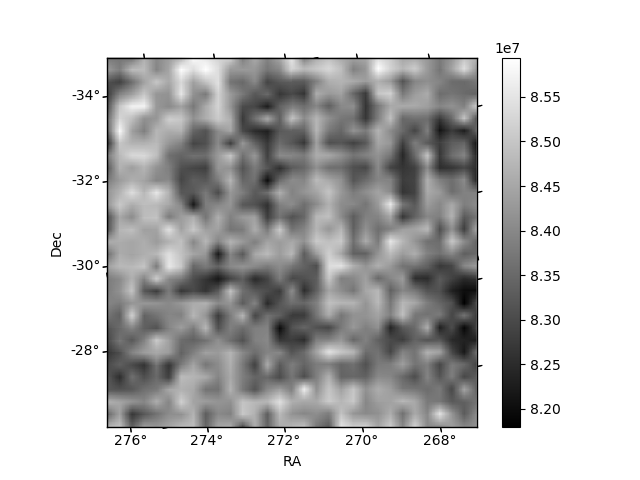
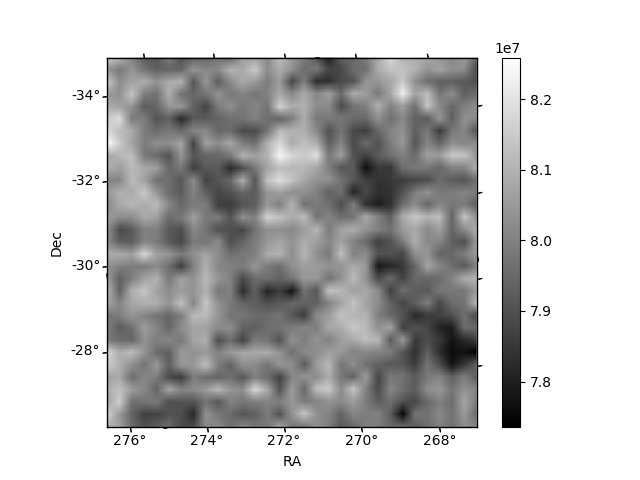
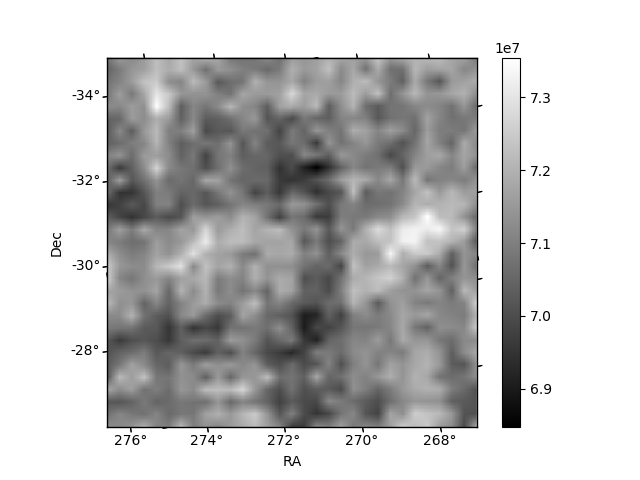
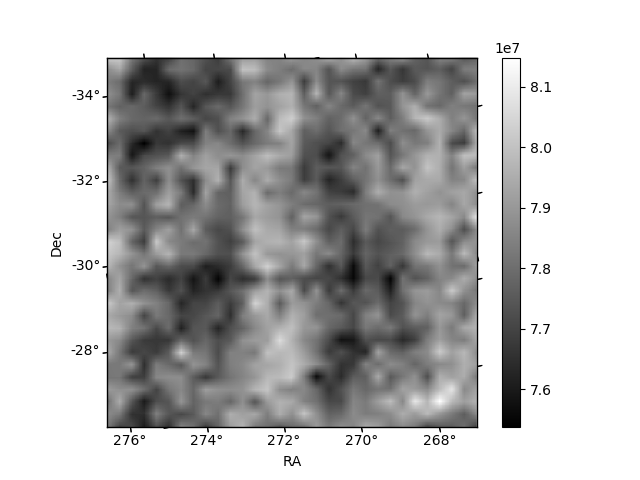
Histogram calculated using DETX and DETY for each event in the final _common_clean file
| Quadrant A | 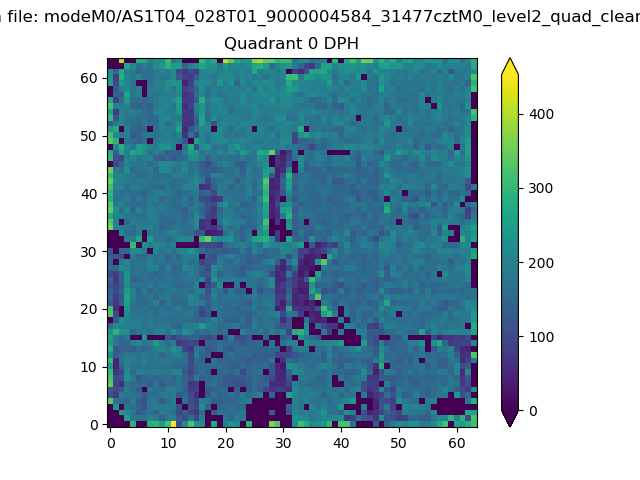 |
 |
Quadrant B |
|---|---|---|---|
| Quadrant D | 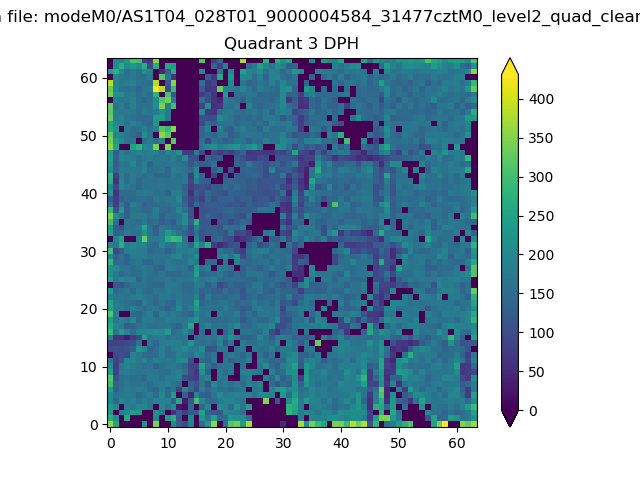 |
 |
Quadrant C |
| Plot type | Count rate plots | Images |
|---|---|---|
| Comparison with Poisson distribution Blue bars denote a histogram of data divided into 1 sec bins. Red curve is a Poisson curve with rate = median count rate of data. |
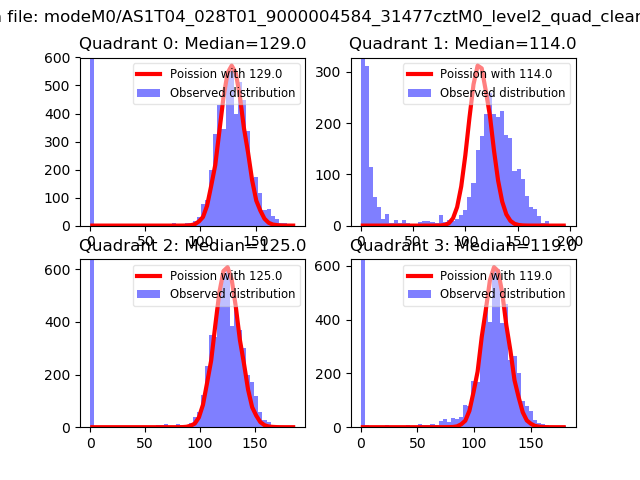 |
 |
| Quadrant-wise count rates Data is divided into 100 sec bins |
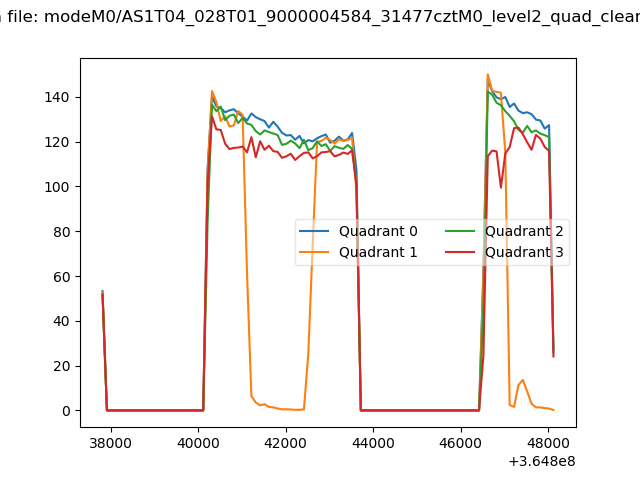 |
|
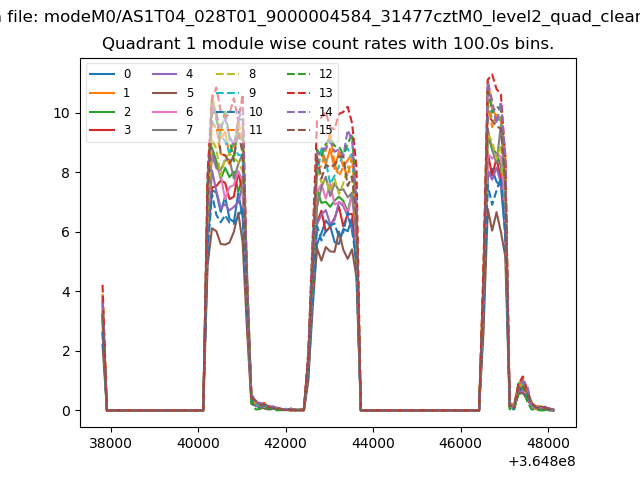
| Module-wise count rates for Quadrant A Data is divided into 100 sec bins |
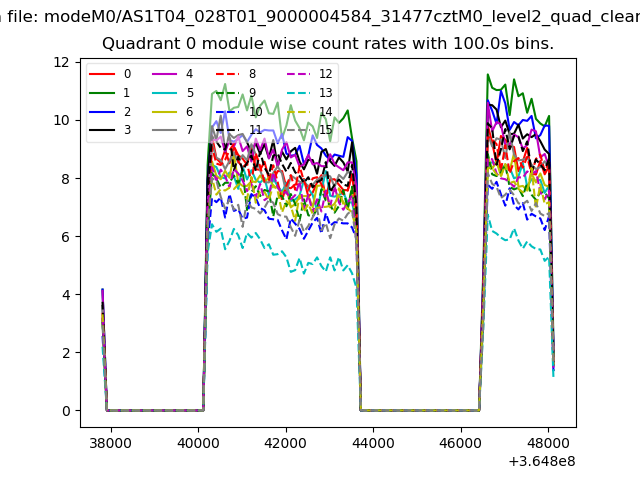 |
 |
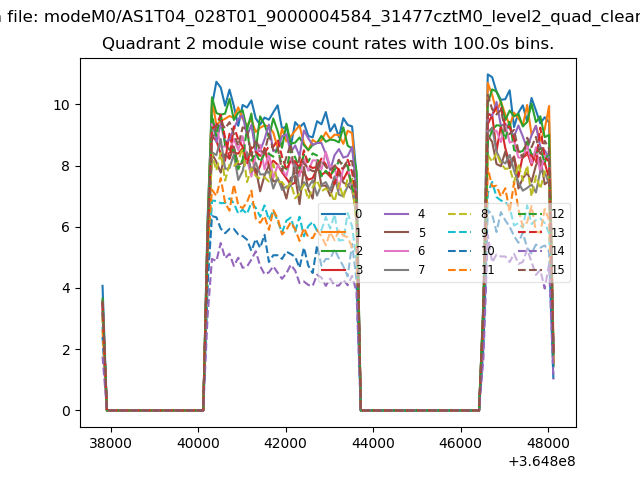
| Module-wise count rates for Quadrant B Data is divided into 100 sec bins |
 |
 |
| Module-wise count rates for Quadrant C Data is divided into 100 sec bins |
 |
 |
| Module-wise count rates for Quadrant D Data is divided into 100 sec bins |
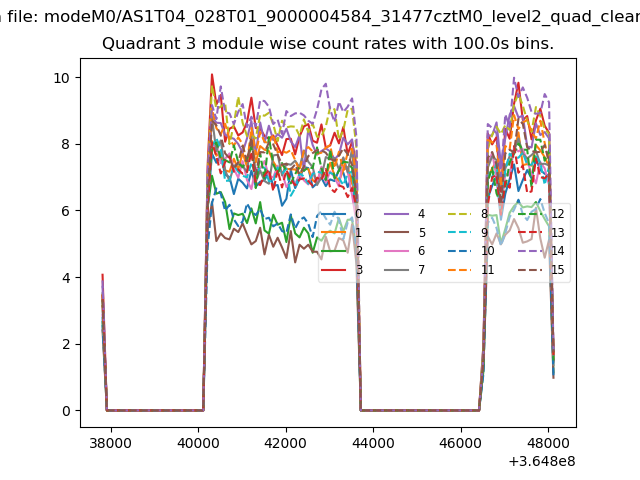 |
 |
| Parameter | Plot |
|---|---|
| CZT HV Monitor | 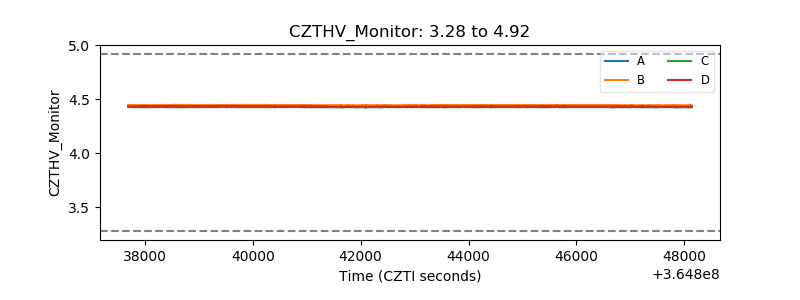 |
| D_VDD | 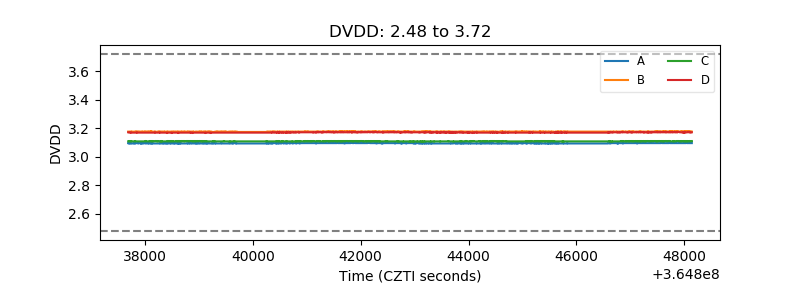 |
| Temperature 1 | 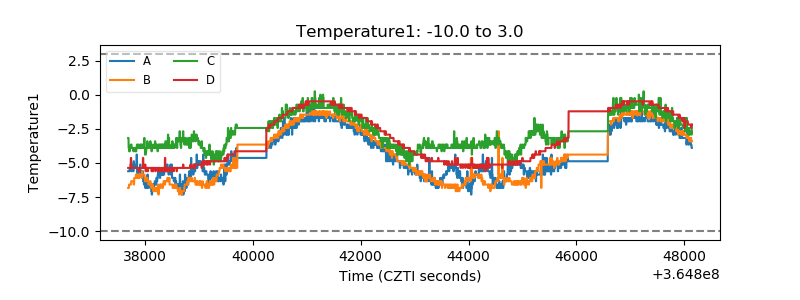 |
| Veto HV Monitor | 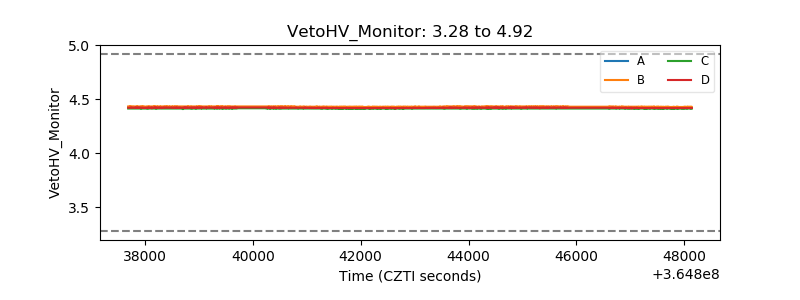 |
| Veto LLD | 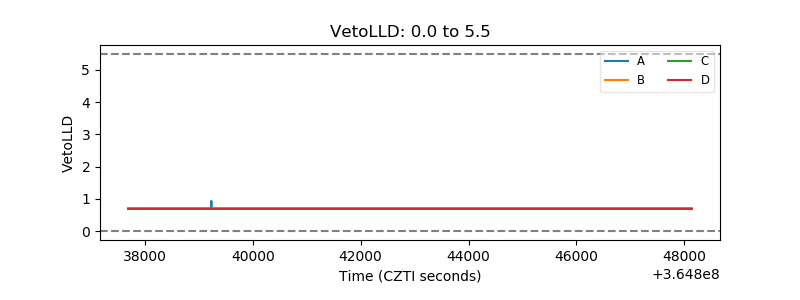 |
| Alpha Counter | 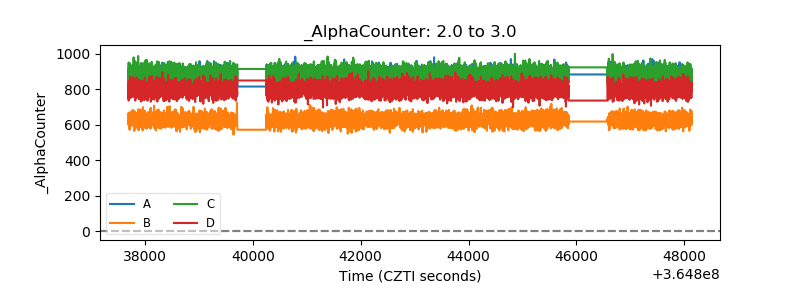 |
| _CPM_Rate | 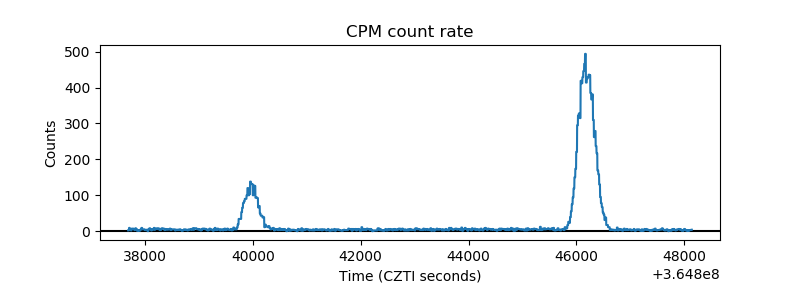 |
| CZT Counter | 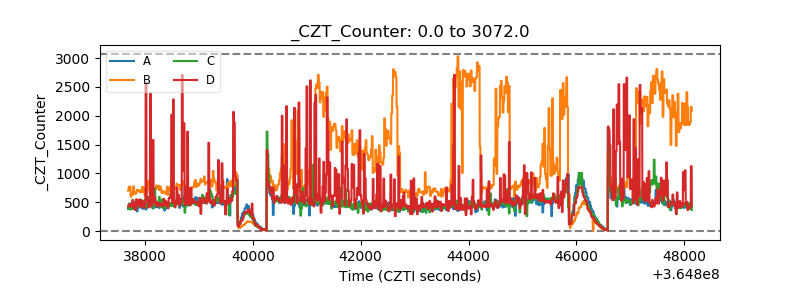 |
| +2.5 Volts monitor | 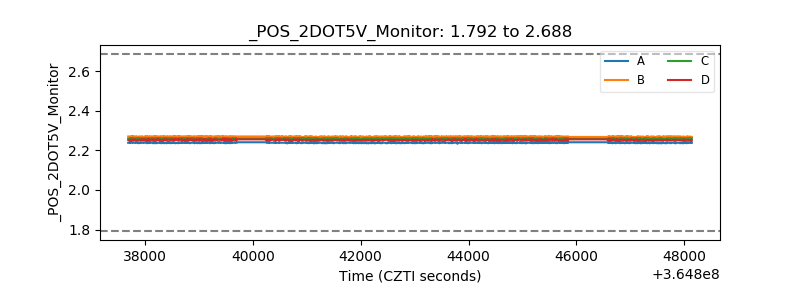 |
| +5 Volts monitor |  |
| _ROLL_ROT | 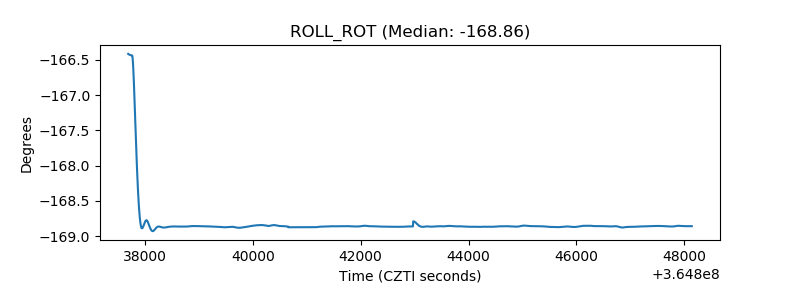 |
| _Roll_DEC | 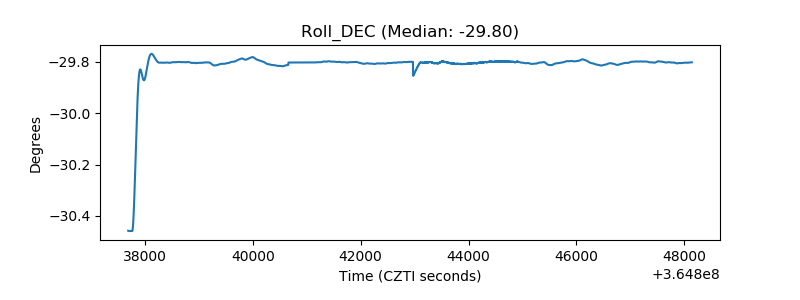 |
| _Roll_RA | 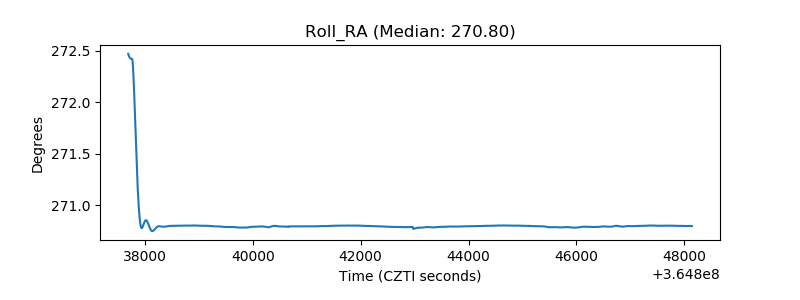 |
| Veto Counter | 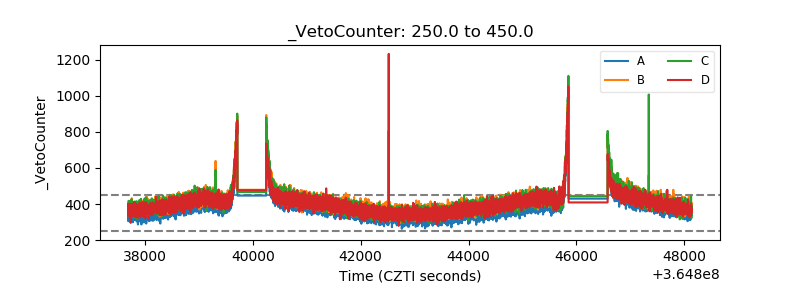 |