| Param | Original file | Final file |
|---|---|---|
| Filename | modeM0/AS1T04_028T01_9000004584_31478cztM0_level2.evt | modeM0/AS1T04_028T01_9000004584_31478cztM0_level2_quad_clean.evt |
| Size (bytes) | 298,540,800 | 39,450,240 |
| Size | 284.7 MB | 37.6 MB |
| Events in quadrant A | 1,424,027 | 276,335 |
| Events in quadrant B | 3,341,166 | 221,586 |
| Events in quadrant C | 1,492,783 | 266,357 |
| Events in quadrant D | 2,593,809 | 231,288 |
| Mode SS | |||
|---|---|---|---|
| Quadrant | BADHDUFLAG | Total packets | Discarded packets |
| A | 0 | 63 | 7 |
| B | 0 | 65 | 11 |
| C | 0 | 66 | 10 |
| D | 0 | 65 | 7 |
| Mode M0 | |||
|---|---|---|---|
| Quadrant | BADHDUFLAG | Total packets | Discarded packets |
| A | 0 | 6580 | 798 |
| B | 0 | 14504 | 2789 |
| C | 0 | 6887 | 863 |
| D | 0 | 10539 | 1010 |
| Mode M9 | |||
|---|---|---|---|
| Quadrant | BADHDUFLAG | Total packets | Discarded packets |
| A | 0 | 4 | 0 |
| B | 0 | 8 | 4 |
| C | 0 | 4 | 0 |
| D | 0 | 4 | 0 |
| Quadrant | Total seconds | Saturated seconds | Saturation percentage |
|---|---|---|---|
| A | 2784 | 12 | 0.431034% |
| B | 2728 | 751 | 27.529326% |
| C | 2786 | 52 | 1.866475% |
| D | 2779 | 346 | 12.450522% |
Noise dominated data is calculated using 1-second bins in cleaned event files. If a bin has >2000 counts, and if more than 50% of those come from <1% of pixels, then it is considered to be noise-dominated and hence unusable.
| Quadrant | # 1 sec bins | Bins with >0 counts | Bins with >2000 counts | High rate bins dominated by noise | Noise dominated (total time) | Noise dominated (detector-on time) | Marked lightcurve |
|---|---|---|---|---|---|---|---|
| A | 7726 | 2829 | 0 | 0 | 0.00% | 0.00% | 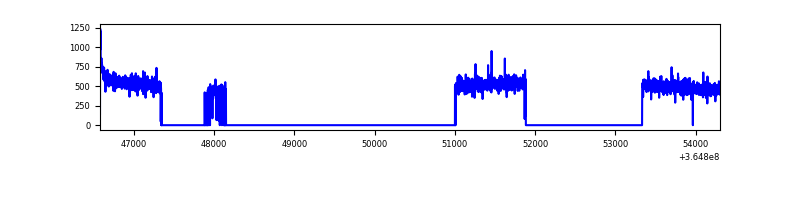 |
| B | 7725 | 2737 | 453 | 453 | 5.86% | 16.55% | 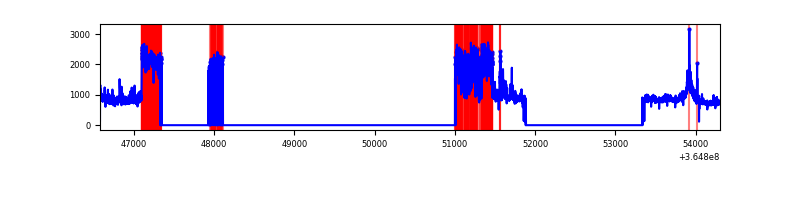 |
| C | 7725 | 2825 | 6 | 6 | 0.08% | 0.21% | 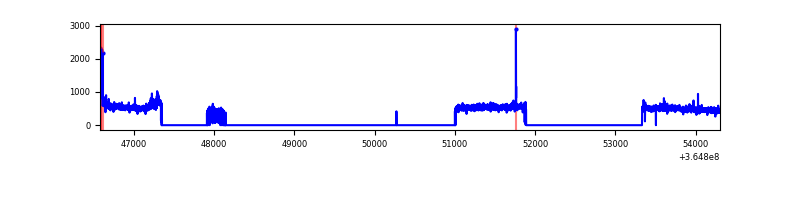 |
| D | 7725 | 2826 | 292 | 292 | 3.78% | 10.33% | 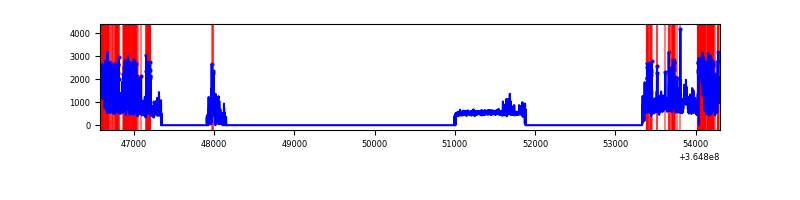 |
Top three noisy pixels from each quadrant. If the there are fewer than three noisy pixels in the level2.evt file, extra rows are filled as -1
| Pixel properties | Quadrant properties | ||||||
|---|---|---|---|---|---|---|---|
| Quadrant | DetID | PixID | Counts | Sigma | Mean | Median | Sigma |
| A | 0 | 13 | 9225 | 117.75 | 365 | 358 | 75.3 |
| A | 13 | 254 | 4971 | 61.26 | 365 | 358 | 75.3 |
| A | 3 | 137 | 3882 | 46.8 | 365 | 358 | 75.3 |
| B | 12 | 1 | 1459026 | 24399.49 | 297 | 288 | 59.8 |
| B | 6 | 159 | 641932 | 10732.42 | 297 | 288 | 59.8 |
| B | 4 | 80 | 38094 | 632.36 | 297 | 288 | 59.8 |
| C | 14 | 238 | 54900 | 658.18 | 344 | 345 | 82.9 |
| C | 3 | 233 | 43221 | 517.28 | 344 | 345 | 82.9 |
| C | 0 | 10 | 36616 | 437.59 | 344 | 345 | 82.9 |
| D | 12 | 218 | 781457 | 9751.57 | 328 | 318 | 80.1 |
| D | 8 | 195 | 200605 | 2500.34 | 328 | 318 | 80.1 |
| D | 13 | 249 | 190841 | 2378.45 | 328 | 318 | 80.1 |
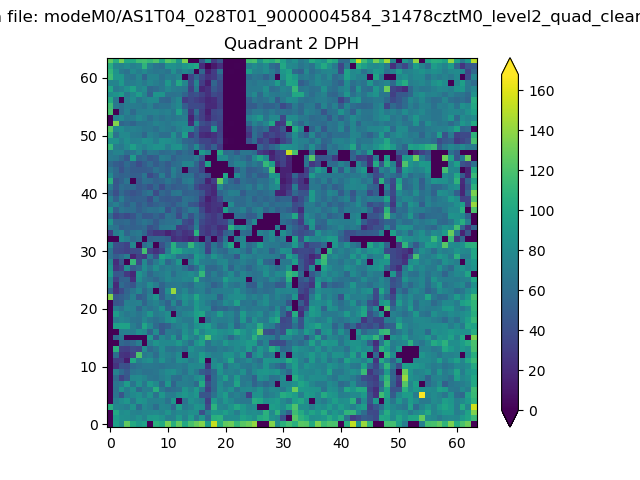
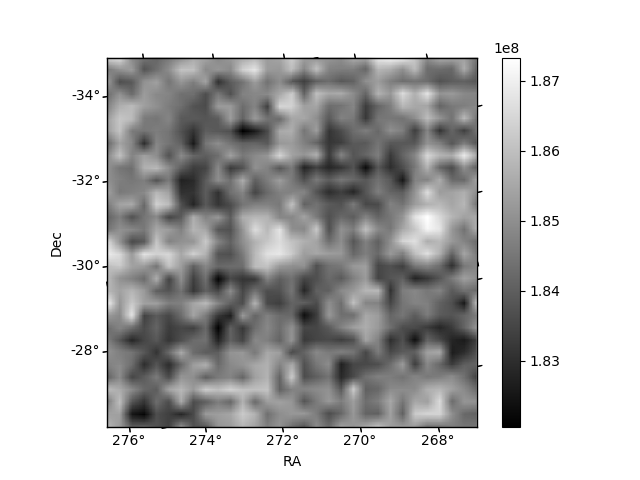
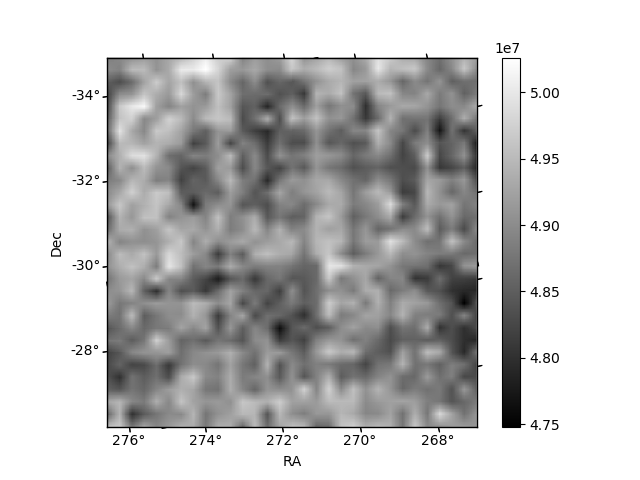
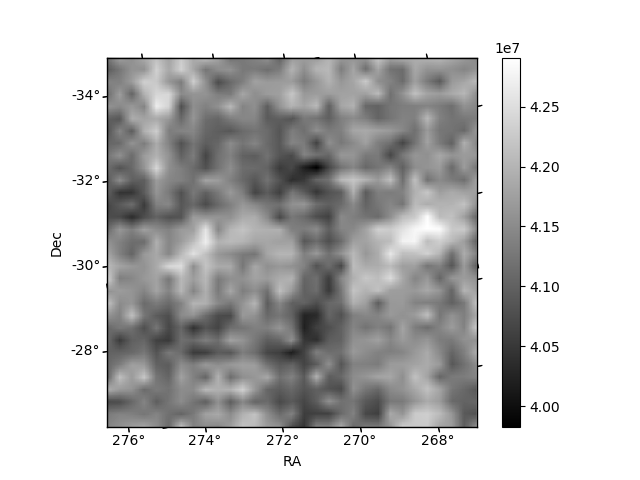
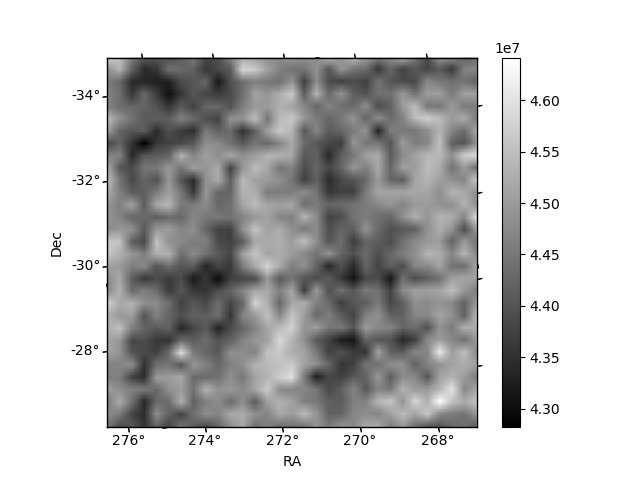
Histogram calculated using DETX and DETY for each event in the final _common_clean file
| Quadrant A | 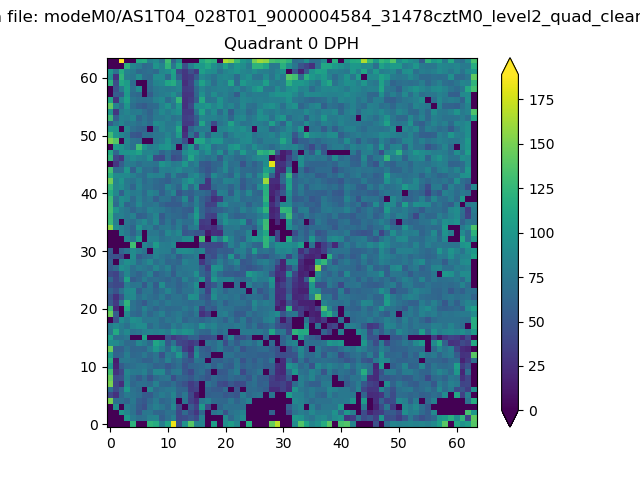 |
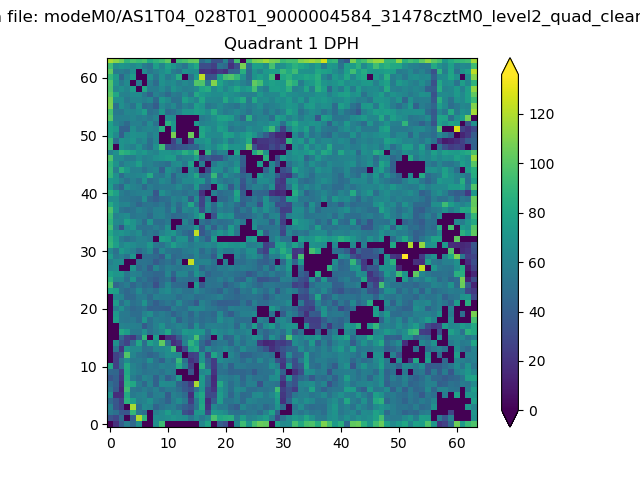 |
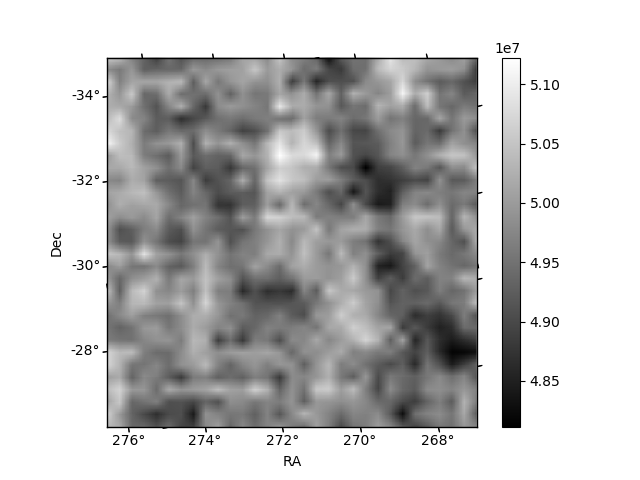
Quadrant B |
|---|---|---|---|
| Quadrant D | 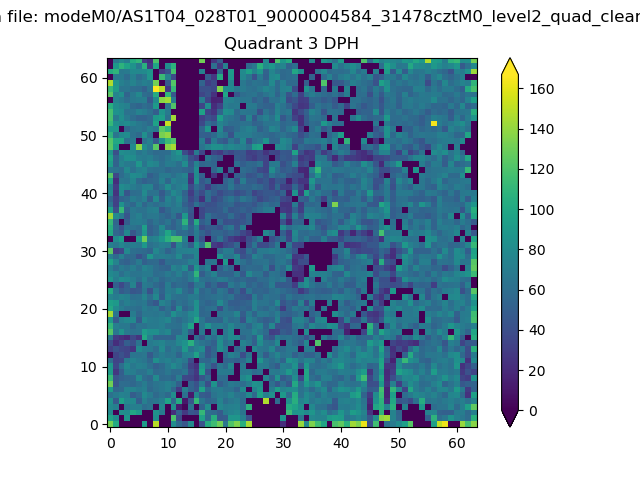 |
 |
Quadrant C |
| Plot type | Count rate plots | Images |
|---|---|---|
| Comparison with Poisson distribution Blue bars denote a histogram of data divided into 1 sec bins. Red curve is a Poisson curve with rate = median count rate of data. |
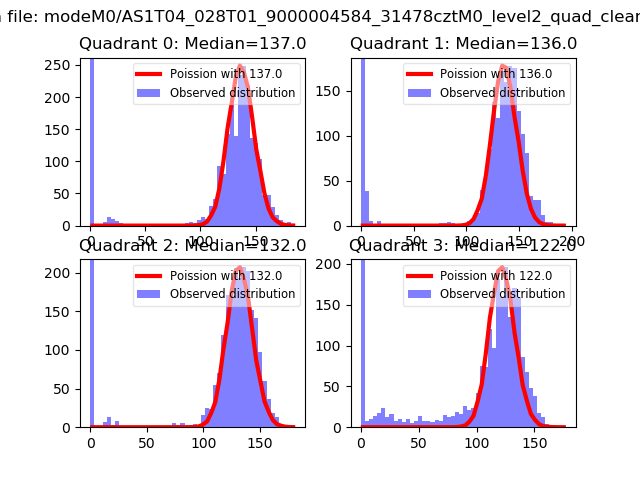 |
 |
| Quadrant-wise count rates Data is divided into 100 sec bins |
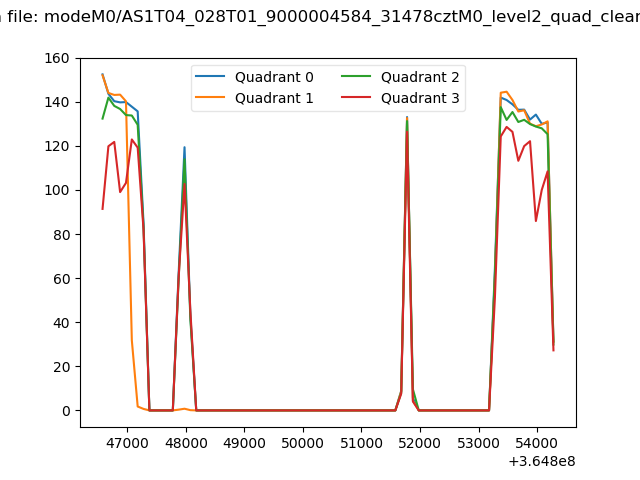 |
|
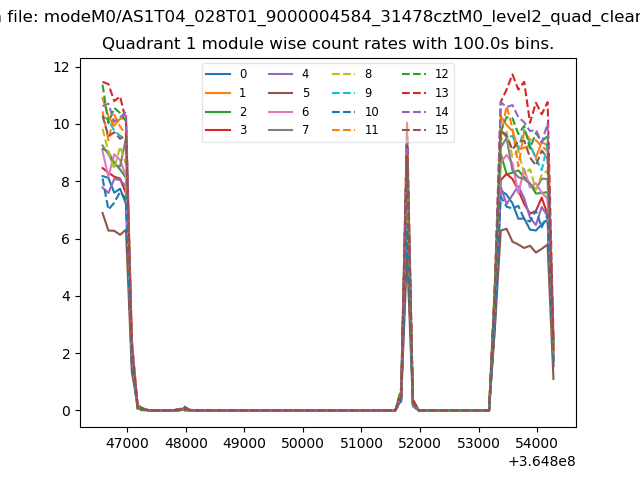
| Module-wise count rates for Quadrant A Data is divided into 100 sec bins |
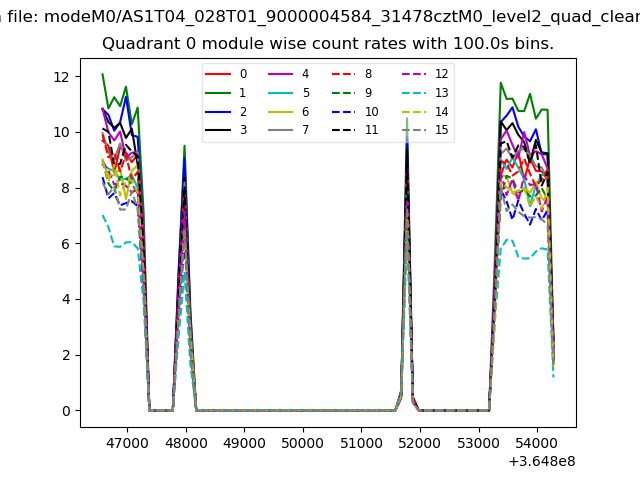 |
 |
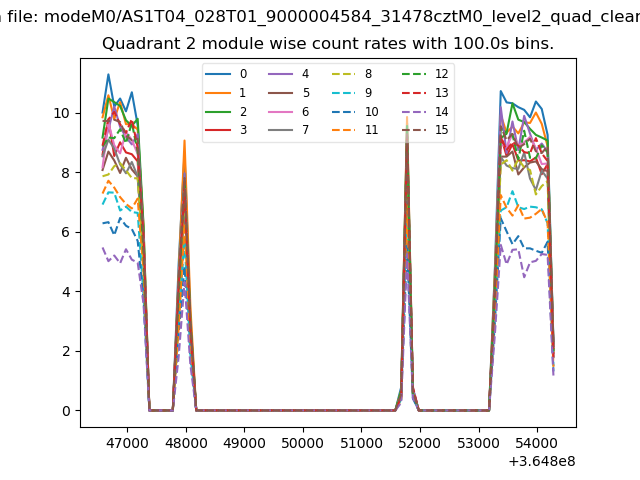
| Module-wise count rates for Quadrant B Data is divided into 100 sec bins |
 |
 |
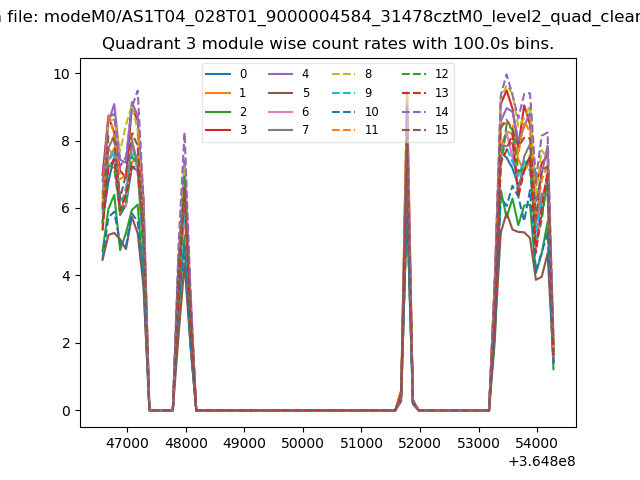
| Module-wise count rates for Quadrant C Data is divided into 100 sec bins |
 |
 |
| Module-wise count rates for Quadrant D Data is divided into 100 sec bins |
 |
 |
| Parameter | Plot |
|---|---|
| CZT HV Monitor | 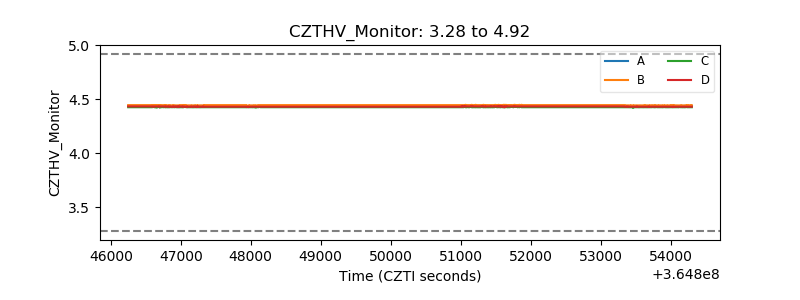 |
| D_VDD | 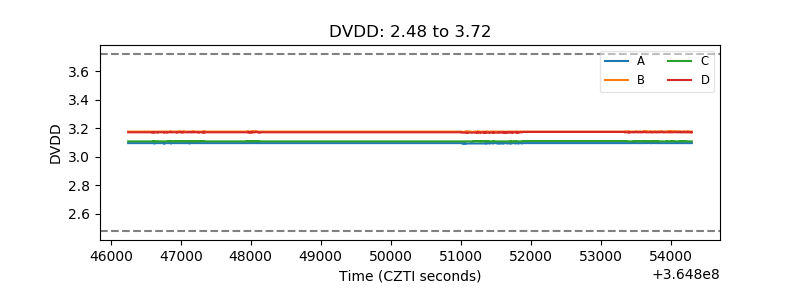 |
| Temperature 1 | 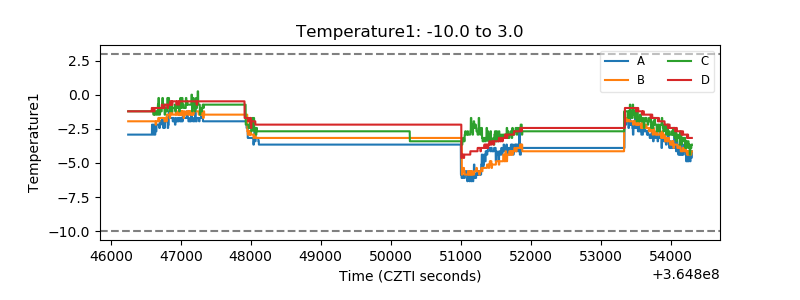 |
| Veto HV Monitor | 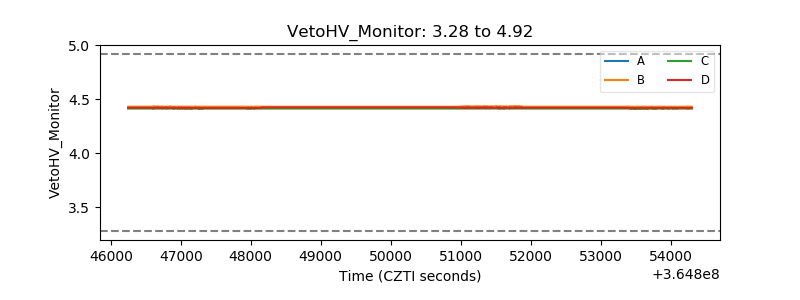 |
| Veto LLD | 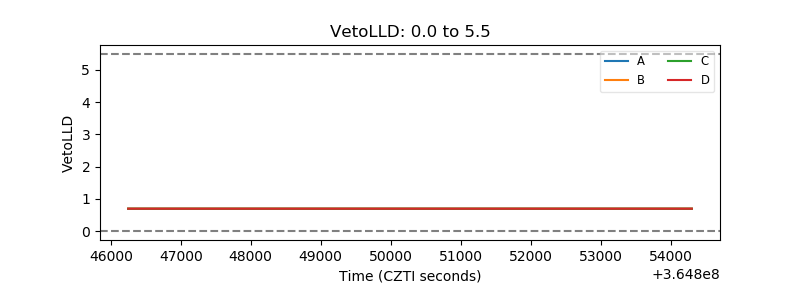 |
| Alpha Counter | 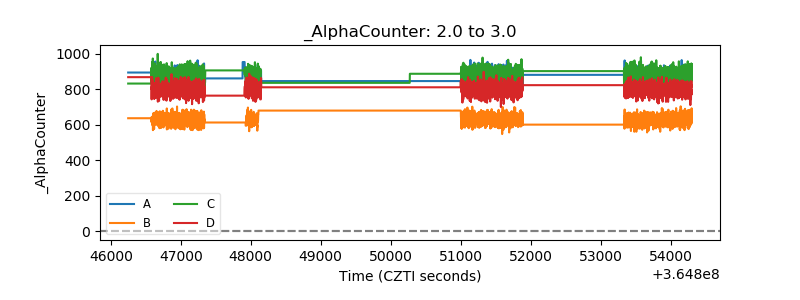 |
| _CPM_Rate | 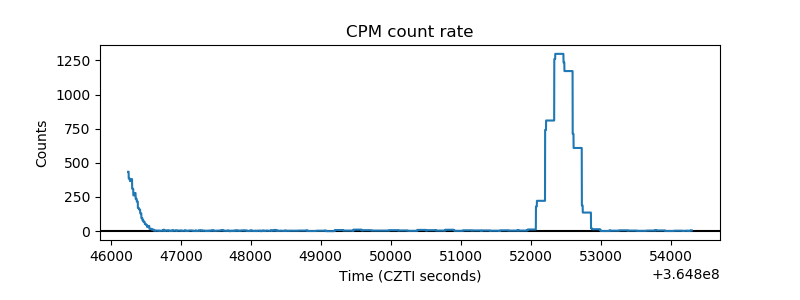 |
| CZT Counter | 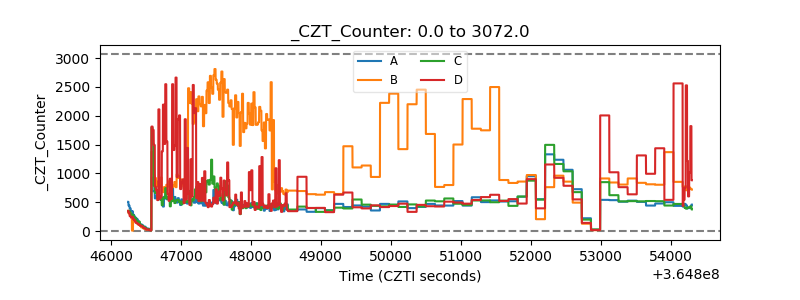 |
| +2.5 Volts monitor |  |
| +5 Volts monitor |  |
| _ROLL_ROT | 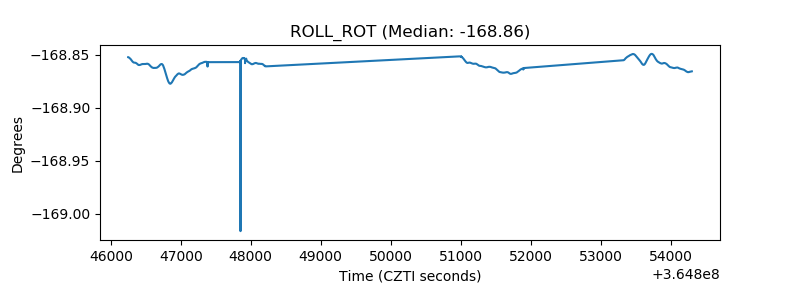 |
| _Roll_DEC | 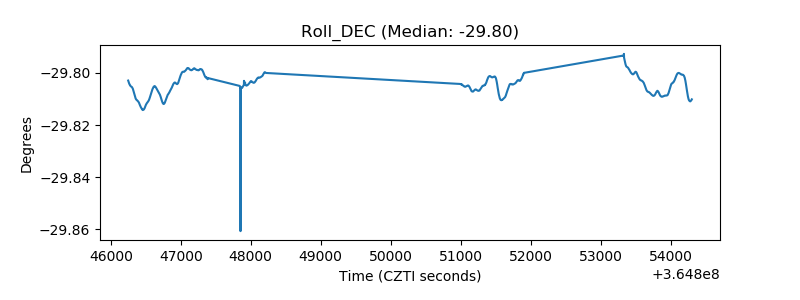 |
| _Roll_RA | 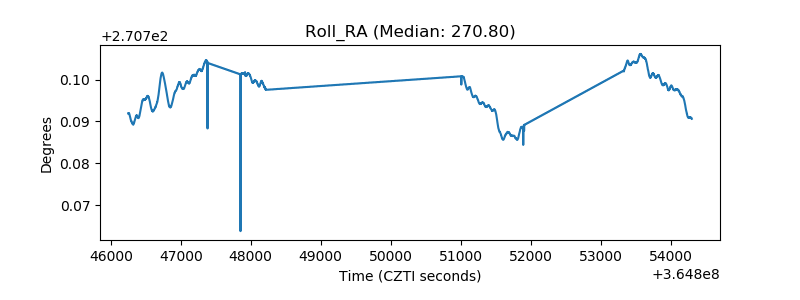 |
| Veto Counter | 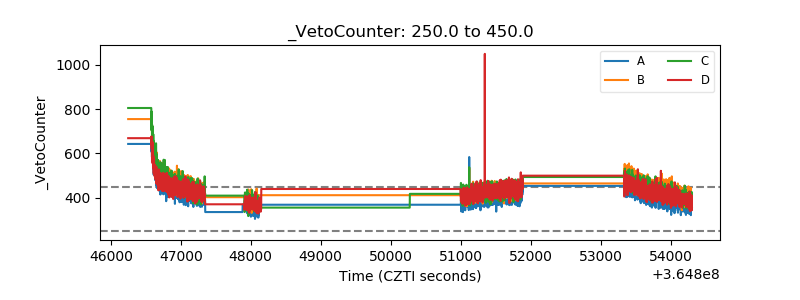 |