| Param | Original file | Final file |
|---|---|---|
| Filename | modeM0/AS1T04_028T01_9000004584_31481cztM0_level2.evt | modeM0/AS1T04_028T01_9000004584_31481cztM0_level2_quad_clean.evt |
| Size (bytes) | 1,477,031,040 | 201,142,080 |
| Size | 1.4 GB | 191.8 MB |
| Events in quadrant A | 7,779,094 | 1,328,445 |
| Events in quadrant B | 16,970,759 | 1,162,716 |
| Events in quadrant C | 8,769,693 | 1,262,824 |
| Events in quadrant D | 10,117,612 | 1,216,758 |
| Mode SS | |||
|---|---|---|---|
| Quadrant | BADHDUFLAG | Total packets | Discarded packets |
| A | 0 | 330 | 0 |
| B | 0 | 330 | 0 |
| C | 0 | 330 | 0 |
| D | 0 | 330 | 0 |
| Mode M0 | |||
|---|---|---|---|
| Quadrant | BADHDUFLAG | Total packets | Discarded packets |
| A | 0 | 33658 | 3 |
| B | 0 | 61963 | 3 |
| C | 0 | 36403 | 3 |
| D | 0 | 41007 | 3 |
| Mode M9 | |||
|---|---|---|---|
| Quadrant | BADHDUFLAG | Total packets | Discarded packets |
| A | 0 | 33 | 0 |
| B | 0 | 33 | 0 |
| C | 0 | 33 | 0 |
| D | 0 | 33 | 0 |
| Quadrant | Total seconds | Saturated seconds | Saturation percentage |
|---|---|---|---|
| A | 16245 | 77 | 0.473992% |
| B | 16246 | 2616 | 16.102425% |
| C | 16246 | 403 | 2.480611% |
| D | 16246 | 350 | 2.154376% |
Noise dominated data is calculated using 1-second bins in cleaned event files. If a bin has >2000 counts, and if more than 50% of those come from <1% of pixels, then it is considered to be noise-dominated and hence unusable.
| Quadrant | # 1 sec bins | Bins with >0 counts | Bins with >2000 counts | High rate bins dominated by noise | Noise dominated (total time) | Noise dominated (detector-on time) | Marked lightcurve |
|---|---|---|---|---|---|---|---|
| A | 19485 | 16247 | 2 | 2 | 0.01% | 0.01% | 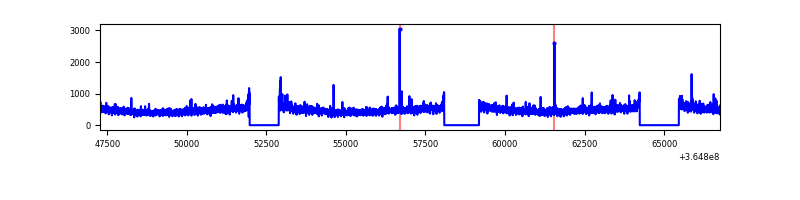 |
| B | 19486 | 16247 | 1872 | 1872 | 9.61% | 11.52% | 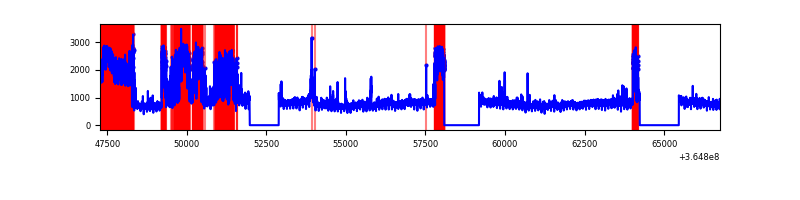 |
| C | 19486 | 16248 | 200 | 200 | 1.03% | 1.23% | 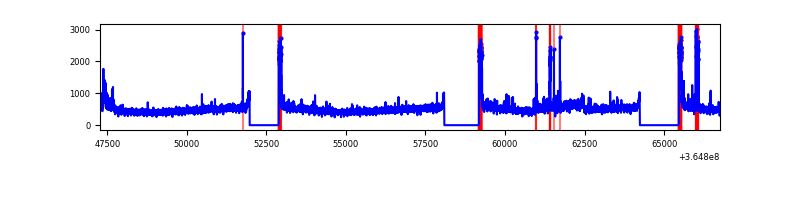 |
| D | 19486 | 16247 | 293 | 293 | 1.50% | 1.80% | 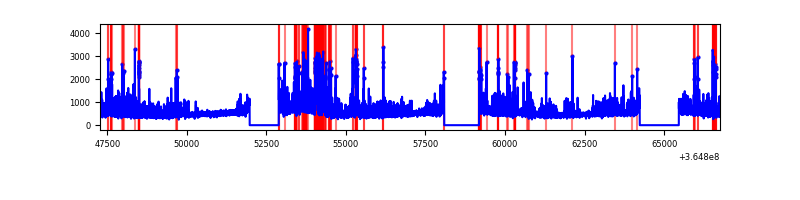 |
Top three noisy pixels from each quadrant. If the there are fewer than three noisy pixels in the level2.evt file, extra rows are filled as -1
| Pixel properties | Quadrant properties | ||||||
|---|---|---|---|---|---|---|---|
| Quadrant | DetID | PixID | Counts | Sigma | Mean | Median | Sigma |
| A | 0 | 13 | 96424 | 237.27 | 1990 | 1952 | 398.2 |
| A | 13 | 254 | 30131 | 70.77 | 1990 | 1952 | 398.2 |
| A | 3 | 137 | 20423 | 46.39 | 1990 | 1952 | 398.2 |
| B | 12 | 1 | 5498152 | 16024.1 | 1796 | 1751 | 343.0 |
| B | 6 | 159 | 4147610 | 12086.76 | 1796 | 1751 | 343.0 |
| B | 4 | 80 | 112907 | 324.06 | 1796 | 1751 | 343.0 |
| C | 0 | 10 | 646345 | 1447.43 | 1891 | 1903 | 445.2 |
| C | 3 | 233 | 387255 | 865.51 | 1891 | 1903 | 445.2 |
| C | 14 | 238 | 304293 | 679.18 | 1891 | 1903 | 445.2 |
| D | 8 | 195 | 1389070 | 3047.62 | 1895 | 1845 | 455.2 |
| D | 12 | 218 | 743409 | 1629.16 | 1895 | 1845 | 455.2 |
| D | 13 | 249 | 340870 | 744.81 | 1895 | 1845 | 455.2 |
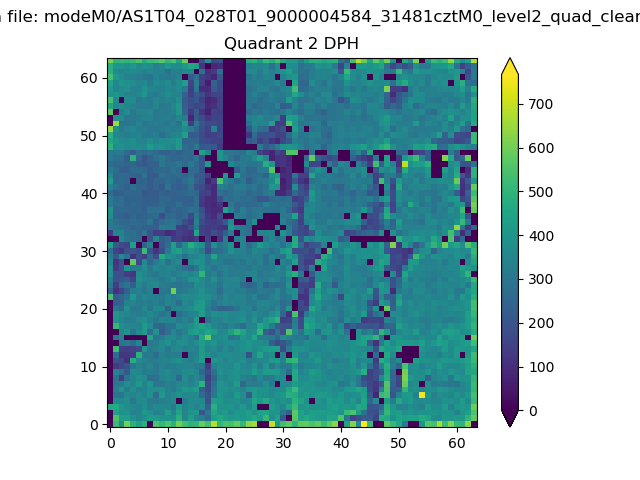
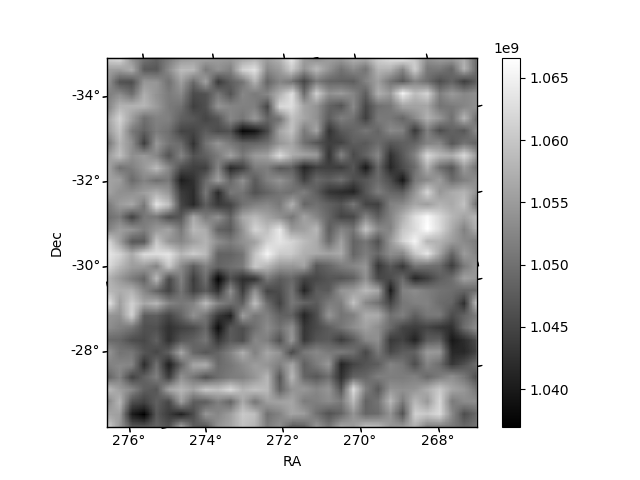
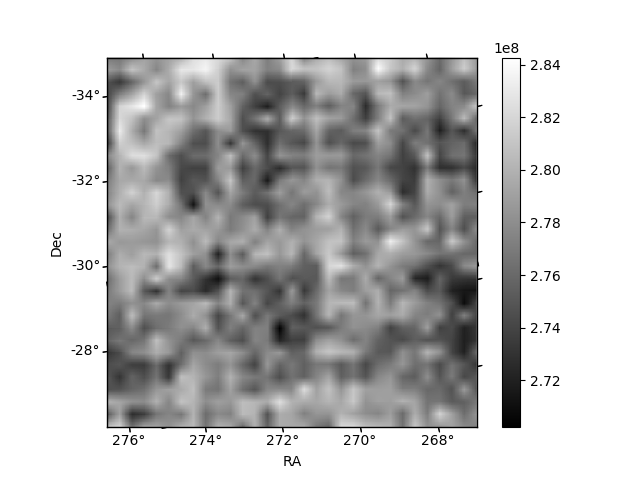
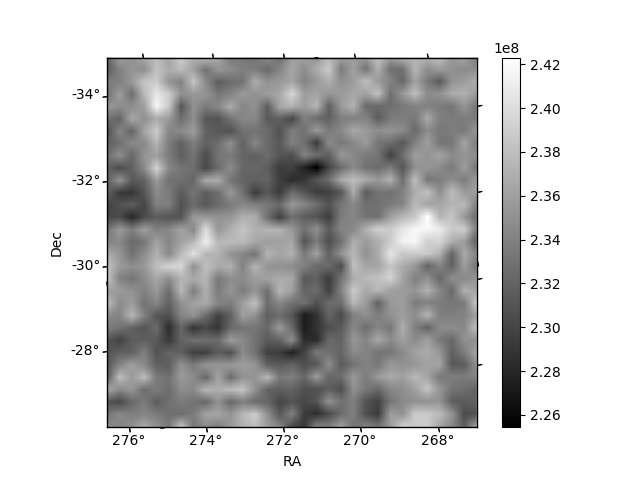
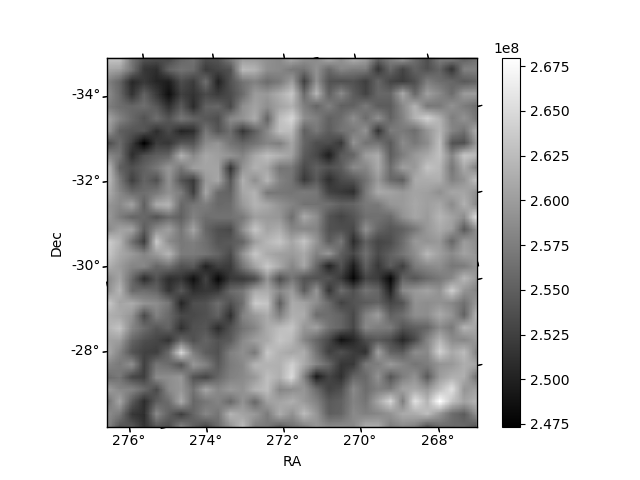
Histogram calculated using DETX and DETY for each event in the final _common_clean file
| Quadrant A | 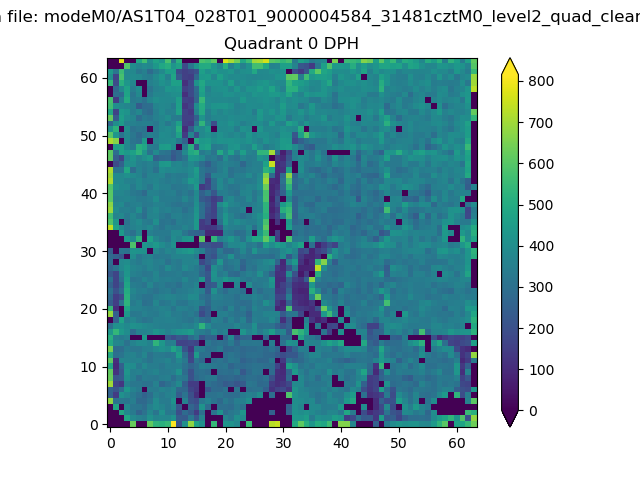 |
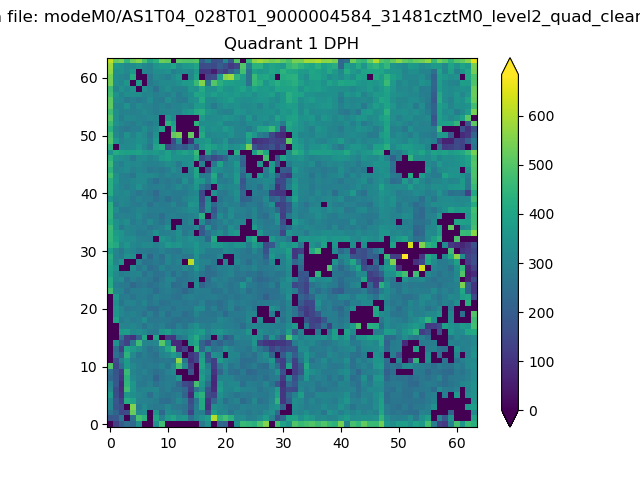 |
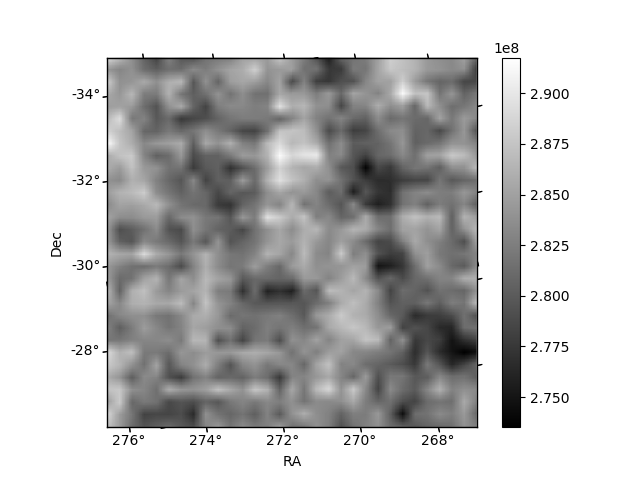
Quadrant B |
|---|---|---|---|
| Quadrant D | 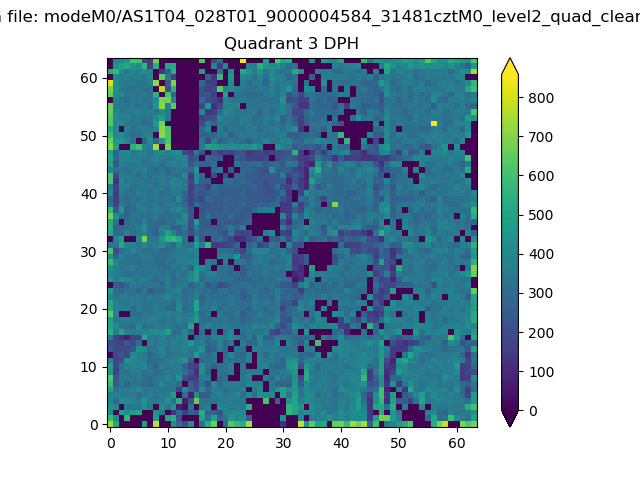 |
 |
Quadrant C |
| Plot type | Count rate plots | Images |
|---|---|---|
| Comparison with Poisson distribution Blue bars denote a histogram of data divided into 1 sec bins. Red curve is a Poisson curve with rate = median count rate of data. |
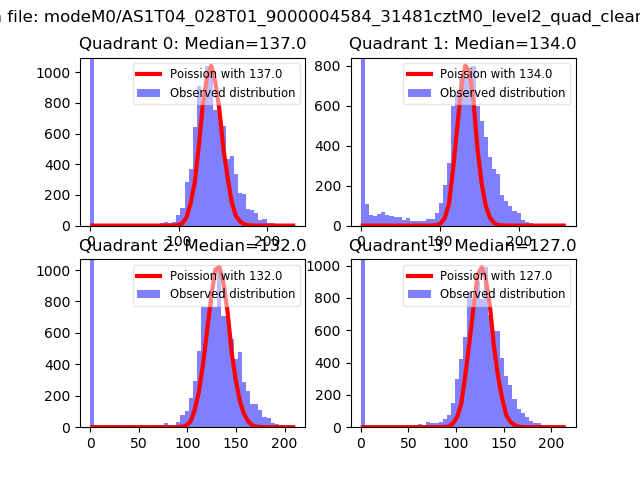 |
 |
| Quadrant-wise count rates Data is divided into 100 sec bins |
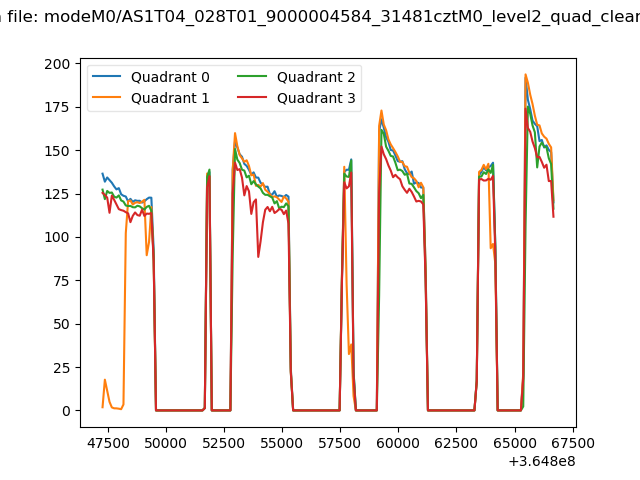 |
|
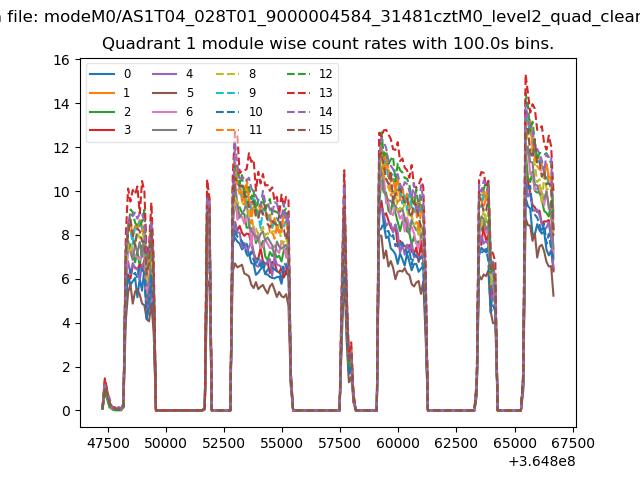
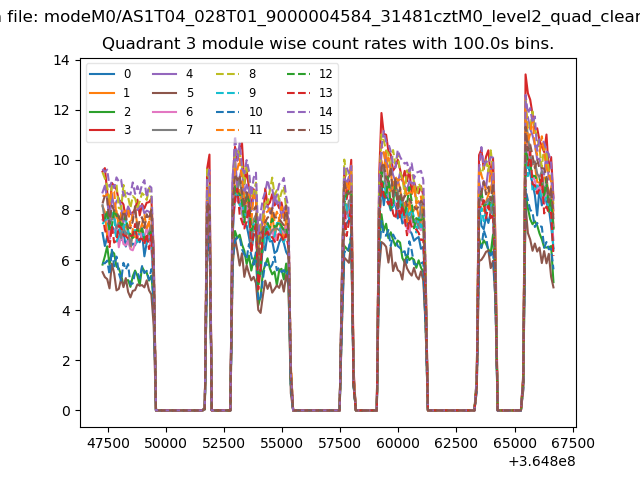
| Module-wise count rates for Quadrant A Data is divided into 100 sec bins |
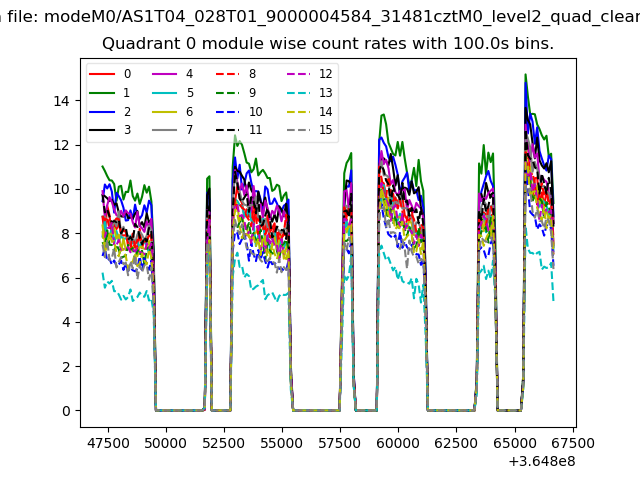 |
 |
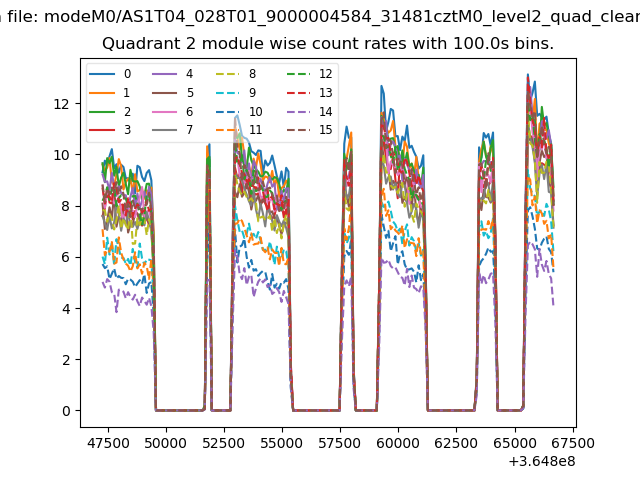
| Module-wise count rates for Quadrant B Data is divided into 100 sec bins |
 |
 |
| Module-wise count rates for Quadrant C Data is divided into 100 sec bins |
 |
 |
| Module-wise count rates for Quadrant D Data is divided into 100 sec bins |
 |
 |
| Parameter | Plot |
|---|---|
| CZT HV Monitor | 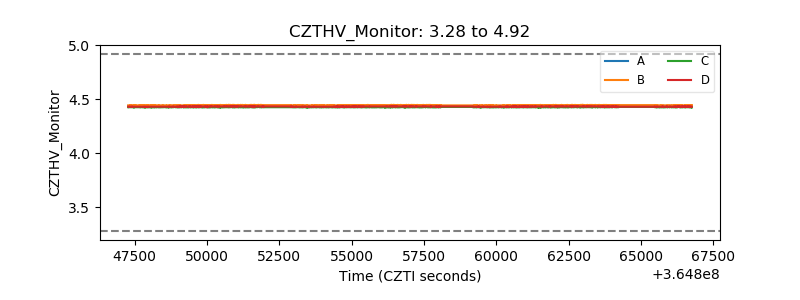 |
| D_VDD | 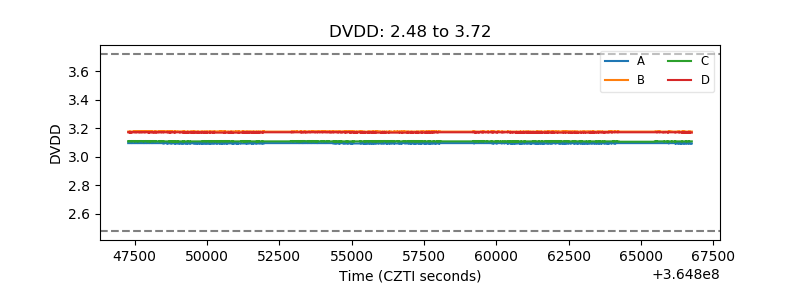 |
| Temperature 1 | 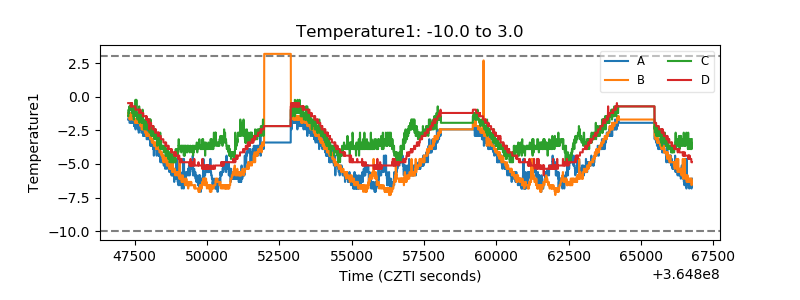 |
| Veto HV Monitor | 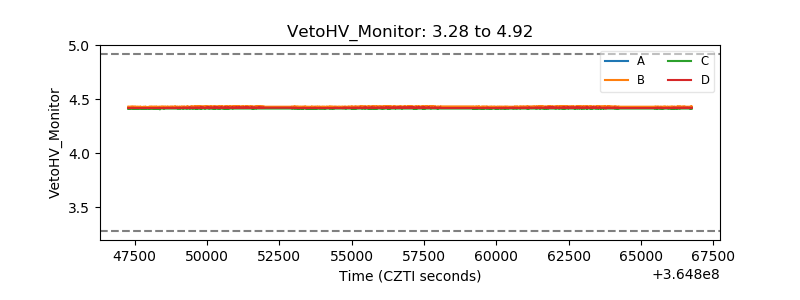 |
| Veto LLD | 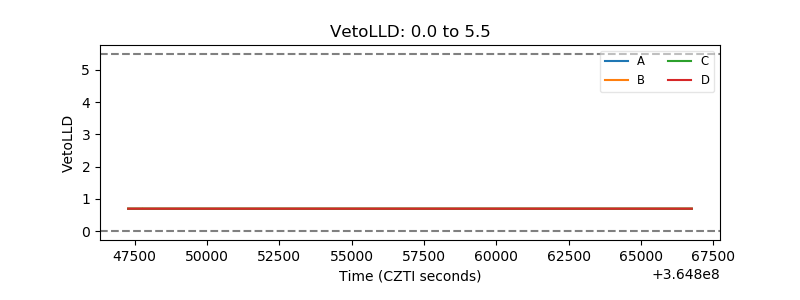 |
| Alpha Counter | 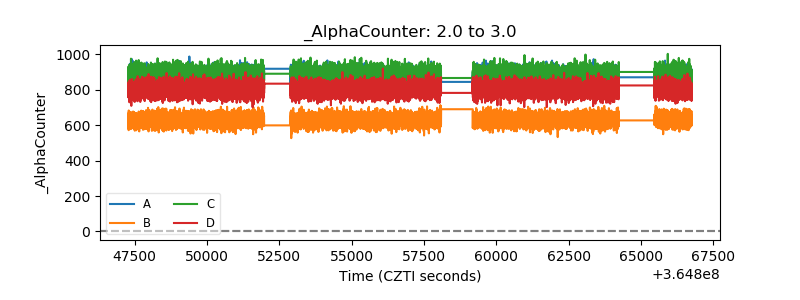 |
| _CPM_Rate | 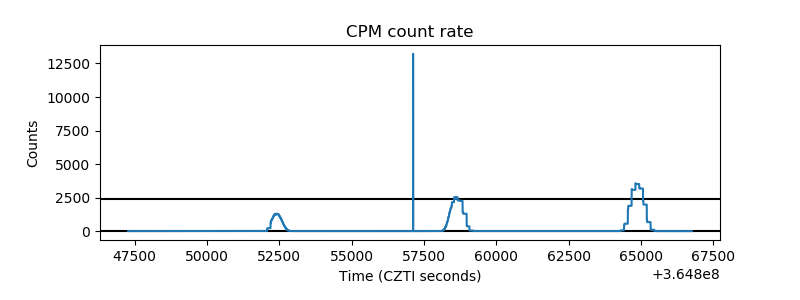 |
| CZT Counter | 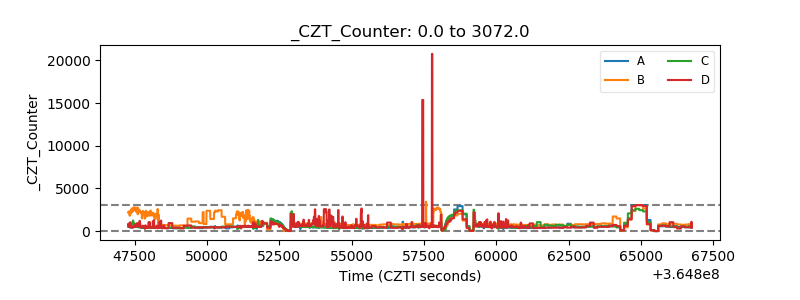 |
| +2.5 Volts monitor | 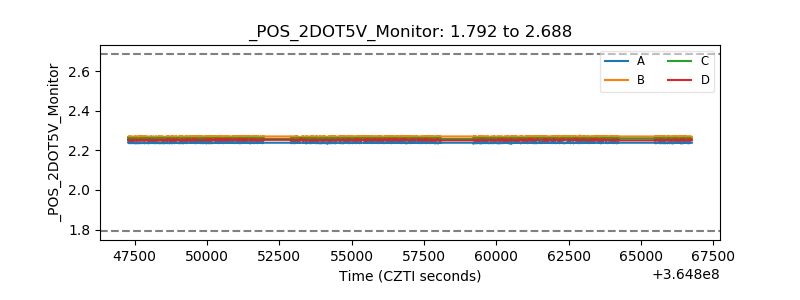 |
| +5 Volts monitor |  |
| _ROLL_ROT | 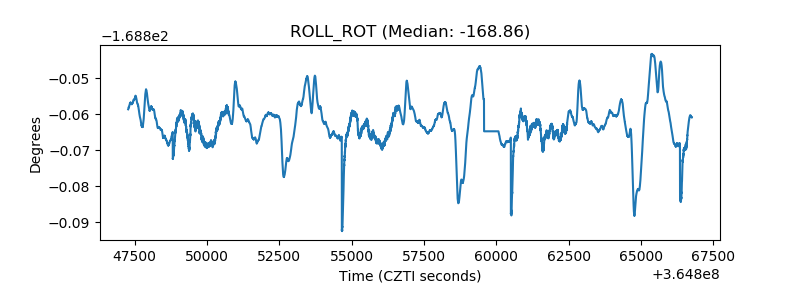 |
| _Roll_DEC | 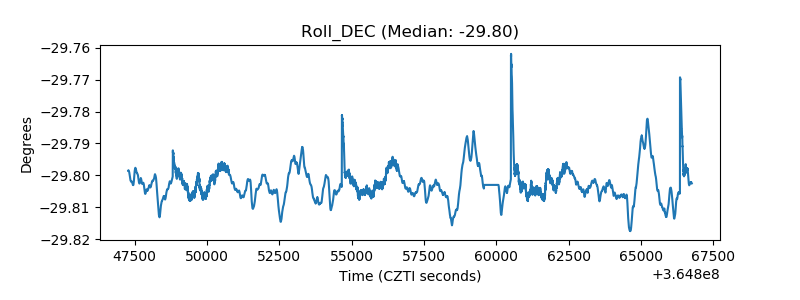 |
| _Roll_RA | 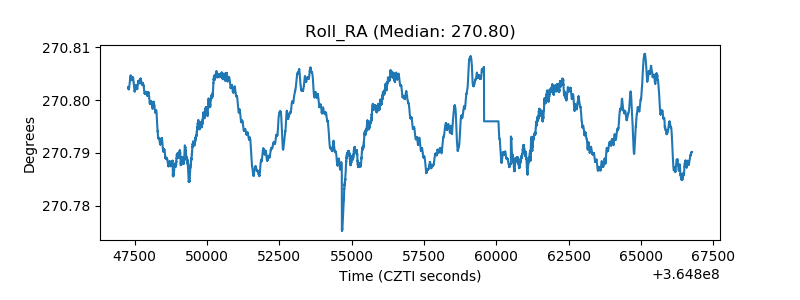 |
| Veto Counter | 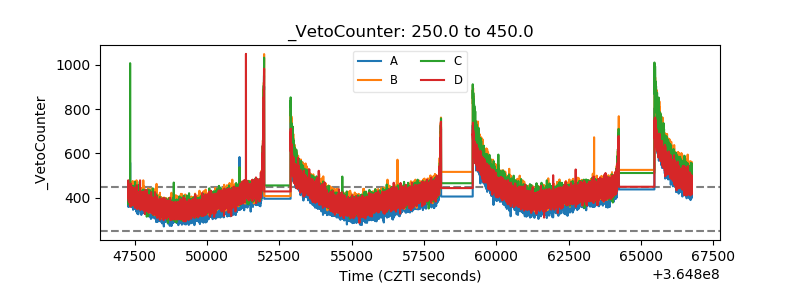 |