| Param | Original file | Final file |
|---|---|---|
| Filename | modeM0/AS1T04_028T01_9000004584_31482cztM0_level2.evt | modeM0/AS1T04_028T01_9000004584_31482cztM0_level2_quad_clean.evt |
| Size (bytes) | 551,816,640 | 94,040,640 |
| Size | 526.3 MB | 89.7 MB |
| Events in quadrant A | 3,182,787 | 627,028 |
| Events in quadrant B | 5,448,759 | 627,595 |
| Events in quadrant C | 3,682,715 | 585,946 |
| Events in quadrant D | 3,976,896 | 573,399 |
| Mode SS | |||
|---|---|---|---|
| Quadrant | BADHDUFLAG | Total packets | Discarded packets |
| A | 0 | 126 | 0 |
| B | 0 | 126 | 0 |
| C | 0 | 126 | 0 |
| D | 0 | 126 | 0 |
| Mode M0 | |||
|---|---|---|---|
| Quadrant | BADHDUFLAG | Total packets | Discarded packets |
| A | 0 | 13195 | 2 |
| B | 0 | 20355 | 3 |
| C | 0 | 14609 | 2 |
| D | 0 | 15945 | 2 |
| Mode M9 | |||
|---|---|---|---|
| Quadrant | BADHDUFLAG | Total packets | Discarded packets |
| A | 0 | 21 | 0 |
| B | 0 | 22 | 0 |
| C | 0 | 22 | 0 |
| D | 0 | 22 | 0 |
| Quadrant | Total seconds | Saturated seconds | Saturation percentage |
|---|---|---|---|
| A | 6217 | 22 | 0.353868% |
| B | 6216 | 294 | 4.729730% |
| C | 6216 | 263 | 4.231017% |
| D | 6216 | 95 | 1.528314% |
Noise dominated data is calculated using 1-second bins in cleaned event files. If a bin has >2000 counts, and if more than 50% of those come from <1% of pixels, then it is considered to be noise-dominated and hence unusable.
| Quadrant | # 1 sec bins | Bins with >0 counts | Bins with >2000 counts | High rate bins dominated by noise | Noise dominated (total time) | Noise dominated (detector-on time) | Marked lightcurve |
|---|---|---|---|---|---|---|---|
| A | 7512 | 6218 | 0 | 0 | 0.00% | 0.00% | 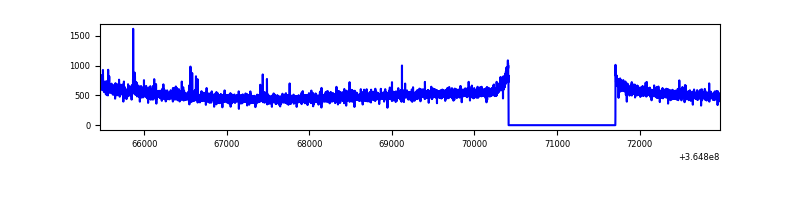 |
| B | 7510 | 6215 | 200 | 200 | 2.66% | 3.22% | 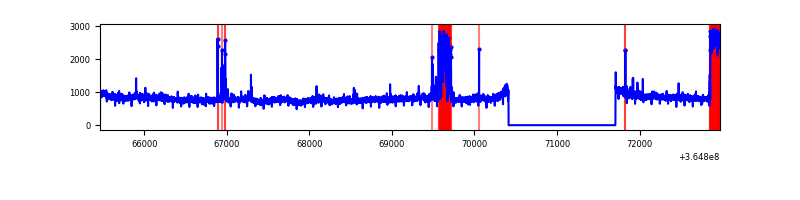 |
| C | 7511 | 6217 | 172 | 172 | 2.29% | 2.77% | 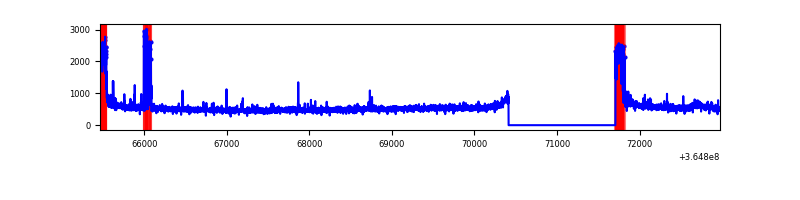 |
| D | 7511 | 6216 | 79 | 79 | 1.05% | 1.27% | 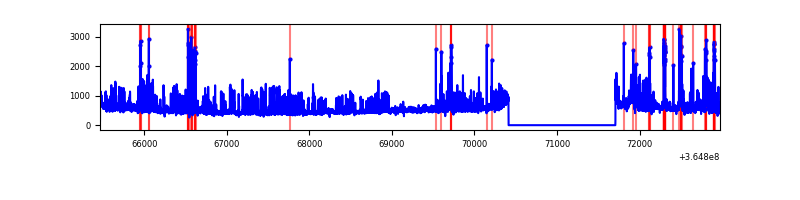 |
Top three noisy pixels from each quadrant. If the there are fewer than three noisy pixels in the level2.evt file, extra rows are filled as -1
| Pixel properties | Quadrant properties | ||||||
|---|---|---|---|---|---|---|---|
| Quadrant | DetID | PixID | Counts | Sigma | Mean | Median | Sigma |
| A | 0 | 13 | 32952 | 197.6 | 817 | 802 | 162.7 |
| A | 13 | 254 | 11148 | 63.59 | 817 | 802 | 162.7 |
| A | 3 | 137 | 7864 | 43.4 | 817 | 802 | 162.7 |
| B | 6 | 159 | 1662713 | 10971.0 | 803 | 783 | 151.5 |
| B | 12 | 1 | 537569 | 3543.52 | 803 | 783 | 151.5 |
| B | 4 | 80 | 28407 | 182.36 | 803 | 783 | 151.5 |
| C | 0 | 10 | 486130 | 2694.79 | 769 | 776 | 180.1 |
| C | 14 | 238 | 126363 | 697.29 | 769 | 776 | 180.1 |
| C | 3 | 233 | 46782 | 255.44 | 769 | 776 | 180.1 |
| D | 8 | 195 | 596376 | 3235.98 | 775 | 756 | 184.1 |
| D | 12 | 218 | 215924 | 1169.0 | 775 | 756 | 184.1 |
| D | 13 | 249 | 111394 | 601.09 | 775 | 756 | 184.1 |
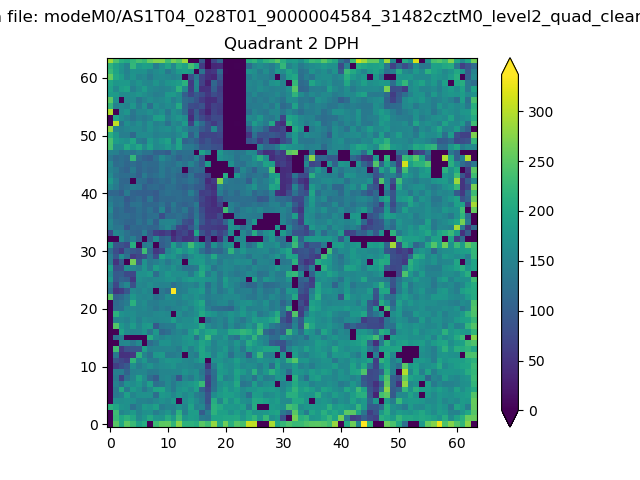
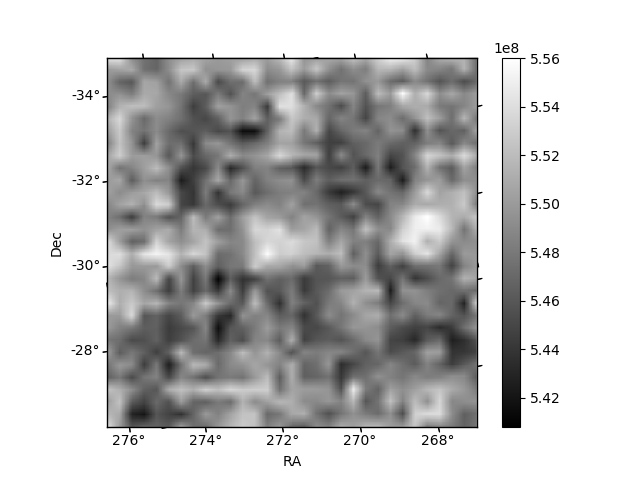
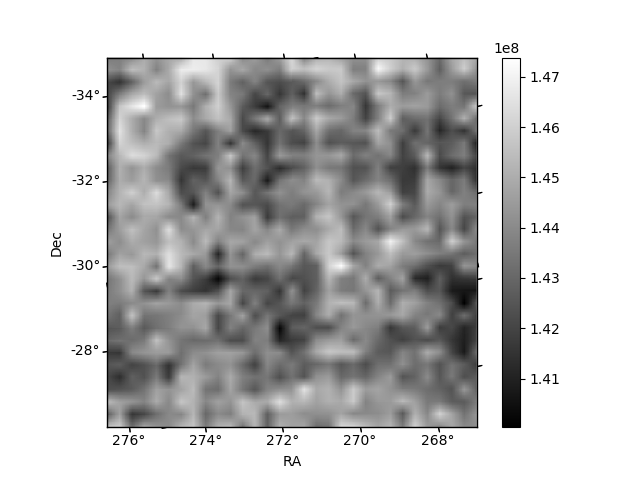
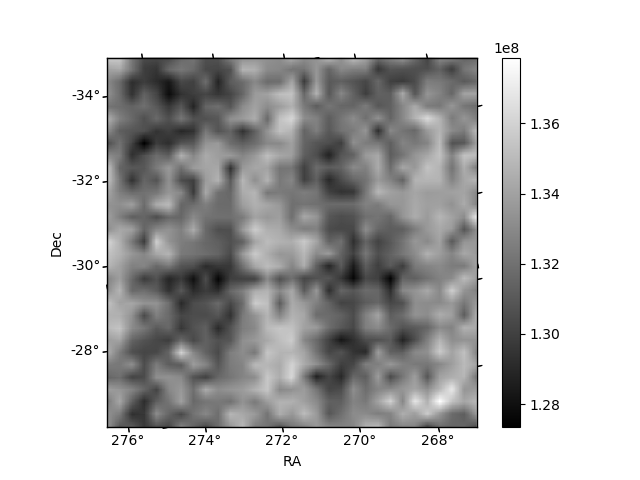
Histogram calculated using DETX and DETY for each event in the final _common_clean file
| Quadrant A | 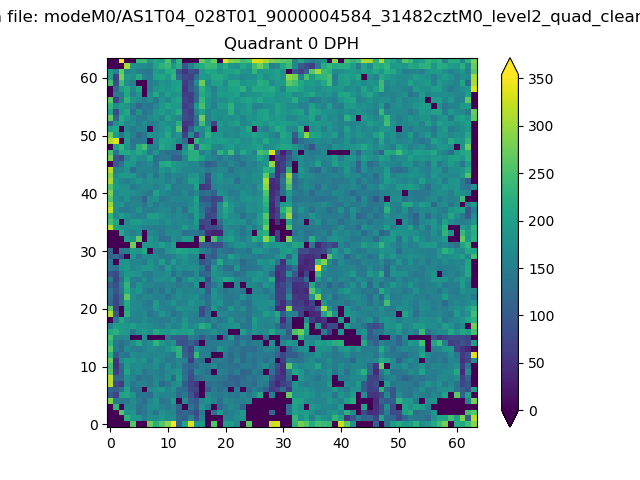 |
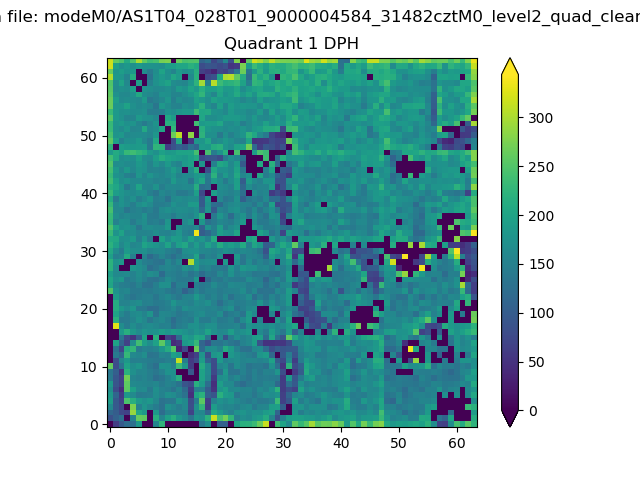 |
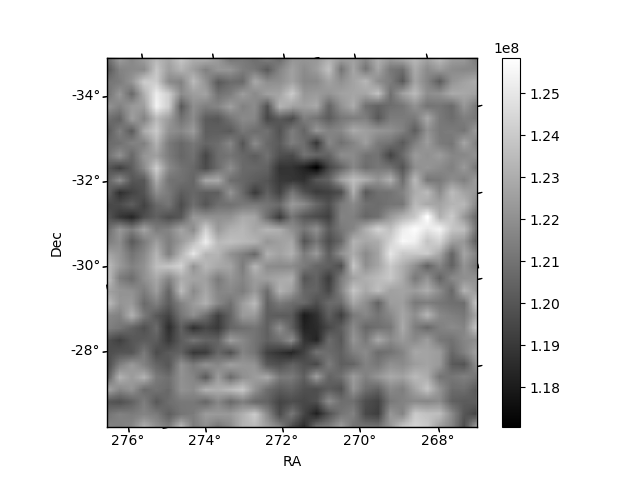
Quadrant B |
|---|---|---|---|
| Quadrant D | 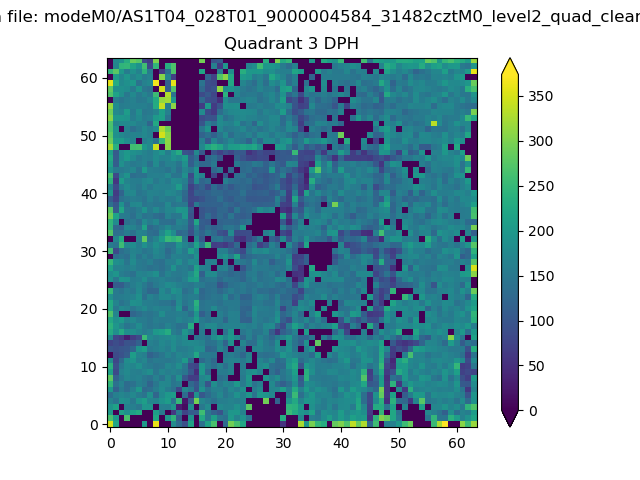 |
 |
Quadrant C |
| Plot type | Count rate plots | Images |
|---|---|---|
| Comparison with Poisson distribution Blue bars denote a histogram of data divided into 1 sec bins. Red curve is a Poisson curve with rate = median count rate of data. |
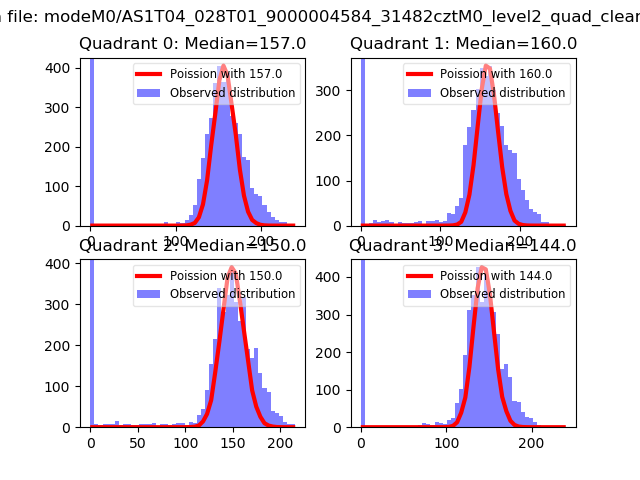 |
 |
| Quadrant-wise count rates Data is divided into 100 sec bins |
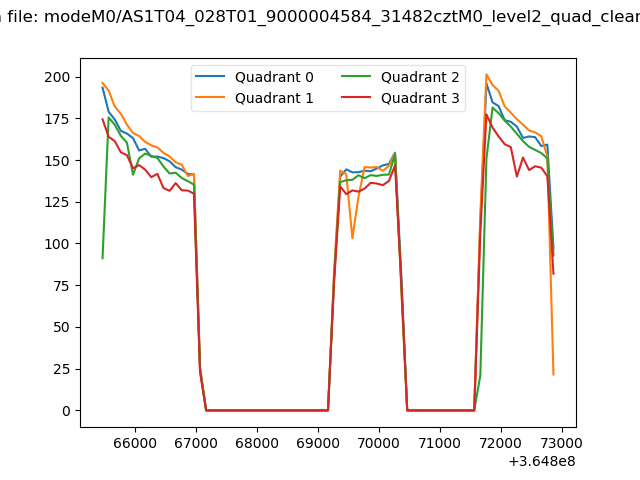 |
|
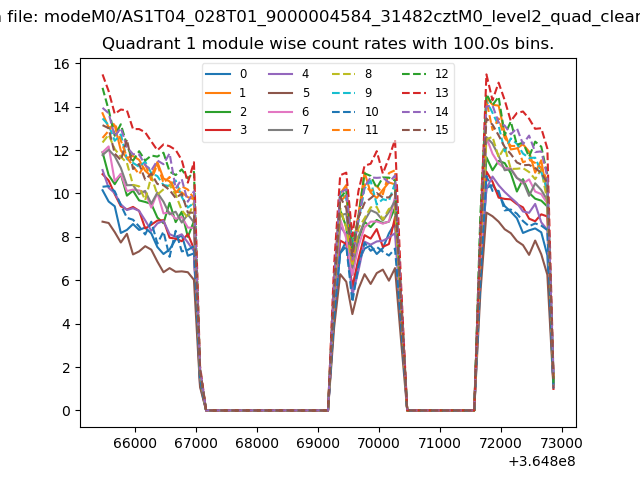
| Module-wise count rates for Quadrant A Data is divided into 100 sec bins |
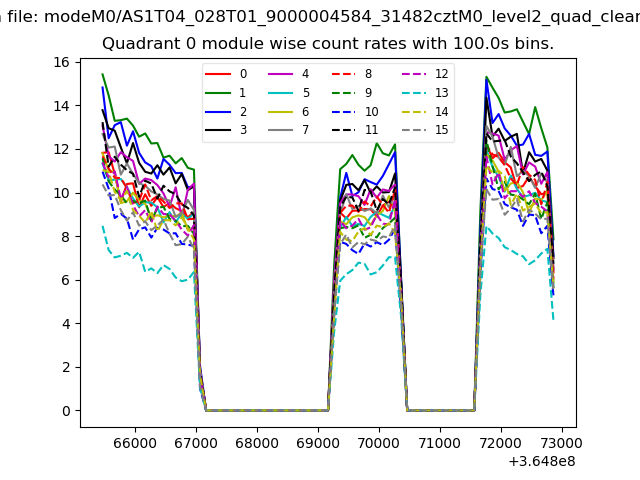 |
 |
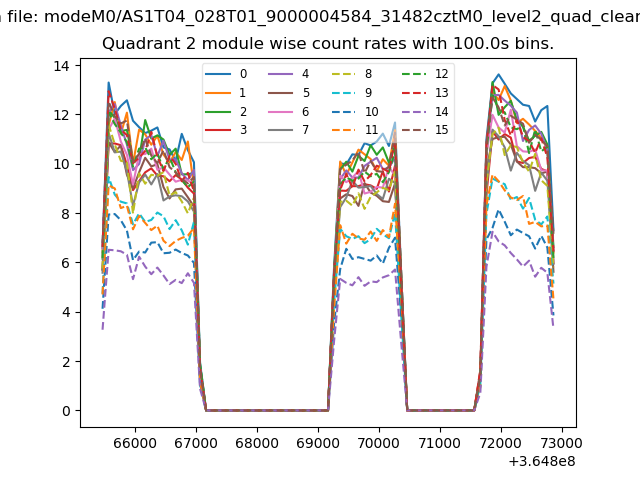
| Module-wise count rates for Quadrant B Data is divided into 100 sec bins |
 |
 |
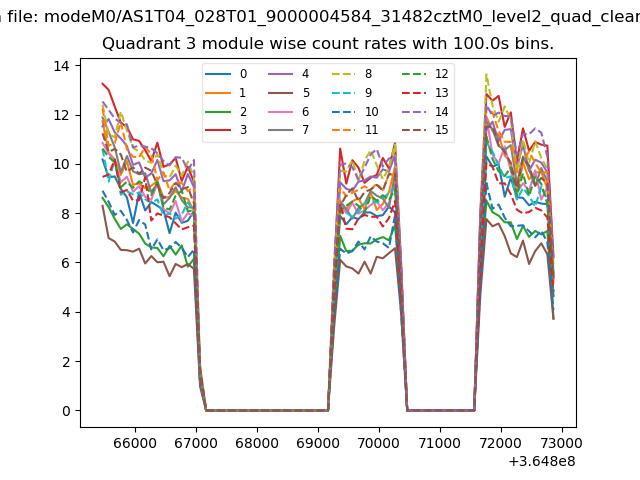
| Module-wise count rates for Quadrant C Data is divided into 100 sec bins |
 |
 |
| Module-wise count rates for Quadrant D Data is divided into 100 sec bins |
 |
 |
| Parameter | Plot |
|---|---|
| CZT HV Monitor | 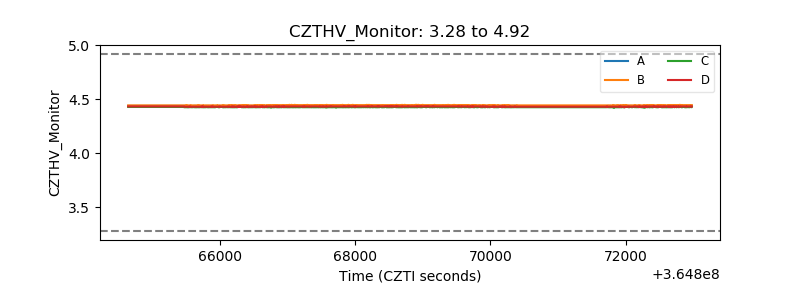 |
| D_VDD | 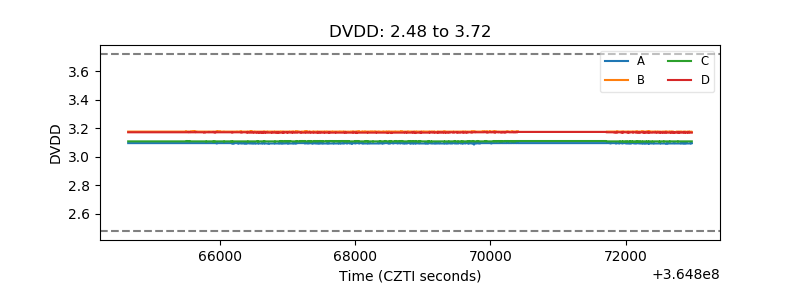 |
| Temperature 1 | 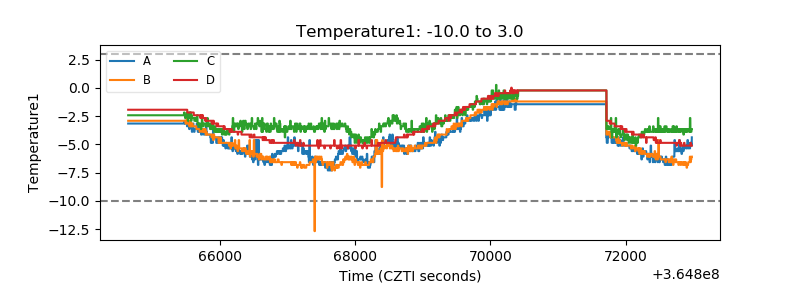 |
| Veto HV Monitor | 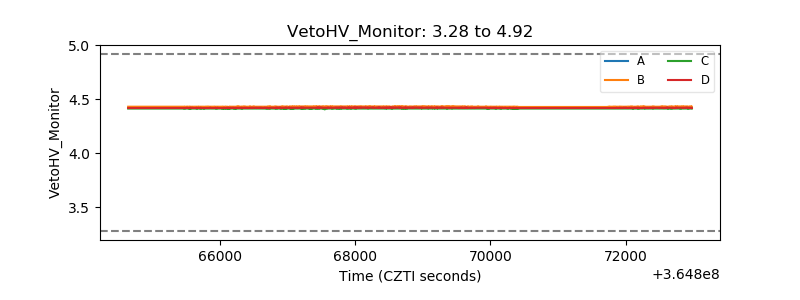 |
| Veto LLD | 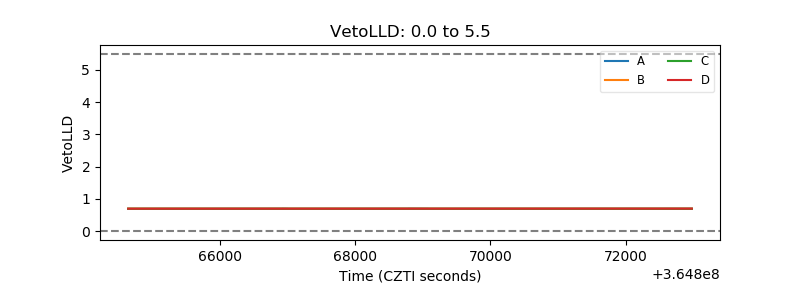 |
| Alpha Counter | 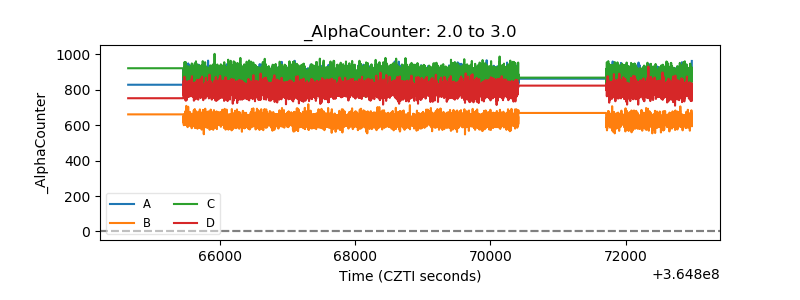 |
| _CPM_Rate | 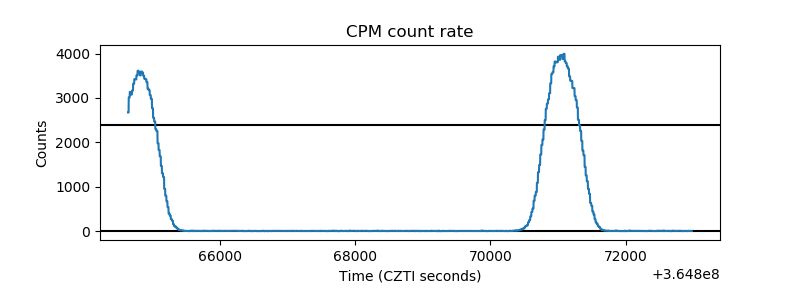 |
| CZT Counter | 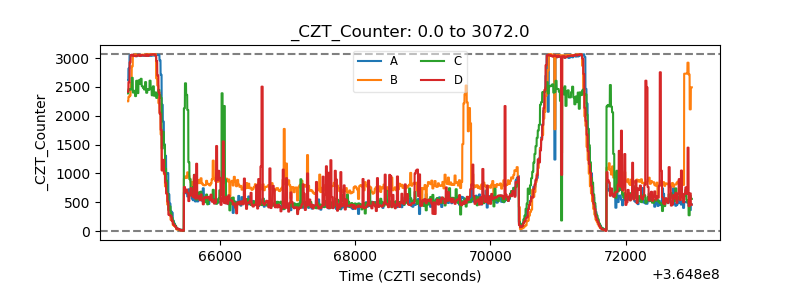 |
| +2.5 Volts monitor |  |
| +5 Volts monitor |  |
| _ROLL_ROT | 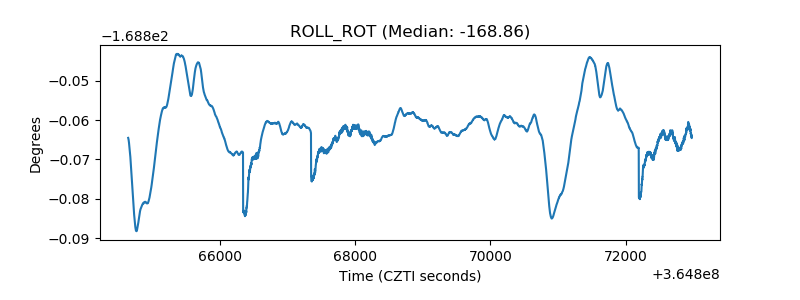 |
| _Roll_DEC | 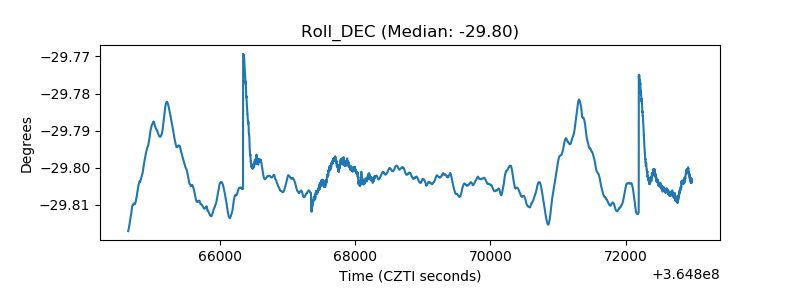 |
| _Roll_RA | 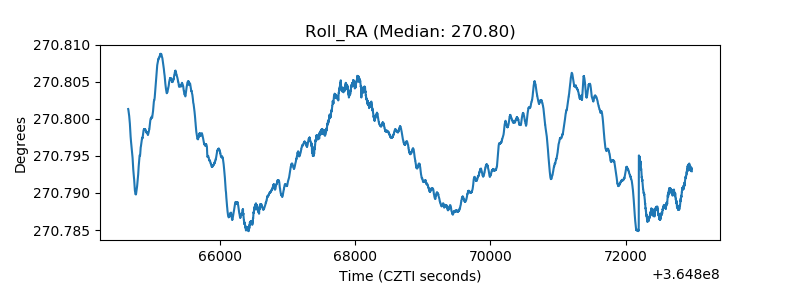 |
| Veto Counter | 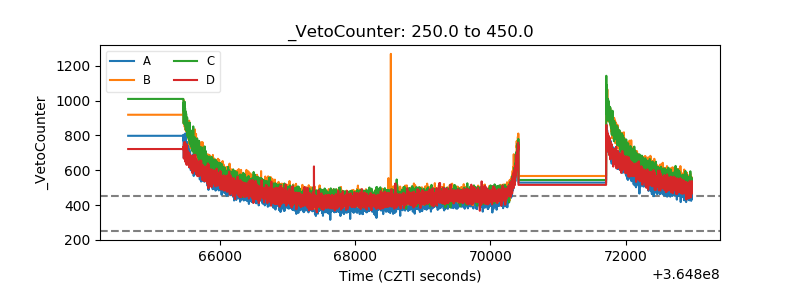 |