| Param | Original file | Final file |
|---|---|---|
| Filename | modeM0/AS1T04_028T01_9000004584_31483cztM0_level2.evt | modeM0/AS1T04_028T01_9000004584_31483cztM0_level2_quad_clean.evt |
| Size (bytes) | 606,458,880 | 85,867,200 |
| Size | 578.4 MB | 81.9 MB |
| Events in quadrant A | 3,497,059 | 559,877 |
| Events in quadrant B | 6,855,693 | 571,546 |
| Events in quadrant C | 3,554,338 | 535,102 |
| Events in quadrant D | 4,055,957 | 516,857 |
| Mode SS | |||
|---|---|---|---|
| Quadrant | BADHDUFLAG | Total packets | Discarded packets |
| A | 0 | 122 | 0 |
| B | 0 | 122 | 0 |
| C | 0 | 122 | 2 |
| D | 0 | 122 | 0 |
| Mode M0 | |||
|---|---|---|---|
| Quadrant | BADHDUFLAG | Total packets | Discarded packets |
| A | 0 | 14137 | 150 |
| B | 0 | 24414 | 253 |
| C | 0 | 14166 | 162 |
| D | 0 | 16169 | 229 |
| Mode M9 | |||
|---|---|---|---|
| Quadrant | BADHDUFLAG | Total packets | Discarded packets |
| A | 0 | 22 | 0 |
| B | 0 | 23 | 0 |
| C | 0 | 23 | 0 |
| D | 0 | 23 | 0 |
| Quadrant | Total seconds | Saturated seconds | Saturation percentage |
|---|---|---|---|
| A | 5974 | 106 | 1.774356% |
| B | 5959 | 1066 | 17.888908% |
| C | 5967 | 230 | 3.854533% |
| D | 5967 | 129 | 2.161890% |
Noise dominated data is calculated using 1-second bins in cleaned event files. If a bin has >2000 counts, and if more than 50% of those come from <1% of pixels, then it is considered to be noise-dominated and hence unusable.
| Quadrant | # 1 sec bins | Bins with >0 counts | Bins with >2000 counts | High rate bins dominated by noise | Noise dominated (total time) | Noise dominated (detector-on time) | Marked lightcurve |
|---|---|---|---|---|---|---|---|
| A | 7408 | 5997 | 84 | 84 | 1.13% | 1.40% | 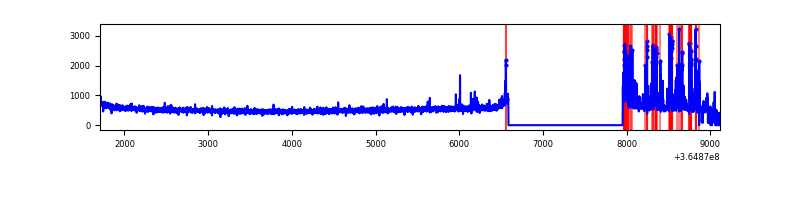 |
| B | 7407 | 5986 | 943 | 943 | 12.73% | 15.75% | 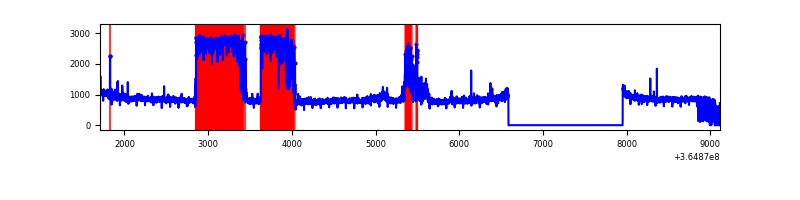 |
| C | 7369 | 5985 | 141 | 141 | 1.91% | 2.36% | 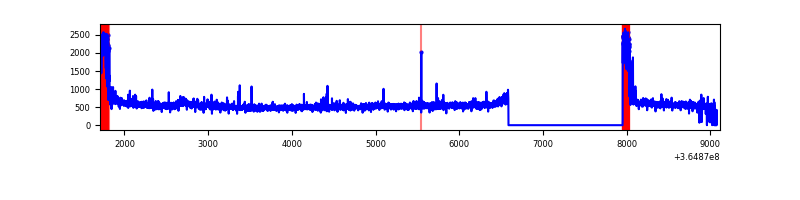 |
| D | 7356 | 5986 | 127 | 127 | 1.73% | 2.12% | 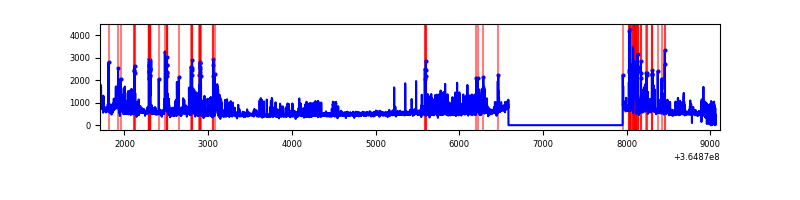 |
Top three noisy pixels from each quadrant. If the there are fewer than three noisy pixels in the level2.evt file, extra rows are filled as -1
| Pixel properties | Quadrant properties | ||||||
|---|---|---|---|---|---|---|---|
| Quadrant | DetID | PixID | Counts | Sigma | Mean | Median | Sigma |
| A | 0 | 13 | 415554 | 2618.81 | 799 | 785 | 158.4 |
| A | 13 | 254 | 10530 | 61.53 | 799 | 785 | 158.4 |
| A | 3 | 137 | 7654 | 43.37 | 799 | 785 | 158.4 |
| B | 12 | 1 | 2463275 | 17877.38 | 727 | 711 | 137.7 |
| B | 6 | 159 | 1472307 | 10683.29 | 727 | 711 | 137.7 |
| B | 0 | 230 | 28408 | 201.07 | 727 | 711 | 137.7 |
| C | 0 | 10 | 395515 | 2231.07 | 759 | 767 | 176.9 |
| C | 14 | 238 | 127608 | 716.89 | 759 | 767 | 176.9 |
| C | 3 | 233 | 48317 | 268.75 | 759 | 767 | 176.9 |
| D | 8 | 195 | 527244 | 2901.29 | 761 | 742 | 181.5 |
| D | 12 | 218 | 270209 | 1484.9 | 761 | 742 | 181.5 |
| D | 10 | 253 | 221304 | 1215.41 | 761 | 742 | 181.5 |
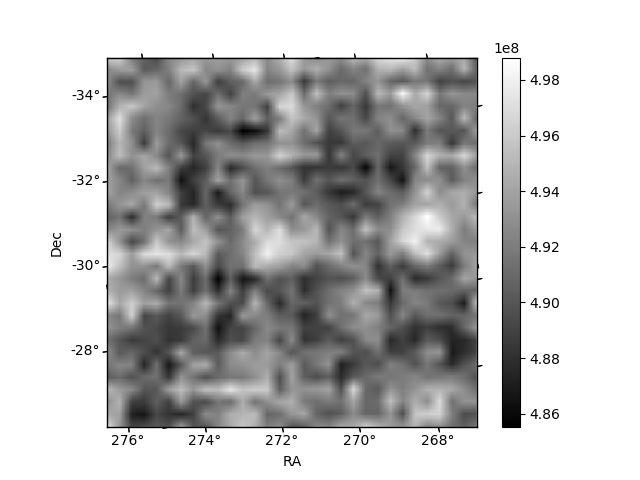
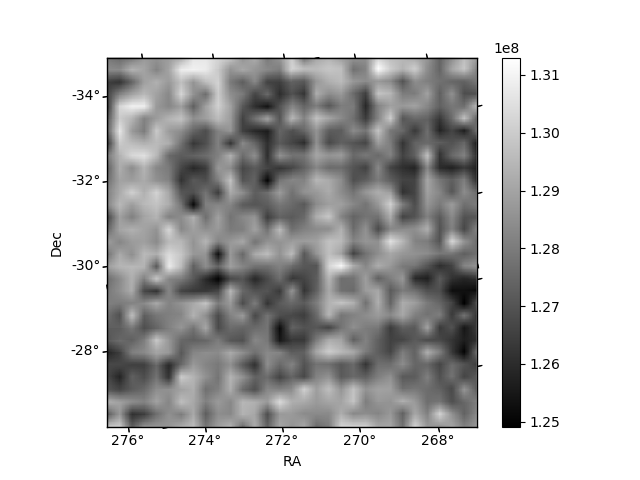
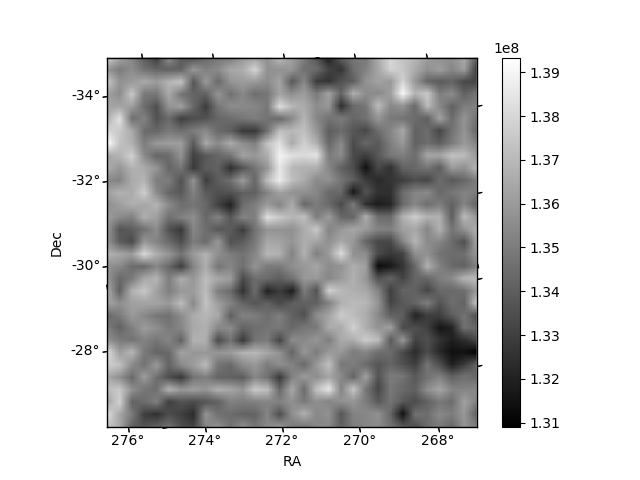
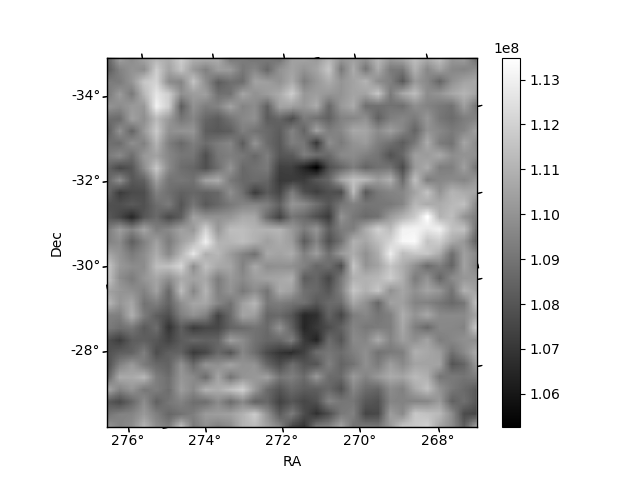
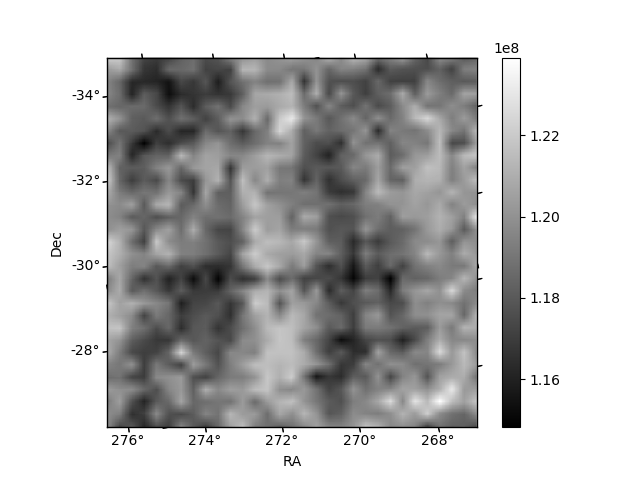
Histogram calculated using DETX and DETY for each event in the final _common_clean file
| Quadrant A | 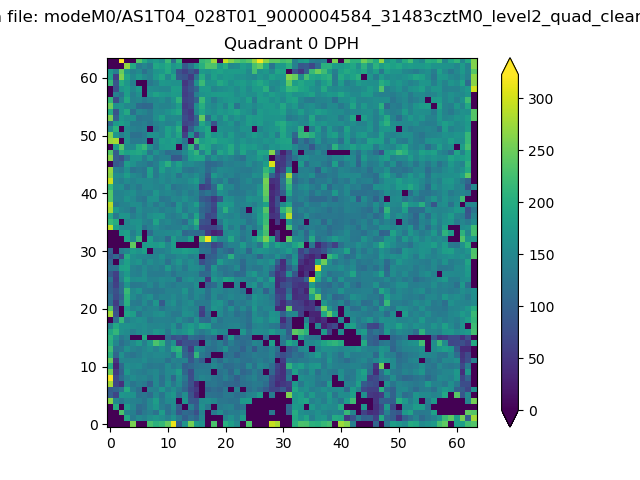 |
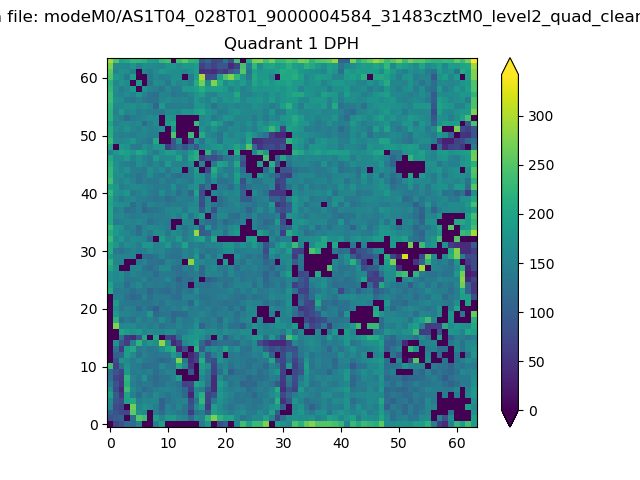 |
Quadrant B |
|---|---|---|---|
| Quadrant D | 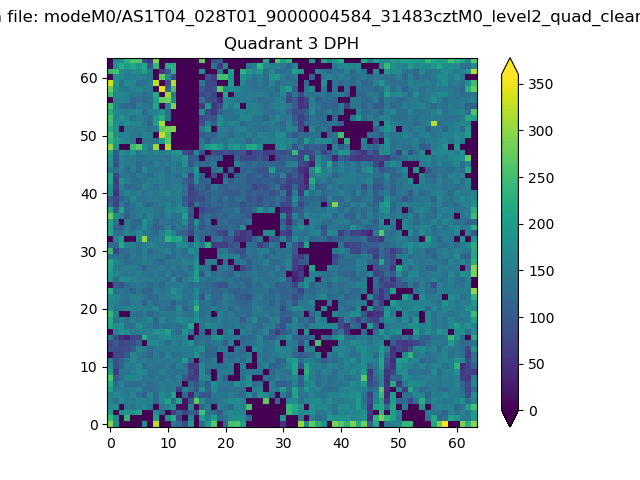 |
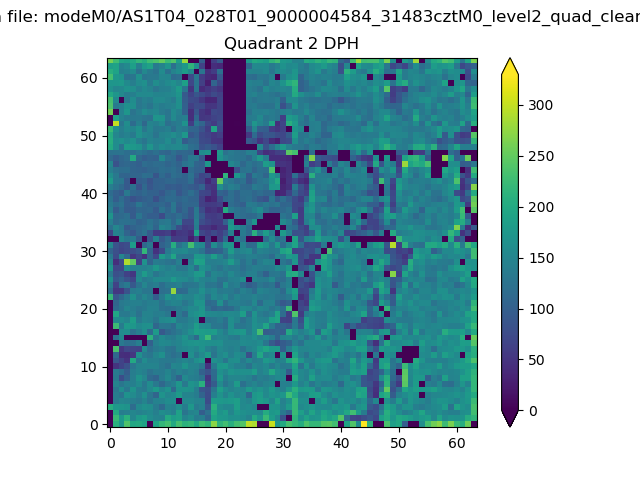 |
Quadrant C |
| Plot type | Count rate plots | Images |
|---|---|---|
| Comparison with Poisson distribution Blue bars denote a histogram of data divided into 1 sec bins. Red curve is a Poisson curve with rate = median count rate of data. |
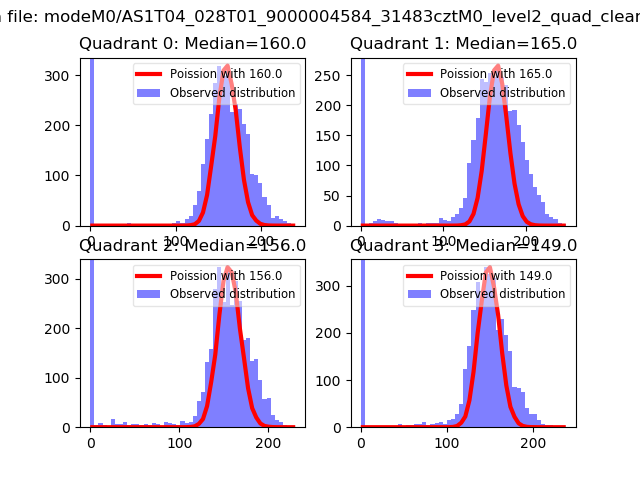 |
 |
| Quadrant-wise count rates Data is divided into 100 sec bins |
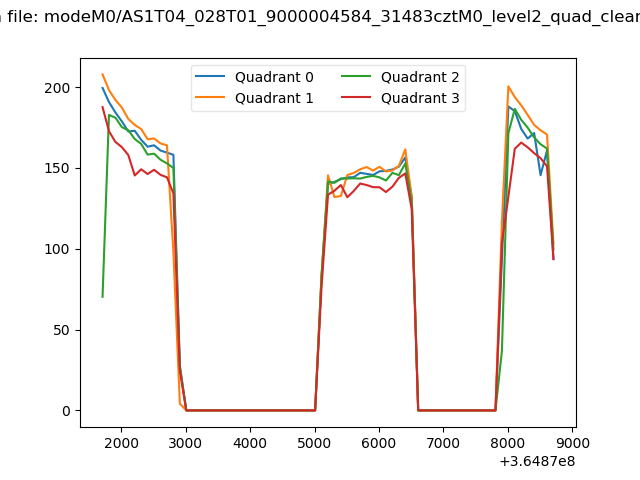 |
|
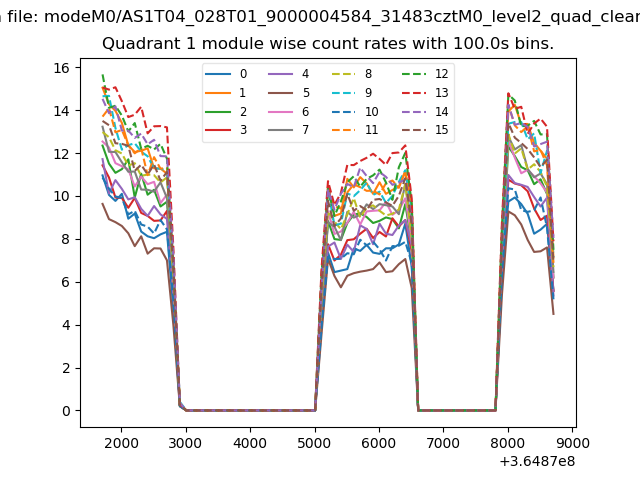
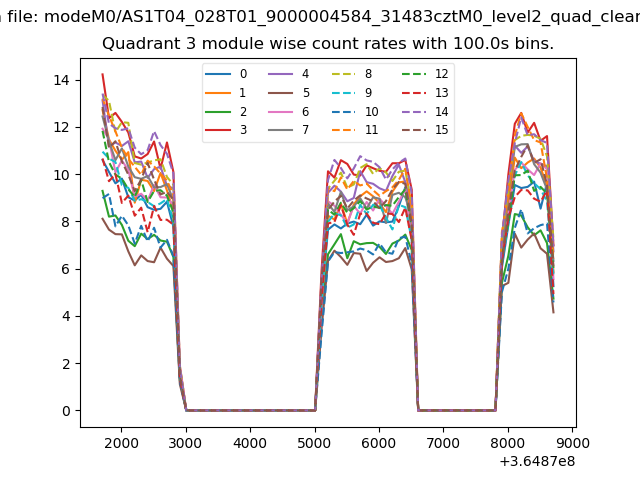
| Module-wise count rates for Quadrant A Data is divided into 100 sec bins |
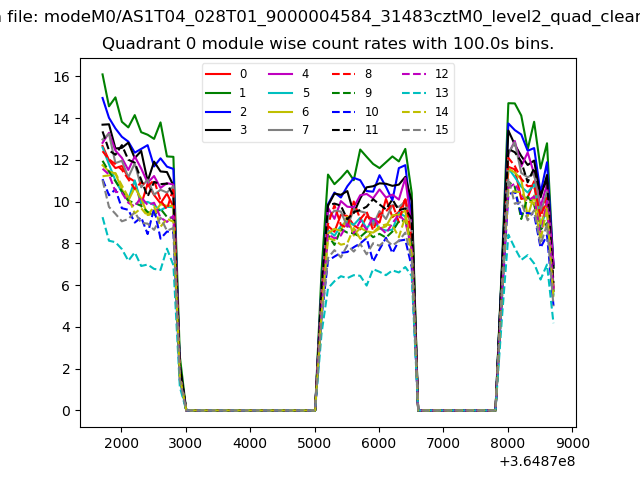 |
 |
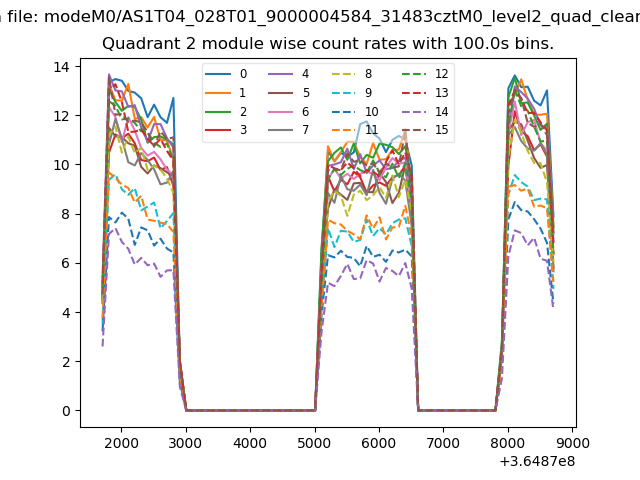
| Module-wise count rates for Quadrant B Data is divided into 100 sec bins |
 |
 |
| Module-wise count rates for Quadrant C Data is divided into 100 sec bins |
 |
 |
| Module-wise count rates for Quadrant D Data is divided into 100 sec bins |
 |
 |
| Parameter | Plot |
|---|---|
| CZT HV Monitor | 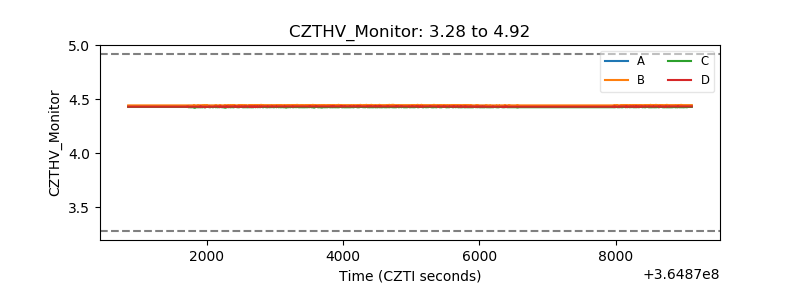 |
| D_VDD | 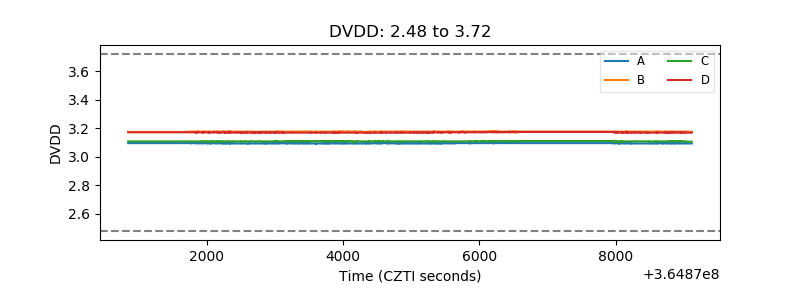 |
| Temperature 1 | 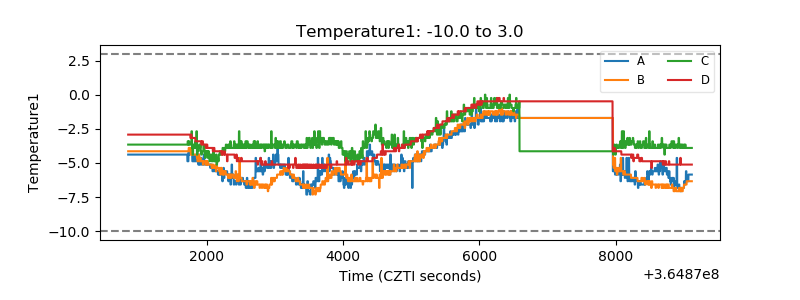 |
| Veto HV Monitor | 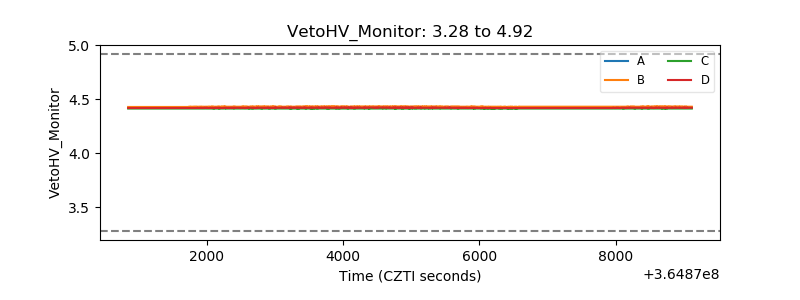 |
| Veto LLD | 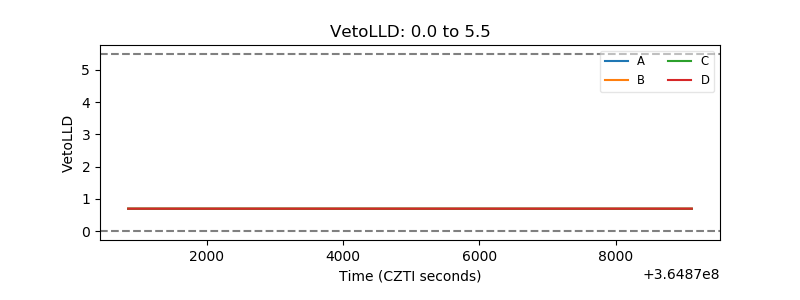 |
| Alpha Counter | 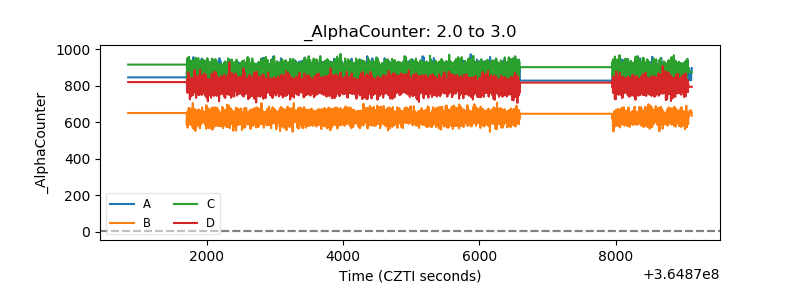 |
| _CPM_Rate | 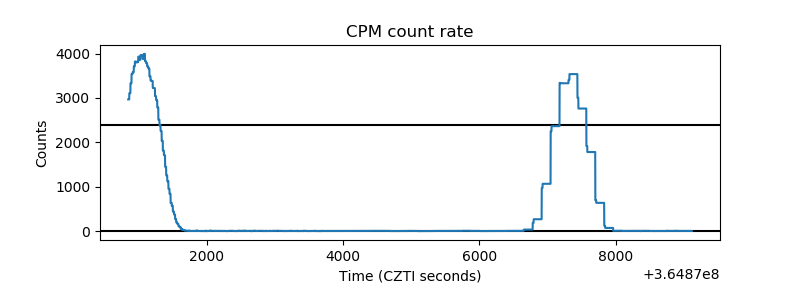 |
| CZT Counter | 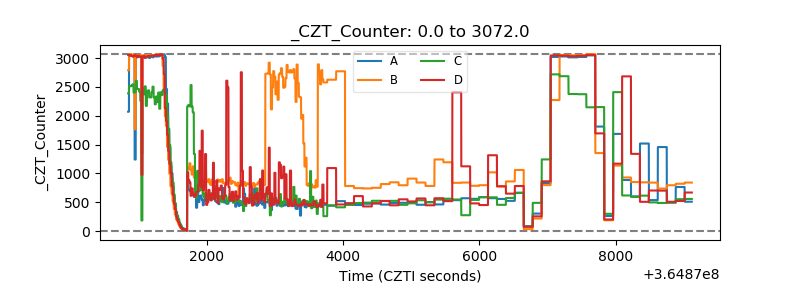 |
| +2.5 Volts monitor |  |
| +5 Volts monitor |  |
| _ROLL_ROT | 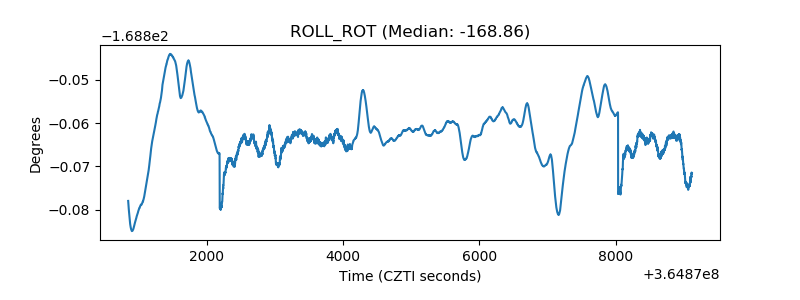 |
| _Roll_DEC | 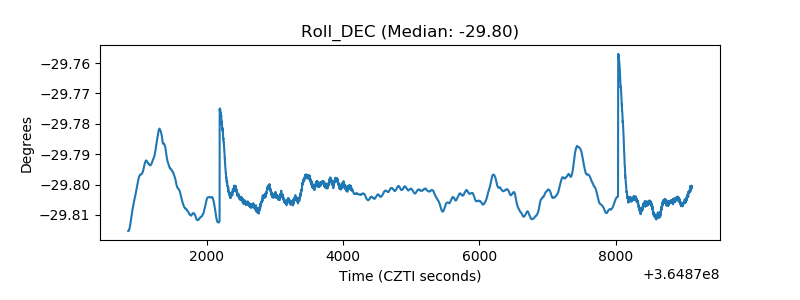 |
| _Roll_RA | 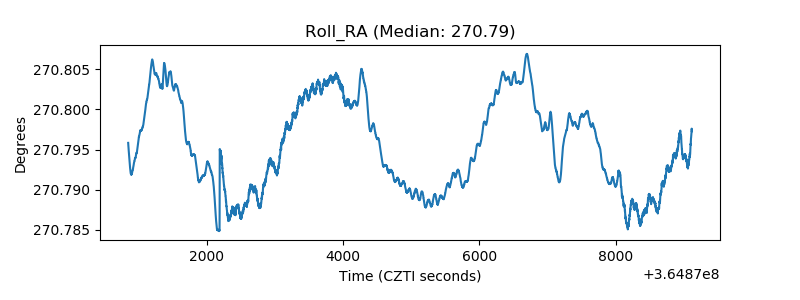 |
| Veto Counter | 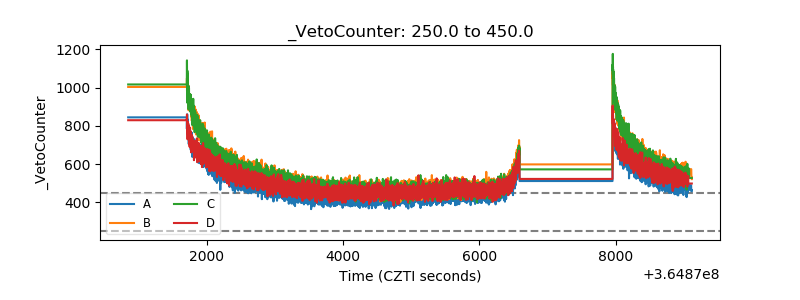 |