| Param | Original file | Final file |
|---|---|---|
| Filename | modeM0/AS1T04_028T01_9000004584_31485cztM0_level2.evt | modeM0/AS1T04_028T01_9000004584_31485cztM0_level2_quad_clean.evt |
| Size (bytes) | 354,107,520 | 35,818,560 |
| Size | 337.7 MB | 34.2 MB |
| Events in quadrant A | 1,577,494 | 226,083 |
| Events in quadrant B | 4,788,342 | 222,308 |
| Events in quadrant C | 1,743,578 | 215,640 |
| Events in quadrant D | 2,404,064 | 200,255 |
| Mode SS | |||
|---|---|---|---|
| Quadrant | BADHDUFLAG | Total packets | Discarded packets |
| A | 0 | 66 | 2 |
| B | 0 | 66 | 2 |
| C | 0 | 67 | 3 |
| D | 0 | 67 | 3 |
| Mode M0 | |||
|---|---|---|---|
| Quadrant | BADHDUFLAG | Total packets | Discarded packets |
| A | 0 | 6621 | 199 |
| B | 0 | 16659 | 352 |
| C | 0 | 7170 | 293 |
| D | 0 | 9705 | 579 |
| Mode M9 | |||
|---|---|---|---|
| Quadrant | BADHDUFLAG | Total packets | Discarded packets |
| A | 0 | 12 | 0 |
| B | 0 | 14 | 2 |
| C | 0 | 12 | 0 |
| D | 0 | 12 | 0 |
| Quadrant | Total seconds | Saturated seconds | Saturation percentage |
|---|---|---|---|
| A | 3102 | 13 | 0.419084% |
| B | 3080 | 1329 | 43.149351% |
| C | 3082 | 95 | 3.082414% |
| D | 3081 | 185 | 6.004544% |
Noise dominated data is calculated using 1-second bins in cleaned event files. If a bin has >2000 counts, and if more than 50% of those come from <1% of pixels, then it is considered to be noise-dominated and hence unusable.
| Quadrant | # 1 sec bins | Bins with >0 counts | Bins with >2000 counts | High rate bins dominated by noise | Noise dominated (total time) | Noise dominated (detector-on time) | Marked lightcurve |
|---|---|---|---|---|---|---|---|
| A | 4537 | 3122 | 3 | 3 | 0.07% | 0.10% | 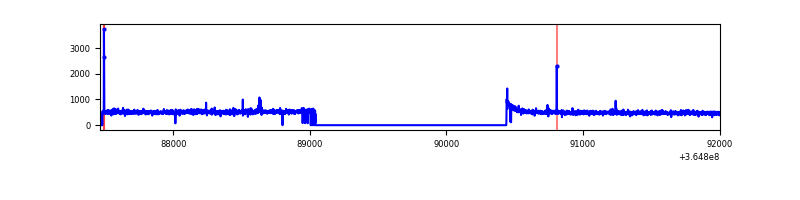 |
| B | 4534 | 3112 | 1246 | 1246 | 27.48% | 40.04% |  |
| C | 4537 | 3110 | 55 | 55 | 1.21% | 1.77% | 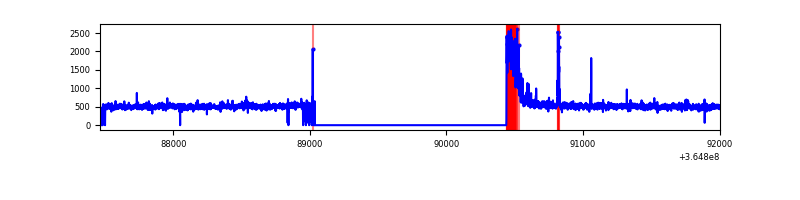 |
| D | 4540 | 3103 | 167 | 167 | 3.68% | 5.38% | 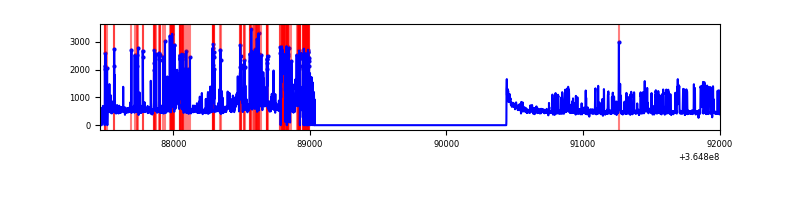 |
Top three noisy pixels from each quadrant. If the there are fewer than three noisy pixels in the level2.evt file, extra rows are filled as -1
| Pixel properties | Quadrant properties | ||||||
|---|---|---|---|---|---|---|---|
| Quadrant | DetID | PixID | Counts | Sigma | Mean | Median | Sigma |
| A | 0 | 13 | 15224 | 180.8 | 403 | 395 | 82.0 |
| A | 6 | 10 | 7029 | 80.89 | 403 | 395 | 82.0 |
| A | 13 | 254 | 5346 | 60.37 | 403 | 395 | 82.0 |
| B | 12 | 1 | 3006897 | 53100.92 | 289 | 283 | 56.6 |
| B | 6 | 159 | 605942 | 10696.77 | 289 | 283 | 56.6 |
| B | 4 | 80 | 16622 | 288.57 | 289 | 283 | 56.6 |
| C | 0 | 10 | 188927 | 2109.77 | 377 | 379 | 89.4 |
| C | 14 | 238 | 61545 | 684.42 | 377 | 379 | 89.4 |
| C | 3 | 233 | 11951 | 129.49 | 377 | 379 | 89.4 |
| D | 12 | 218 | 474952 | 5209.55 | 378 | 369 | 91.1 |
| D | 8 | 195 | 454358 | 4983.49 | 378 | 369 | 91.1 |
| D | 2 | 234 | 11383 | 120.9 | 378 | 369 | 91.1 |
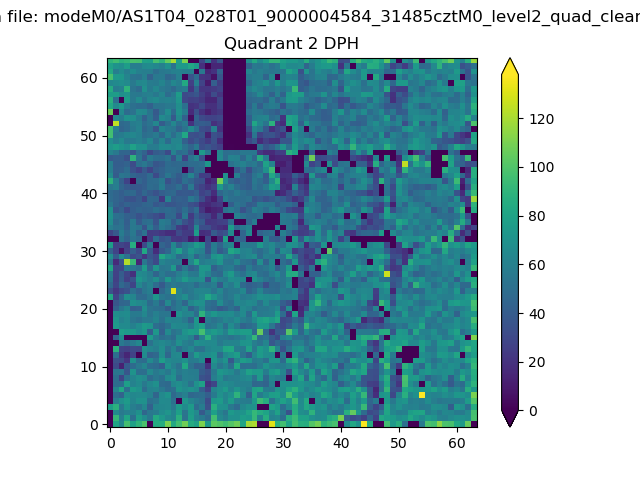
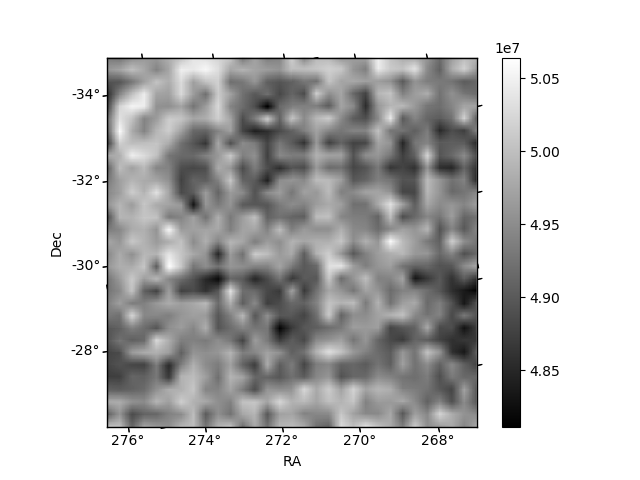
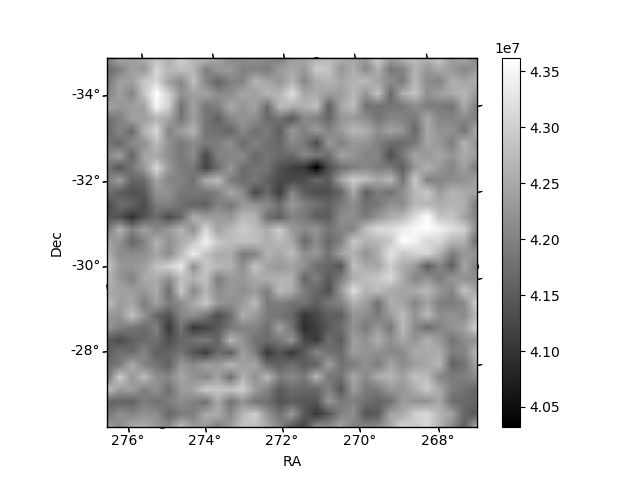
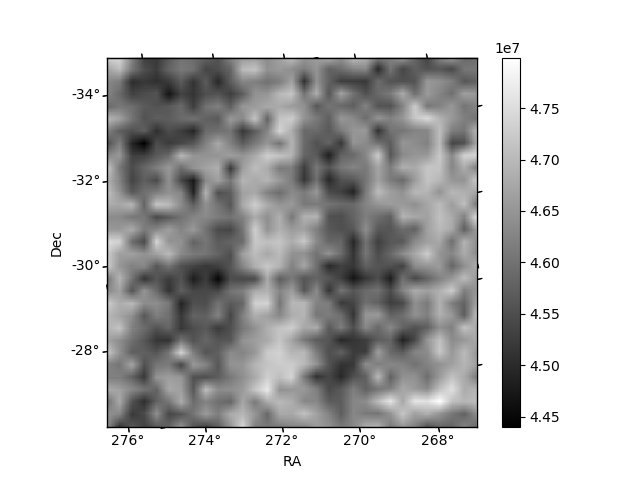
Histogram calculated using DETX and DETY for each event in the final _common_clean file
| Quadrant A | 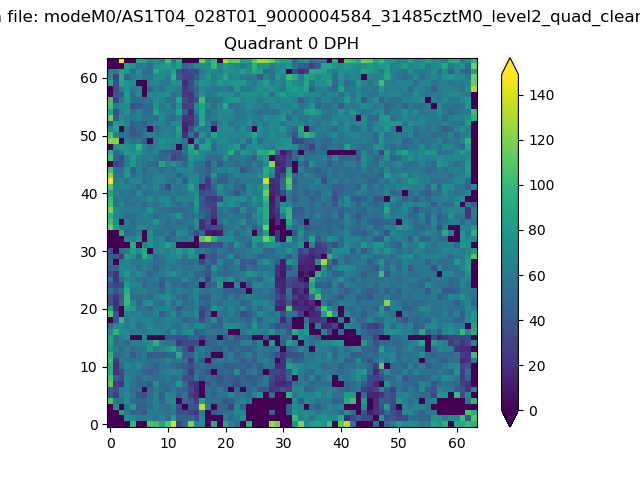 |
 |
Quadrant B |
|---|---|---|---|
| Quadrant D | 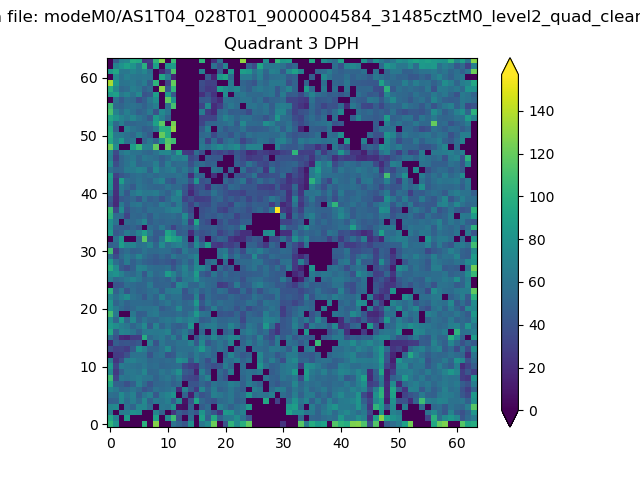 |
 |
Quadrant C |
| Plot type | Count rate plots | Images |
|---|---|---|
| Comparison with Poisson distribution Blue bars denote a histogram of data divided into 1 sec bins. Red curve is a Poisson curve with rate = median count rate of data. |
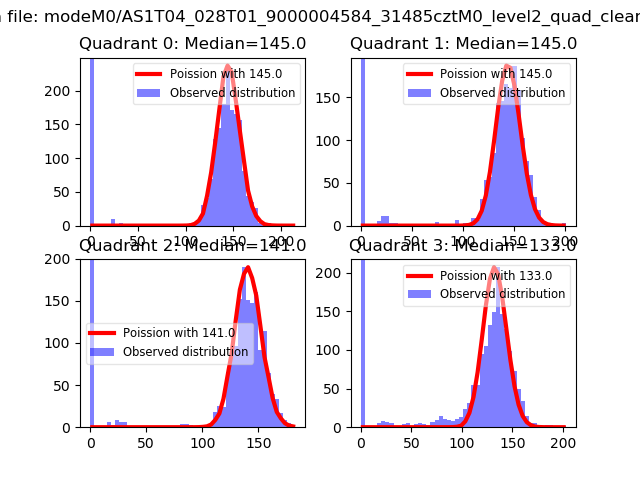 |
 |
| Quadrant-wise count rates Data is divided into 100 sec bins |
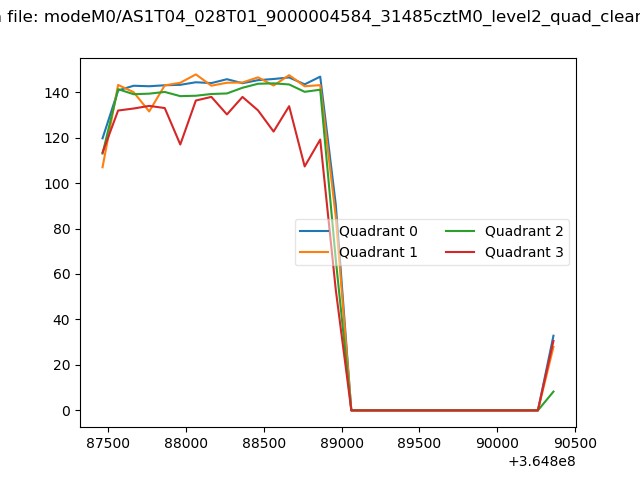 |
|
| Module-wise count rates for Quadrant A Data is divided into 100 sec bins |
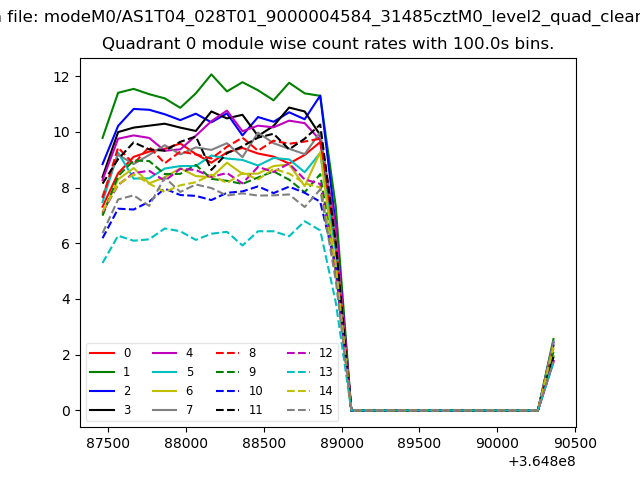 |
 |
| Module-wise count rates for Quadrant B Data is divided into 100 sec bins |
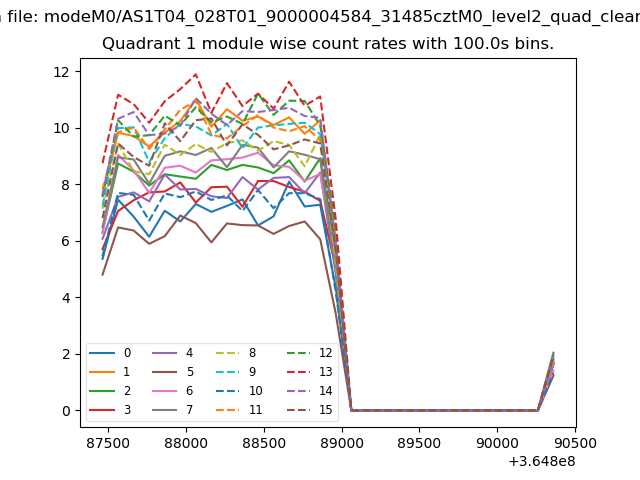 |
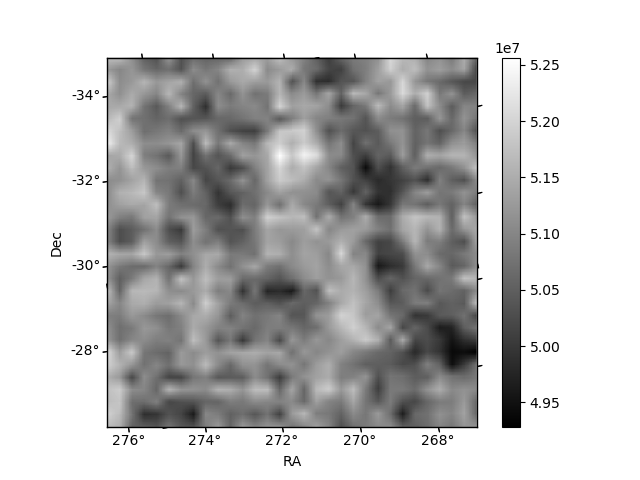 |
| Module-wise count rates for Quadrant C Data is divided into 100 sec bins |
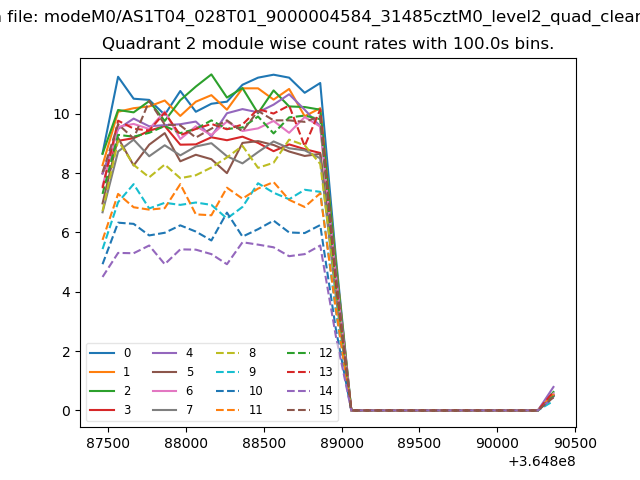 |
 |
| Module-wise count rates for Quadrant D Data is divided into 100 sec bins |
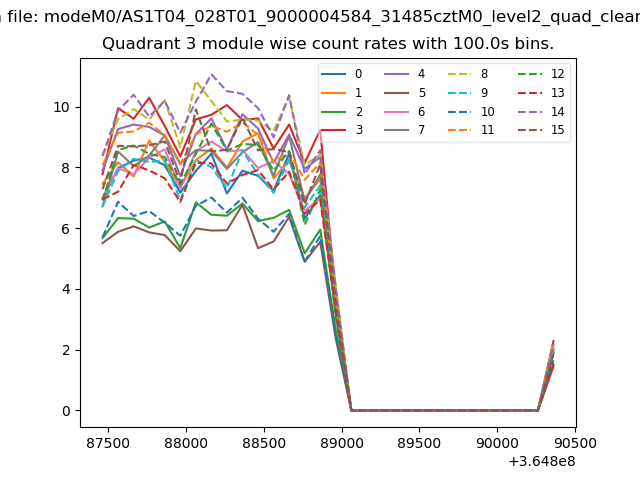 |
 |
| Parameter | Plot |
|---|---|
| CZT HV Monitor | 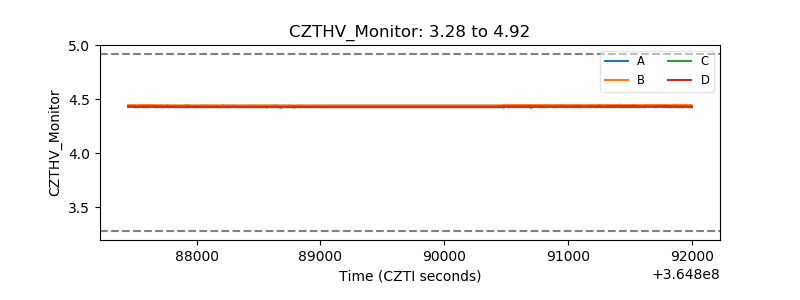 |
| D_VDD | 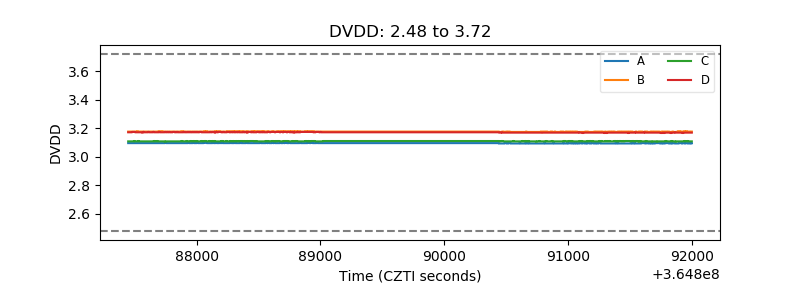 |
| Temperature 1 | 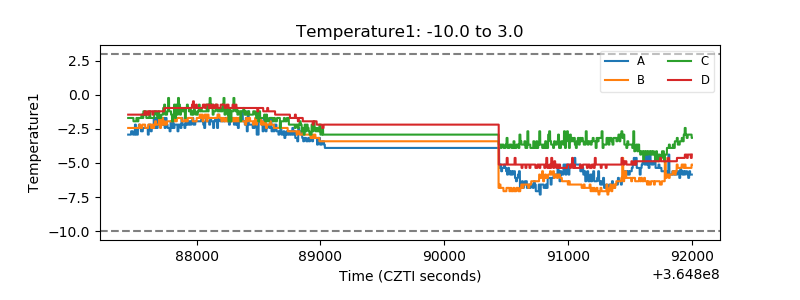 |
| Veto HV Monitor | 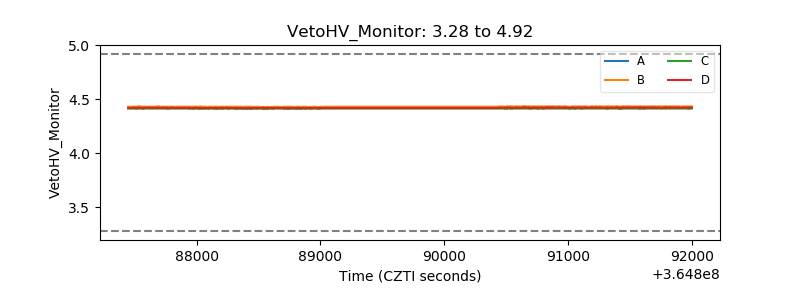 |
| Veto LLD | 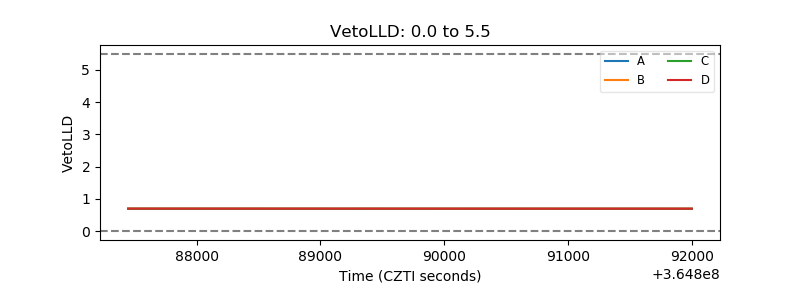 |
| Alpha Counter | 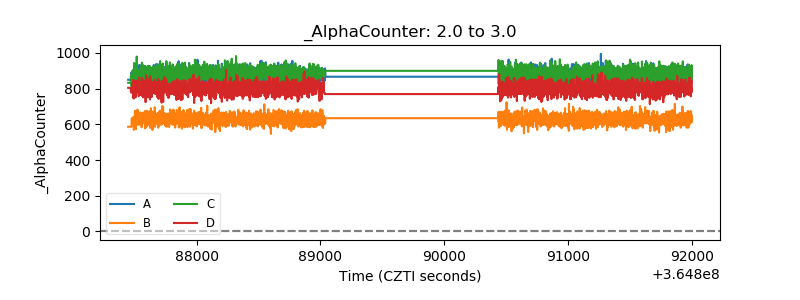 |
| _CPM_Rate | 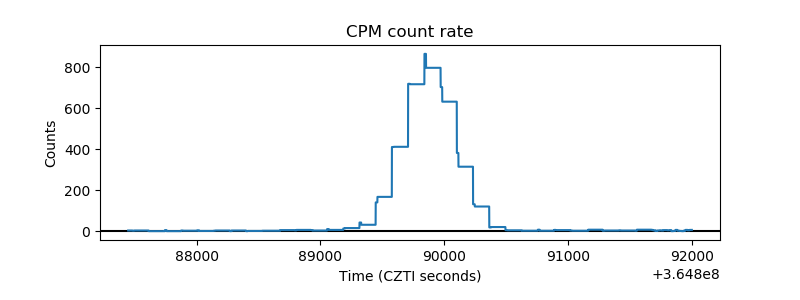 |
| CZT Counter | 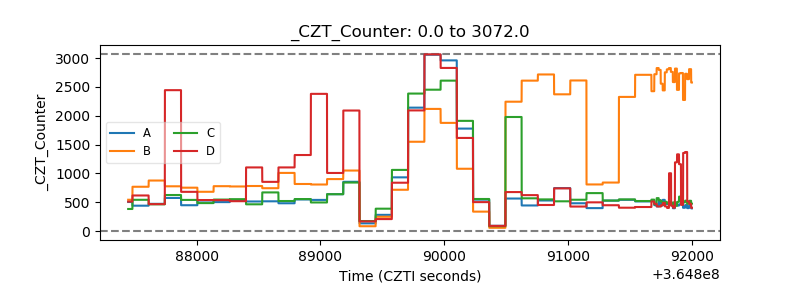 |
| +2.5 Volts monitor |  |
| +5 Volts monitor |  |
| _ROLL_ROT | 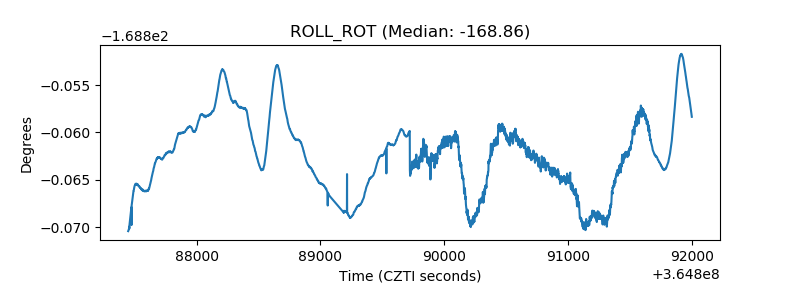 |
| _Roll_DEC | 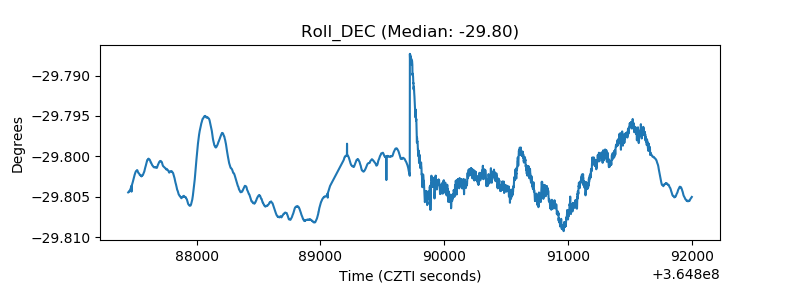 |
| _Roll_RA | 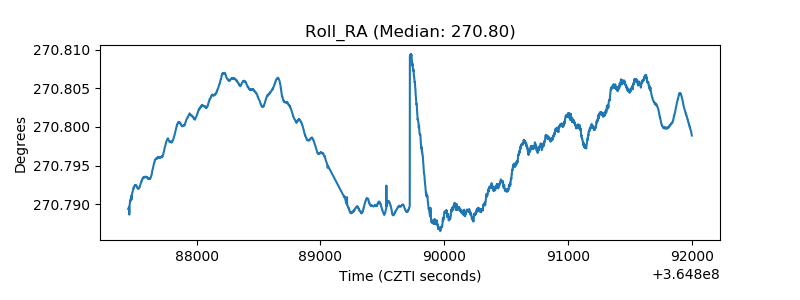 |
| Veto Counter | 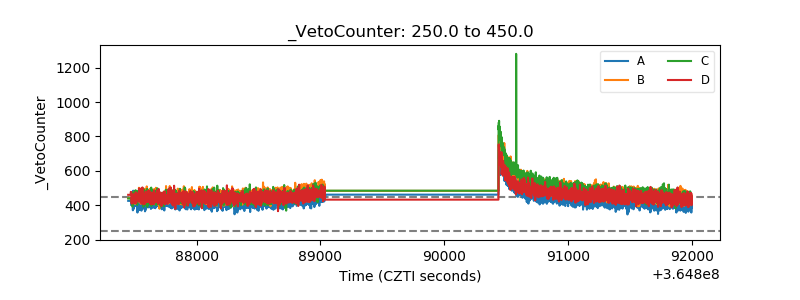 |