| Param | Original file | Final file |
|---|---|---|
| Filename | modeM0/AS1T04_028T01_9000004584_31486cztM0_level2.evt | modeM0/AS1T04_028T01_9000004584_31486cztM0_level2_quad_clean.evt |
| Size (bytes) | 738,959,040 | 70,764,480 |
| Size | 704.7 MB | 67.5 MB |
| Events in quadrant A | 3,412,390 | 434,122 |
| Events in quadrant B | 10,649,516 | 398,916 |
| Events in quadrant C | 3,747,293 | 421,481 |
| Events in quadrant D | 4,106,077 | 409,784 |
| Mode SS | |||
|---|---|---|---|
| Quadrant | BADHDUFLAG | Total packets | Discarded packets |
| A | 0 | 140 | 0 |
| B | 0 | 140 | 0 |
| C | 0 | 140 | 0 |
| D | 0 | 140 | 0 |
| Mode M0 | |||
|---|---|---|---|
| Quadrant | BADHDUFLAG | Total packets | Discarded packets |
| A | 0 | 14277 | 2 |
| B | 0 | 36497 | 3 |
| C | 0 | 15129 | 2 |
| D | 0 | 16568 | 2 |
| Mode M9 | |||
|---|---|---|---|
| Quadrant | BADHDUFLAG | Total packets | Discarded packets |
| A | 0 | 11 | 0 |
| B | 0 | 12 | 0 |
| C | 0 | 12 | 0 |
| D | 0 | 12 | 0 |
| Quadrant | Total seconds | Saturated seconds | Saturation percentage |
|---|---|---|---|
| A | 6859 | 82 | 1.195510% |
| B | 6858 | 3031 | 44.196559% |
| C | 6858 | 282 | 4.111986% |
| D | 6858 | 106 | 1.545640% |
Noise dominated data is calculated using 1-second bins in cleaned event files. If a bin has >2000 counts, and if more than 50% of those come from <1% of pixels, then it is considered to be noise-dominated and hence unusable.
| Quadrant | # 1 sec bins | Bins with >0 counts | Bins with >2000 counts | High rate bins dominated by noise | Noise dominated (total time) | Noise dominated (detector-on time) | Marked lightcurve |
|---|---|---|---|---|---|---|---|
| A | 7704 | 6859 | 2 | 2 | 0.03% | 0.03% | 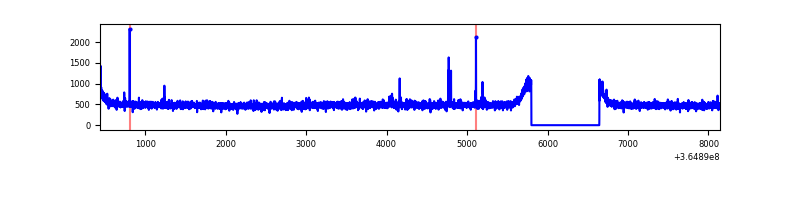 |
| B | 7702 | 6857 | 2667 | 2667 | 34.63% | 38.89% | 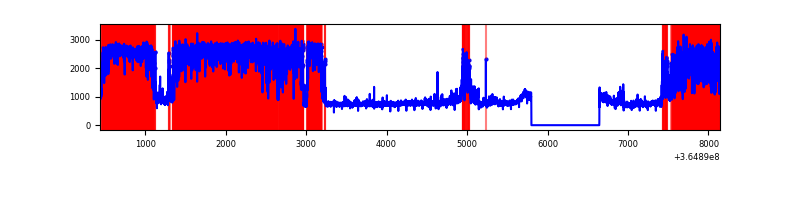 |
| C | 7703 | 6858 | 83 | 83 | 1.08% | 1.21% | 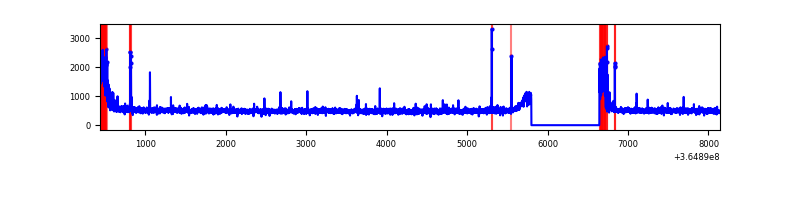 |
| D | 7703 | 6858 | 23 | 23 | 0.30% | 0.34% | 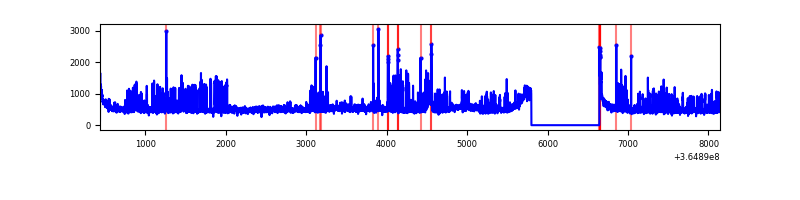 |
Top three noisy pixels from each quadrant. If the there are fewer than three noisy pixels in the level2.evt file, extra rows are filled as -1
| Pixel properties | Quadrant properties | ||||||
|---|---|---|---|---|---|---|---|
| Quadrant | DetID | PixID | Counts | Sigma | Mean | Median | Sigma |
| A | 0 | 13 | 48976 | 275.54 | 872 | 854 | 174.6 |
| A | 13 | 254 | 11476 | 60.82 | 872 | 854 | 174.6 |
| A | 3 | 137 | 8891 | 46.02 | 872 | 854 | 174.6 |
| B | 12 | 1 | 6442030 | 49017.56 | 674 | 656 | 131.4 |
| B | 6 | 159 | 1387529 | 10553.82 | 674 | 656 | 131.4 |
| B | 0 | 190 | 89756 | 678.03 | 674 | 656 | 131.4 |
| C | 0 | 10 | 333645 | 1685.14 | 832 | 839 | 197.5 |
| C | 14 | 238 | 134532 | 676.95 | 832 | 839 | 197.5 |
| C | 2 | 114 | 15841 | 75.96 | 832 | 839 | 197.5 |
| D | 8 | 195 | 728217 | 3649.01 | 844 | 824 | 199.3 |
| D | 12 | 218 | 52398 | 258.72 | 844 | 824 | 199.3 |
| D | 2 | 120 | 39708 | 195.06 | 844 | 824 | 199.3 |
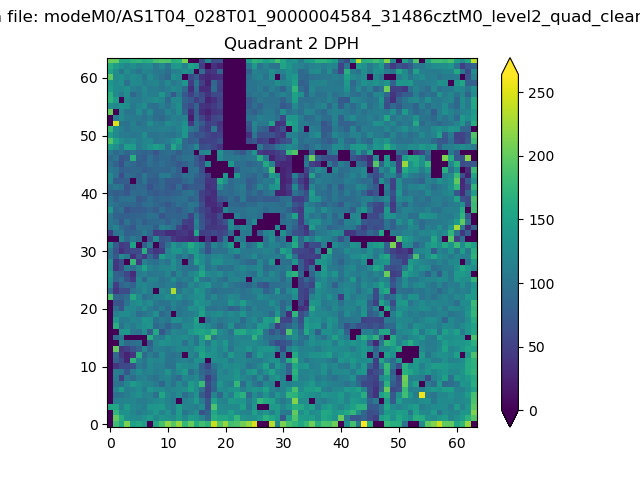
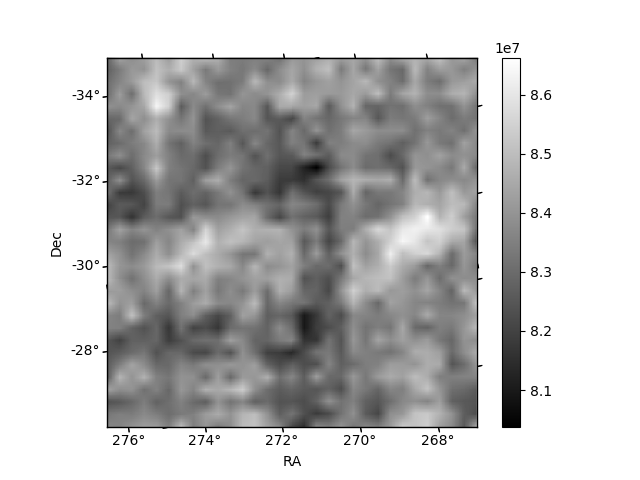
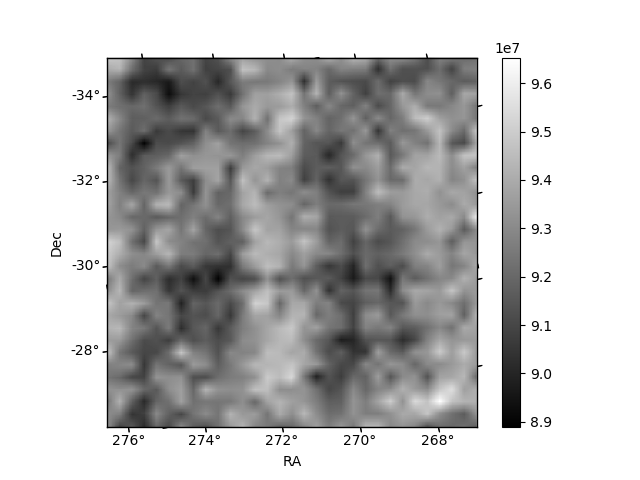
Histogram calculated using DETX and DETY for each event in the final _common_clean file
| Quadrant A | 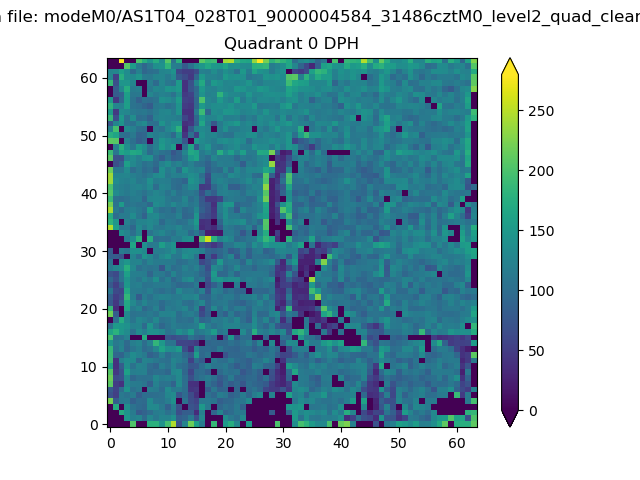 |
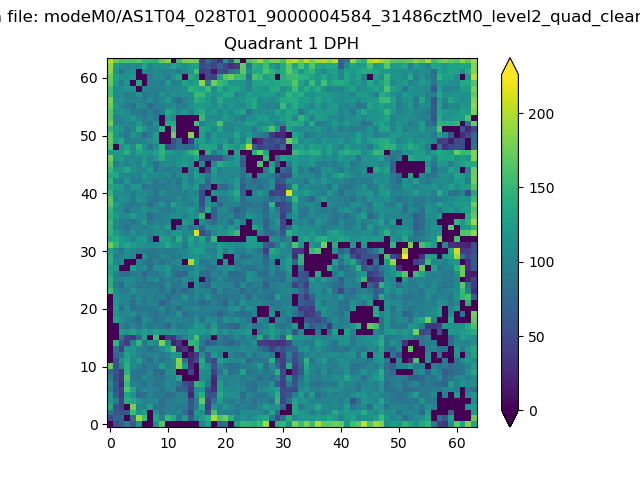 |
Quadrant B |
|---|---|---|---|
| Quadrant D | 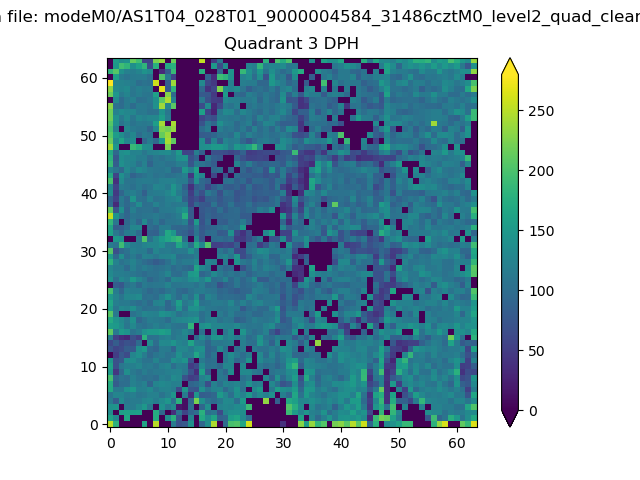 |
 |
Quadrant C |
| Plot type | Count rate plots | Images |
|---|---|---|
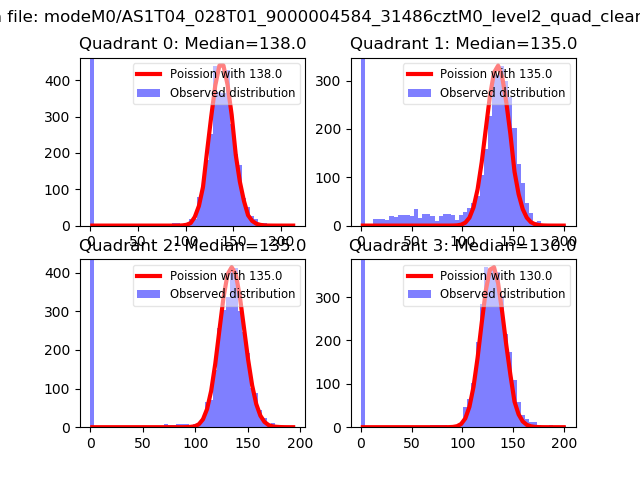
| Comparison with Poisson distribution Blue bars denote a histogram of data divided into 1 sec bins. Red curve is a Poisson curve with rate = median count rate of data. |
 |
 |
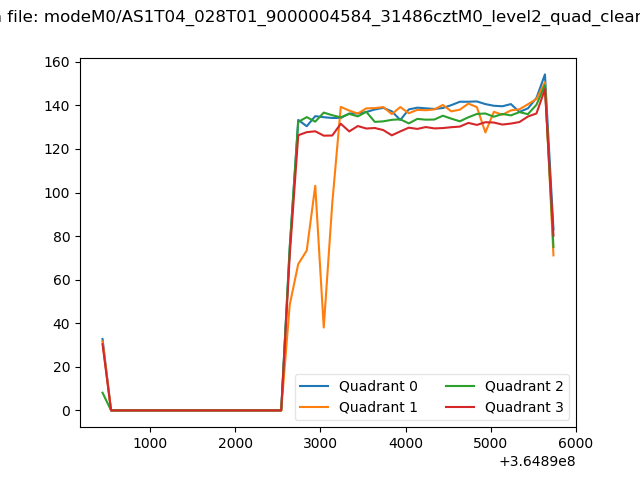
| Quadrant-wise count rates Data is divided into 100 sec bins |
 |
|
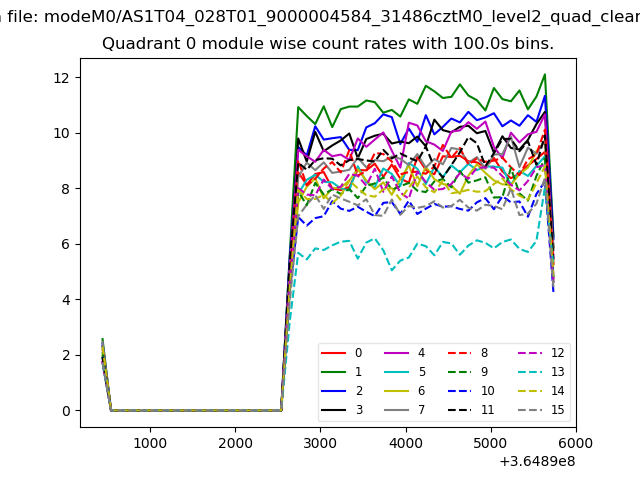
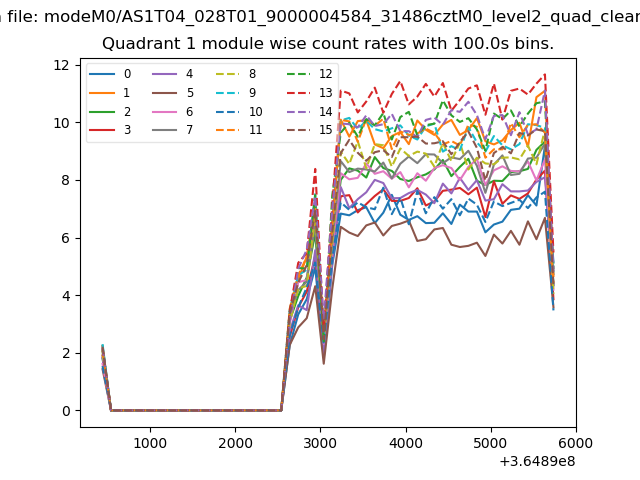
| Module-wise count rates for Quadrant A Data is divided into 100 sec bins |
 |
 |
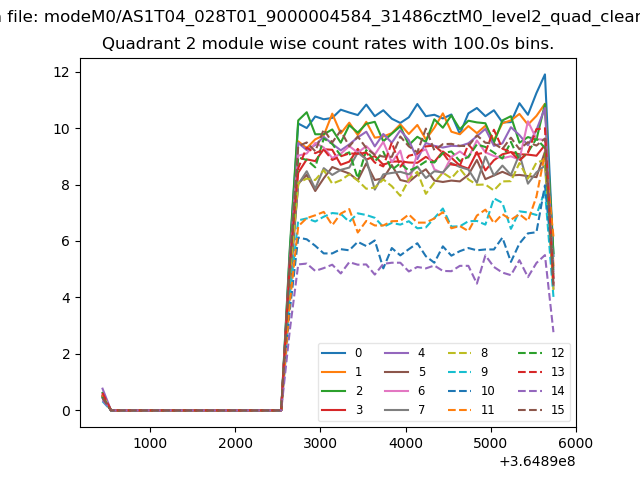
| Module-wise count rates for Quadrant B Data is divided into 100 sec bins |
 |
 |
| Module-wise count rates for Quadrant C Data is divided into 100 sec bins |
 |
 |
| Module-wise count rates for Quadrant D Data is divided into 100 sec bins |
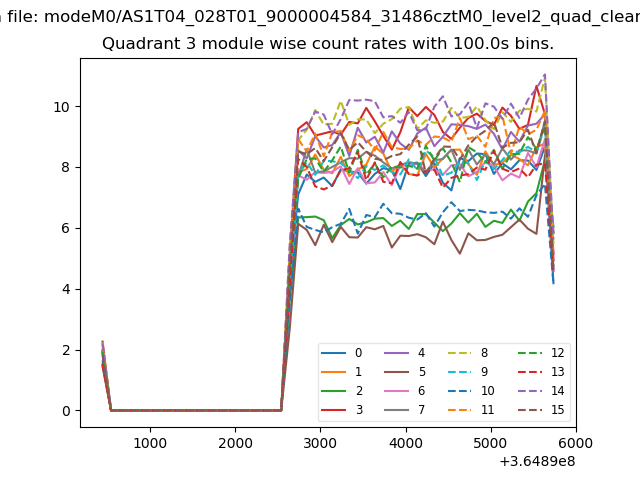 |
 |
| Parameter | Plot |
|---|---|
| CZT HV Monitor | 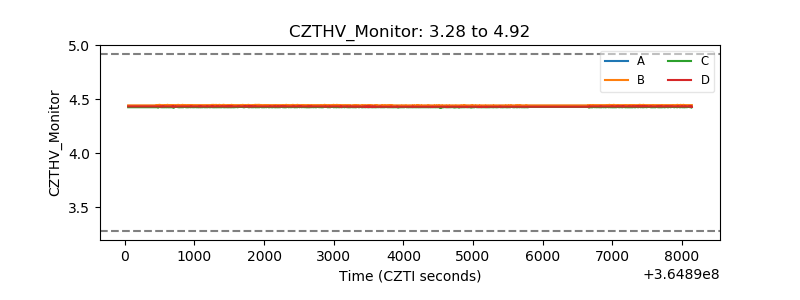 |
| D_VDD | 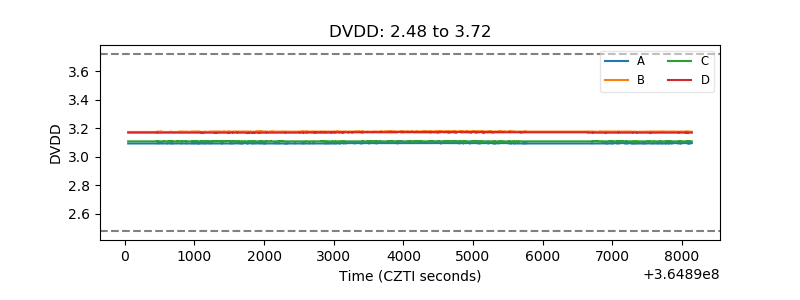 |
| Temperature 1 |  |
| Veto HV Monitor | 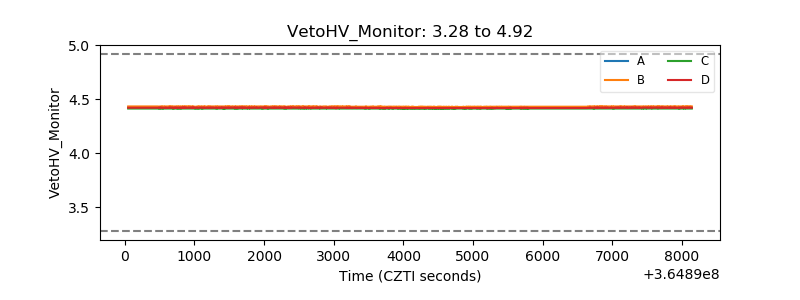 |
| Veto LLD | 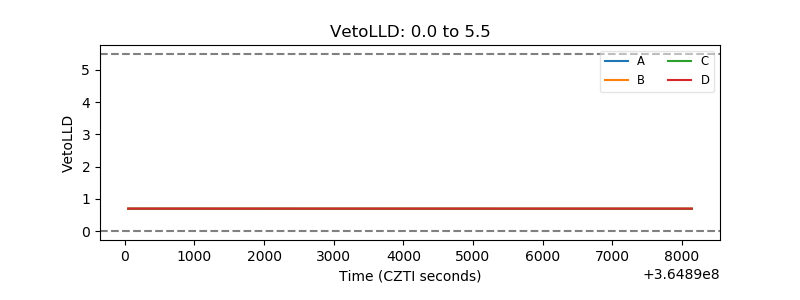 |
| Alpha Counter | 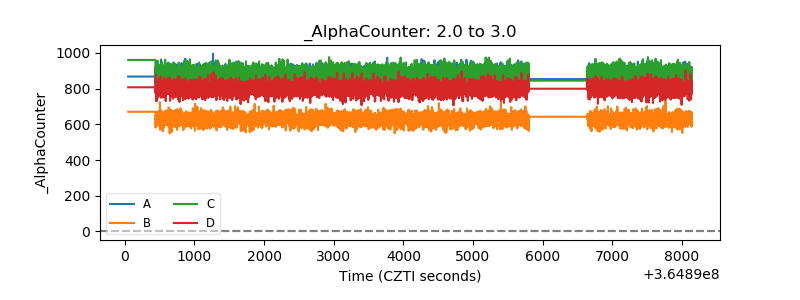 |
| _CPM_Rate | 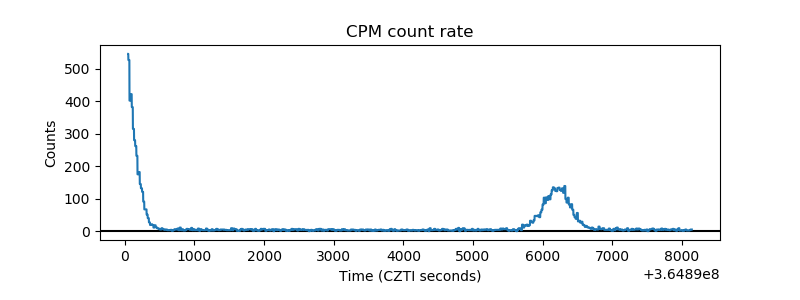 |
| CZT Counter | 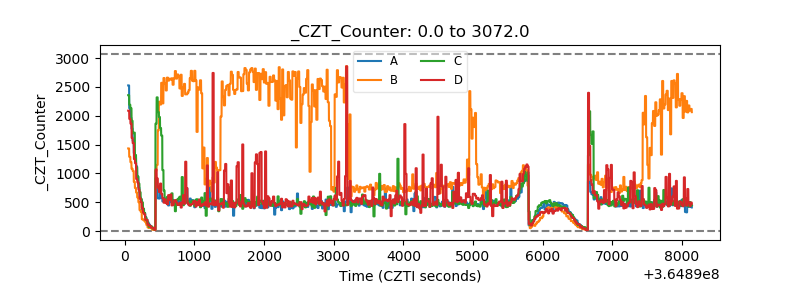 |
| +2.5 Volts monitor |  |
| +5 Volts monitor |  |
| _ROLL_ROT | 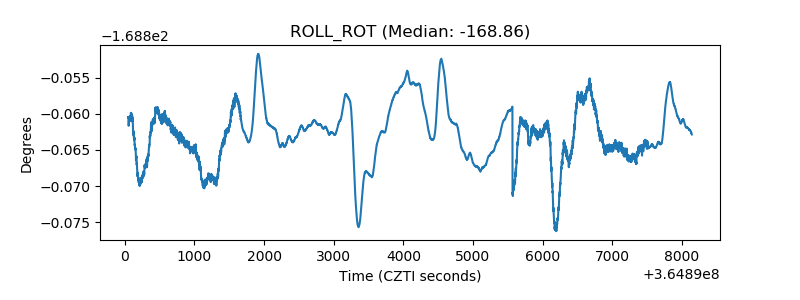 |
| _Roll_DEC | 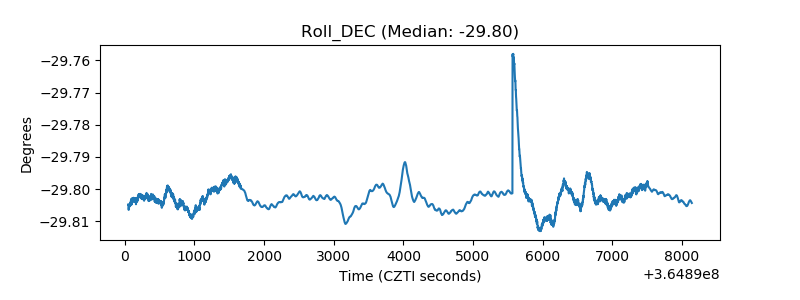 |
| _Roll_RA | 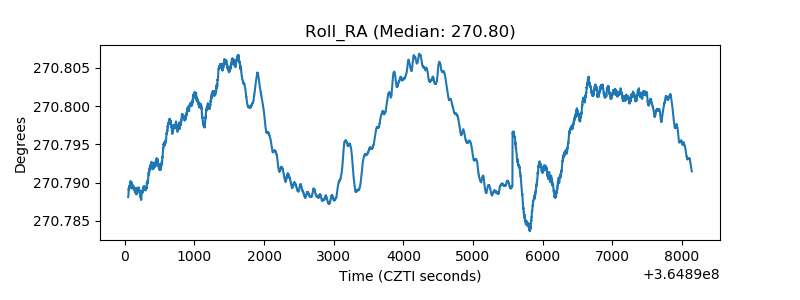 |
| Veto Counter | 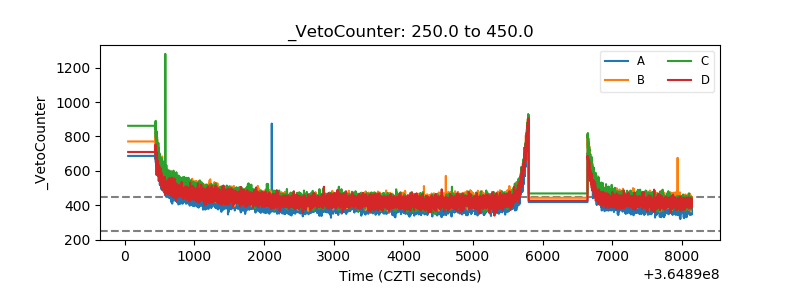 |