| Param | Original file | Final file |
|---|---|---|
| Filename | modeM0/AS1T04_028T01_9000004584_31487cztM0_level2.evt | modeM0/AS1T04_028T01_9000004584_31487cztM0_level2_quad_clean.evt |
| Size (bytes) | 526,366,080 | 75,216,960 |
| Size | 502.0 MB | 71.7 MB |
| Events in quadrant A | 2,888,067 | 476,085 |
| Events in quadrant B | 5,946,529 | 472,083 |
| Events in quadrant C | 3,150,863 | 466,670 |
| Events in quadrant D | 3,555,651 | 450,844 |
| Mode SS | |||
|---|---|---|---|
| Quadrant | BADHDUFLAG | Total packets | Discarded packets |
| A | 0 | 122 | 0 |
| B | 0 | 122 | 0 |
| C | 0 | 122 | 0 |
| D | 0 | 122 | 0 |
| Mode M0 | |||
|---|---|---|---|
| Quadrant | BADHDUFLAG | Total packets | Discarded packets |
| A | 0 | 12373 | 83 |
| B | 0 | 22196 | 102 |
| C | 0 | 13000 | 88 |
| D | 0 | 14490 | 88 |
| Mode M9 | |||
|---|---|---|---|
| Quadrant | BADHDUFLAG | Total packets | Discarded packets |
| A | 0 | 12 | 0 |
| B | 0 | 12 | 0 |
| C | 0 | 12 | 0 |
| D | 0 | 12 | 0 |
| Quadrant | Total seconds | Saturated seconds | Saturation percentage |
|---|---|---|---|
| A | 5894 | 203 | 3.444181% |
| B | 5895 | 945 | 16.030534% |
| C | 5893 | 294 | 4.988970% |
| D | 5892 | 206 | 3.496266% |
Noise dominated data is calculated using 1-second bins in cleaned event files. If a bin has >2000 counts, and if more than 50% of those come from <1% of pixels, then it is considered to be noise-dominated and hence unusable.
| Quadrant | # 1 sec bins | Bins with >0 counts | Bins with >2000 counts | High rate bins dominated by noise | Noise dominated (total time) | Noise dominated (detector-on time) | Marked lightcurve |
|---|---|---|---|---|---|---|---|
| A | 6239 | 5898 | 1 | 1 | 0.02% | 0.02% | 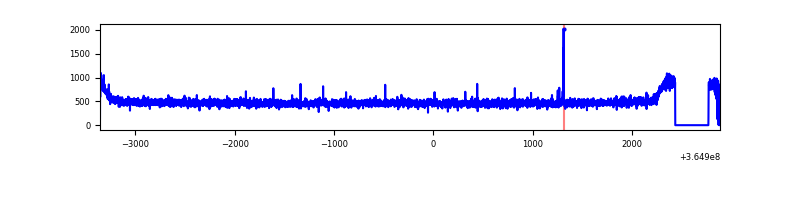 |
| B | 6237 | 5898 | 543 | 543 | 8.71% | 9.21% | 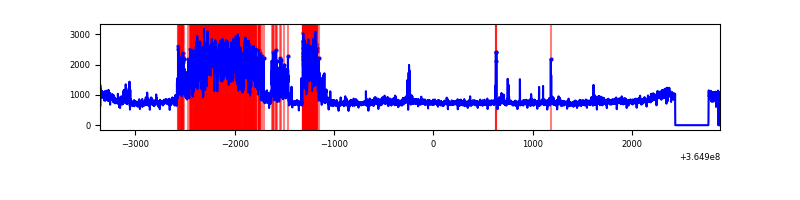 |
| C | 6234 | 5895 | 27 | 27 | 0.43% | 0.46% | 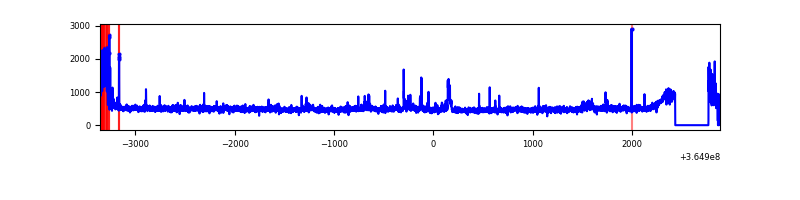 |
| D | 6241 | 5896 | 35 | 35 | 0.56% | 0.59% | 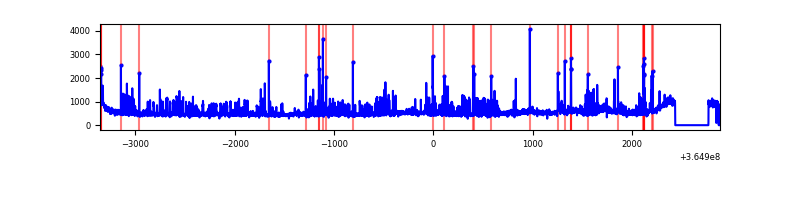 |
Top three noisy pixels from each quadrant. If the there are fewer than three noisy pixels in the level2.evt file, extra rows are filled as -1
| Pixel properties | Quadrant properties | ||||||
|---|---|---|---|---|---|---|---|
| Quadrant | DetID | PixID | Counts | Sigma | Mean | Median | Sigma |
| A | 0 | 13 | 13393 | 84.13 | 743 | 726 | 150.6 |
| A | 13 | 254 | 9535 | 58.5 | 743 | 726 | 150.6 |
| A | 0 | 230 | 8679 | 52.82 | 743 | 726 | 150.6 |
| B | 12 | 1 | 1535081 | 11011.49 | 707 | 688 | 139.3 |
| B | 6 | 159 | 1467610 | 10527.29 | 707 | 688 | 139.3 |
| B | 4 | 80 | 58241 | 413.03 | 707 | 688 | 139.3 |
| C | 0 | 10 | 178262 | 1061.29 | 704 | 707 | 167.3 |
| C | 14 | 238 | 113479 | 674.07 | 704 | 707 | 167.3 |
| C | 3 | 233 | 83350 | 493.98 | 704 | 707 | 167.3 |
| D | 8 | 195 | 582010 | 3383.72 | 718 | 699 | 171.8 |
| D | 12 | 218 | 82433 | 475.76 | 718 | 699 | 171.8 |
| D | 2 | 120 | 63425 | 365.12 | 718 | 699 | 171.8 |
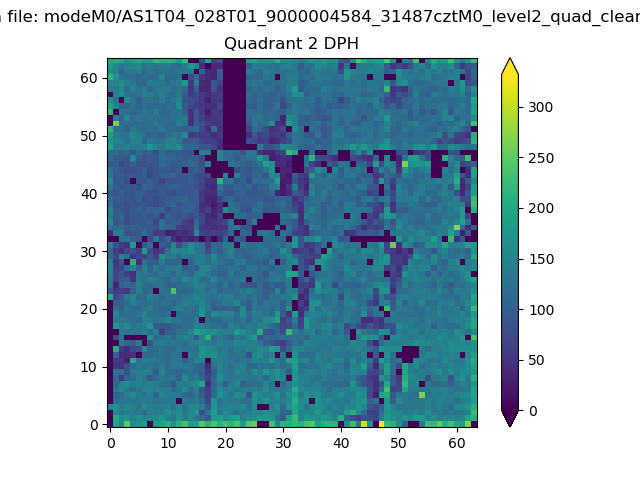
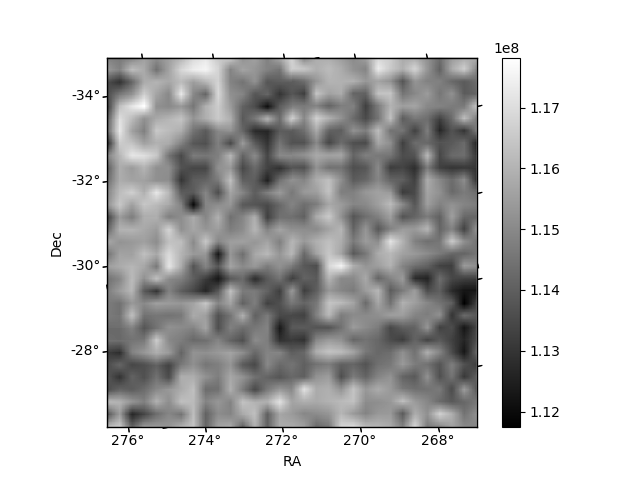
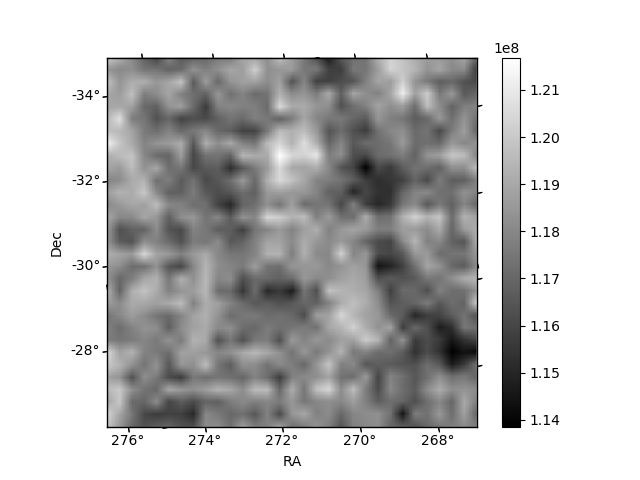
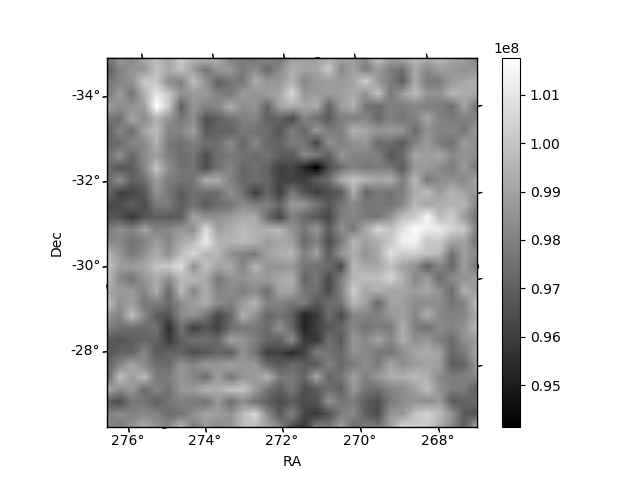
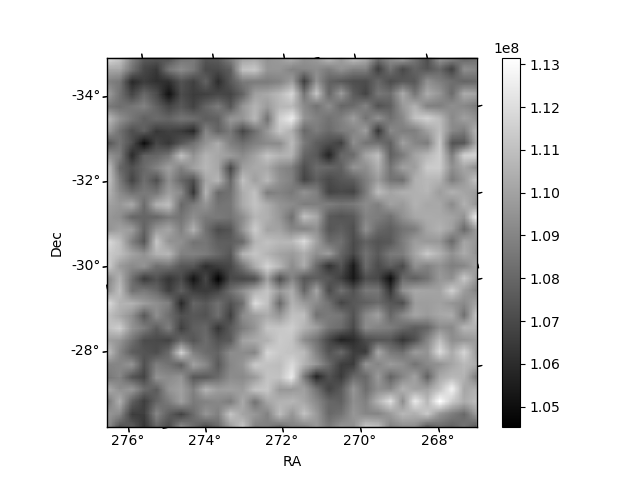
Histogram calculated using DETX and DETY for each event in the final _common_clean file
| Quadrant A | 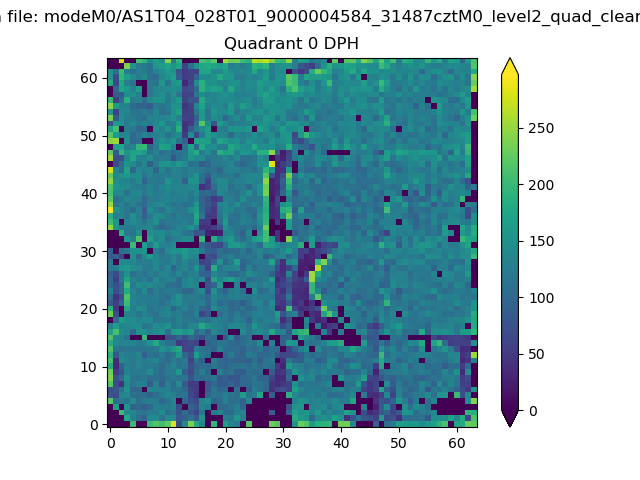 |
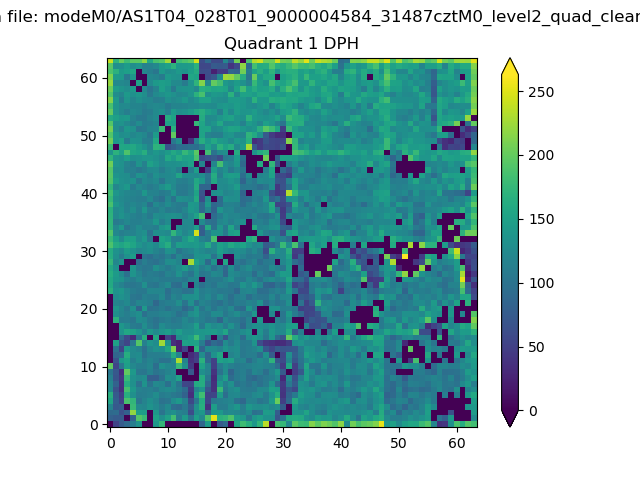 |
Quadrant B |
|---|---|---|---|
| Quadrant D | 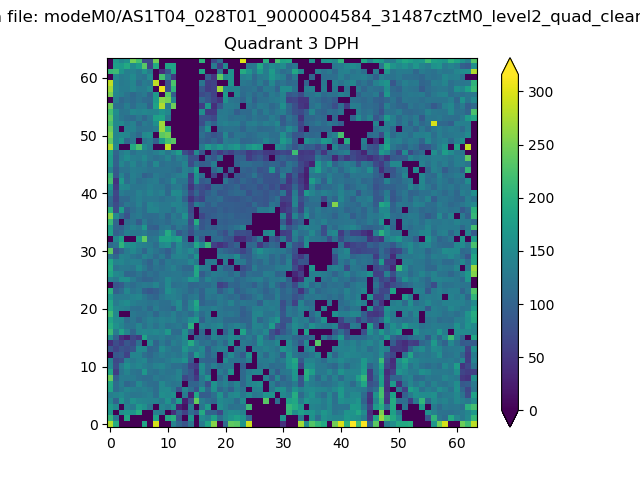 |
 |
Quadrant C |
| Plot type | Count rate plots | Images |
|---|---|---|
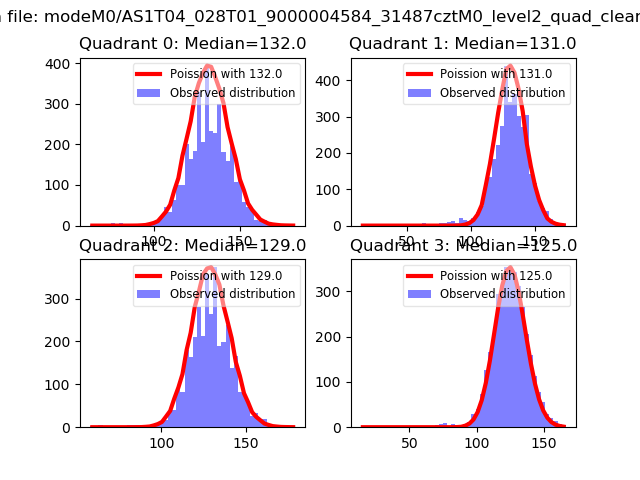
| Comparison with Poisson distribution Blue bars denote a histogram of data divided into 1 sec bins. Red curve is a Poisson curve with rate = median count rate of data. |
 |
 |
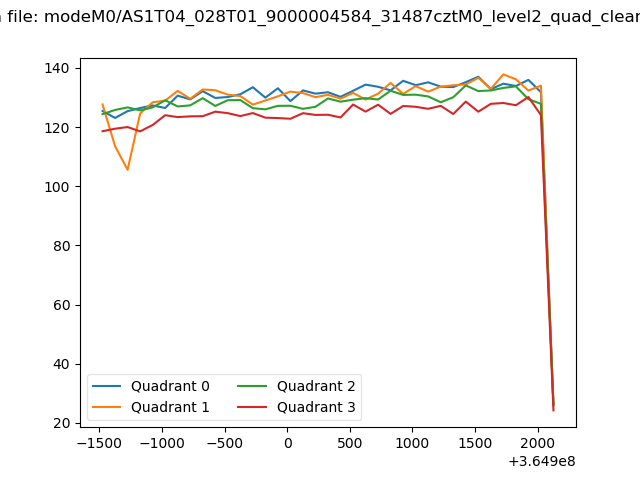
| Quadrant-wise count rates Data is divided into 100 sec bins |
 |
|
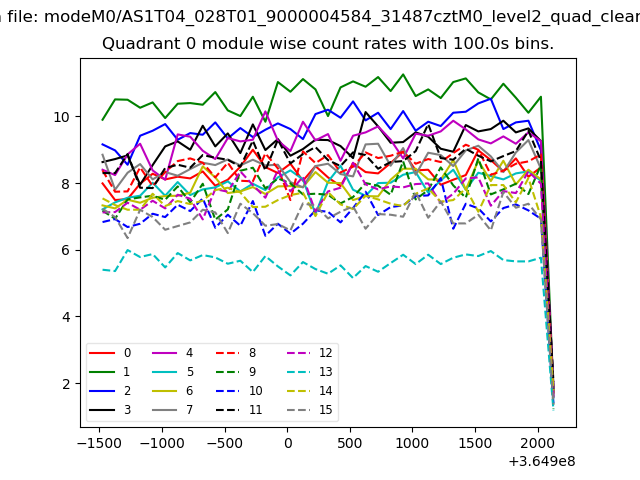
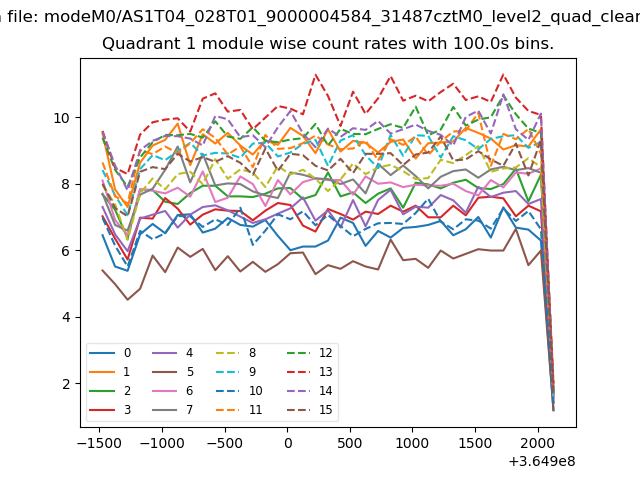
| Module-wise count rates for Quadrant A Data is divided into 100 sec bins |
 |
 |
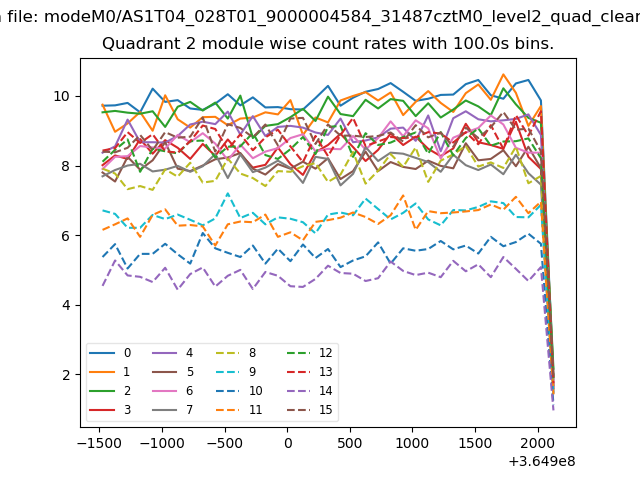
| Module-wise count rates for Quadrant B Data is divided into 100 sec bins |
 |
 |
| Module-wise count rates for Quadrant C Data is divided into 100 sec bins |
 |
 |
| Module-wise count rates for Quadrant D Data is divided into 100 sec bins |
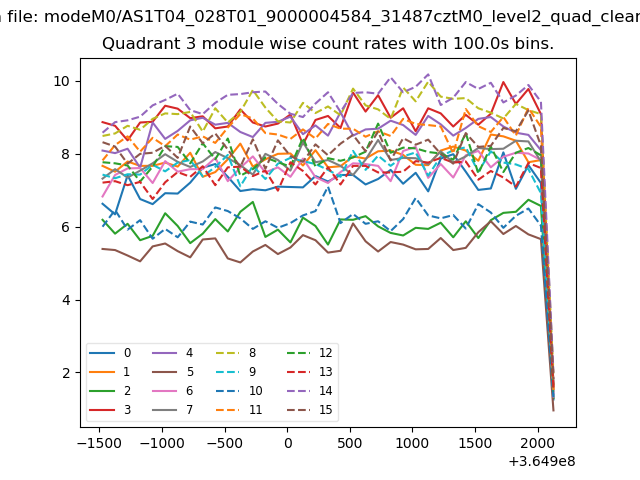 |
 |
| Parameter | Plot |
|---|---|
| CZT HV Monitor | 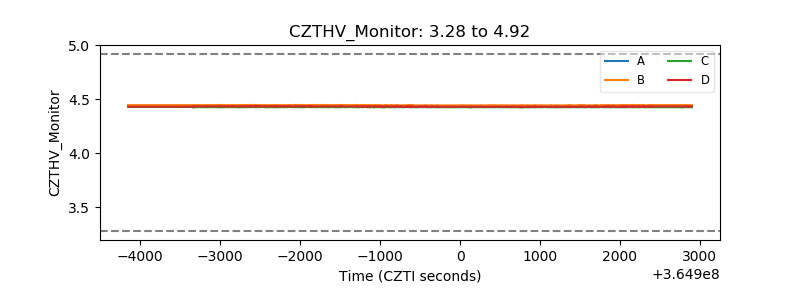 |
| D_VDD | 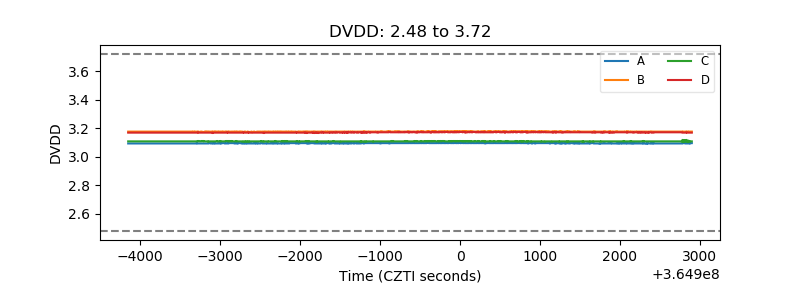 |
| Temperature 1 | 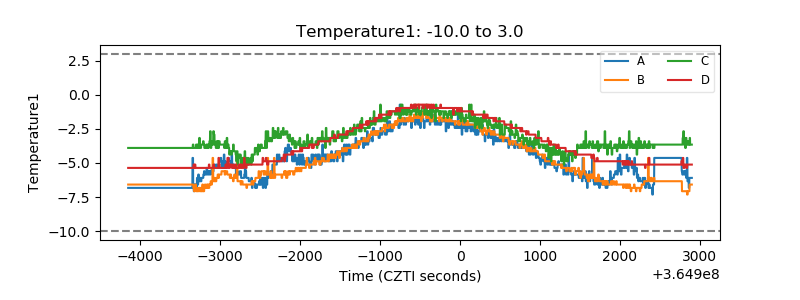 |
| Veto HV Monitor |  |
| Veto LLD | 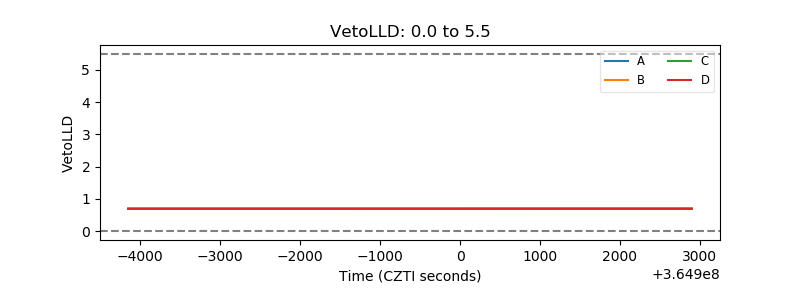 |
| Alpha Counter | 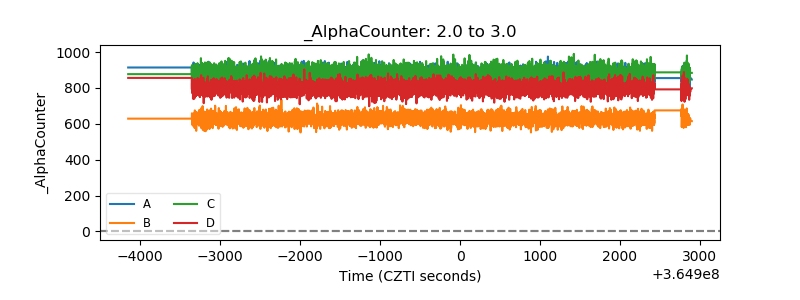 |
| _CPM_Rate | 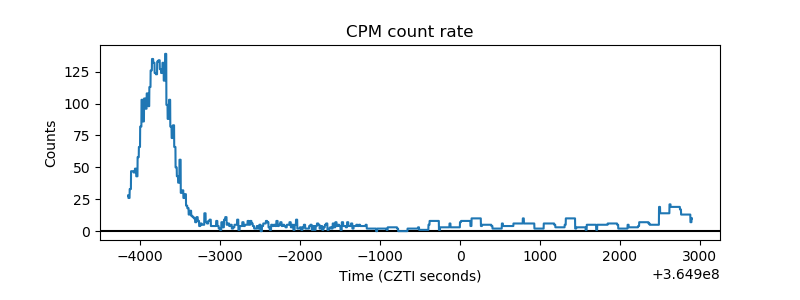 |
| CZT Counter | 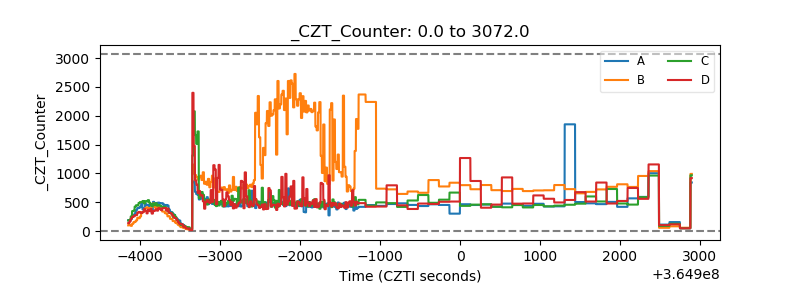 |
| +2.5 Volts monitor |  |
| +5 Volts monitor |  |
| _ROLL_ROT | 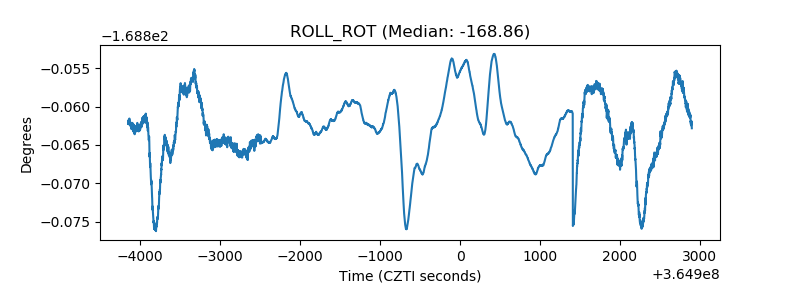 |
| _Roll_DEC | 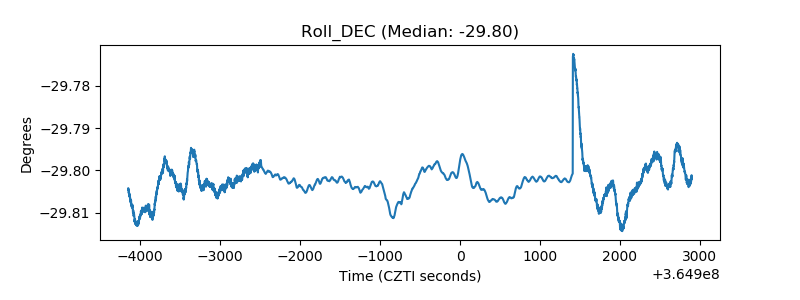 |
| _Roll_RA | 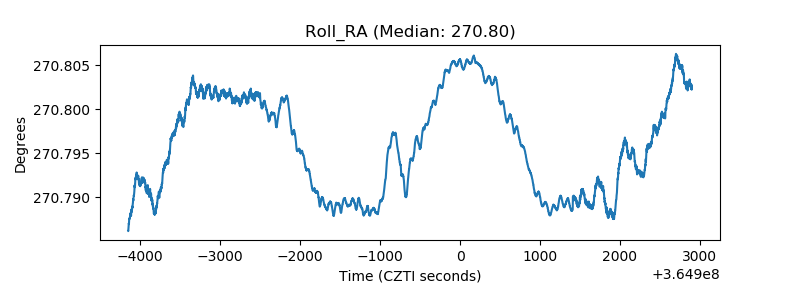 |
| Veto Counter | 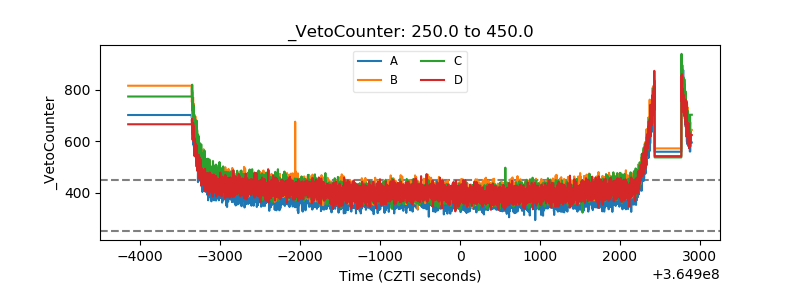 |