| Param | Original file | Final file |
|---|---|---|
| Filename | modeM0/AS1T04_028T01_9000004584_31489cztM0_level2.evt | modeM0/AS1T04_028T01_9000004584_31489cztM0_level2_quad_clean.evt |
| Size (bytes) | 37,825,920 | 10,059,840 |
| Size | 36.1 MB | 9.6 MB |
| Events in quadrant A | 240,608 | 67,461 |
| Events in quadrant B | 357,833 | 66,853 |
| Events in quadrant C | 238,832 | 65,523 |
| Events in quadrant D | 272,010 | 62,606 |
| Mode SS | |||
|---|---|---|---|
| Quadrant | BADHDUFLAG | Total packets | Discarded packets |
| A | 0 | 10 | 0 |
| B | 0 | 10 | 2 |
| C | 0 | 10 | 2 |
| D | 0 | 10 | 2 |
| Mode M0 | |||
|---|---|---|---|
| Quadrant | BADHDUFLAG | Total packets | Discarded packets |
| A | 0 | 1061 | 63 |
| B | 0 | 1560 | 113 |
| C | 0 | 1059 | 62 |
| D | 0 | 1184 | 101 |
| Mode M9 | |||
|---|---|---|---|
| Quadrant | BADHDUFLAG | Total packets | Discarded packets |
| A | 1 | 139731291548456 | 46 |
| B | 1 | -1 | -1 |
| C | 1 | -1 | -1 |
| D | 1 | -1 | -1 |
| Quadrant | Total seconds | Saturated seconds | Saturation percentage |
|---|---|---|---|
| A | 492 | 0 | 0.000000% |
| B | 482 | 1 | 0.207469% |
| C | 491 | 1 | 0.203666% |
| D | 482 | 3 | 0.622407% |
Noise dominated data is calculated using 1-second bins in cleaned event files. If a bin has >2000 counts, and if more than 50% of those come from <1% of pixels, then it is considered to be noise-dominated and hence unusable.
| Quadrant | # 1 sec bins | Bins with >0 counts | Bins with >2000 counts | High rate bins dominated by noise | Noise dominated (total time) | Noise dominated (detector-on time) | Marked lightcurve |
|---|---|---|---|---|---|---|---|
| A | 699 | 502 | 0 | 0 | 0.00% | 0.00% | 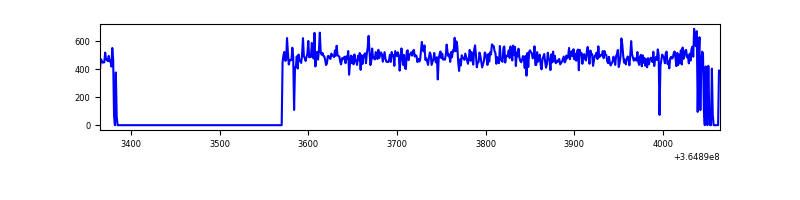 |
| B | 698 | 498 | 0 | 0 | 0.00% | 0.00% |  |
| C | 696 | 505 | 0 | 0 | 0.00% | 0.00% | 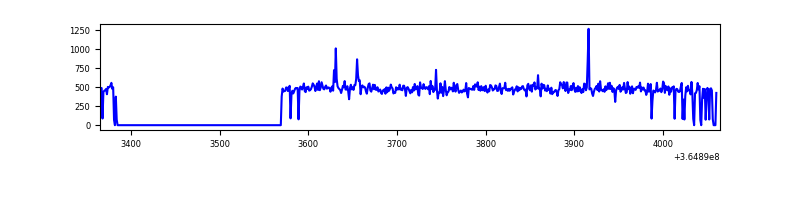 |
| D | 688 | 494 | 3 | 3 | 0.44% | 0.61% | 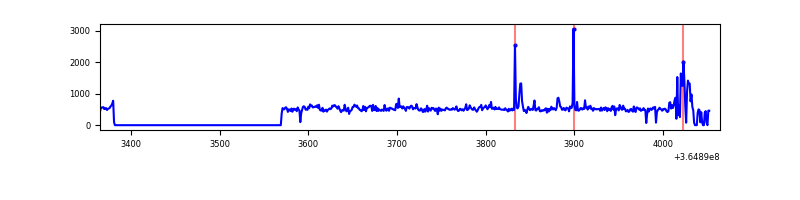 |
Top three noisy pixels from each quadrant. If the there are fewer than three noisy pixels in the level2.evt file, extra rows are filled as -1
| Pixel properties | Quadrant properties | ||||||
|---|---|---|---|---|---|---|---|
| Quadrant | DetID | PixID | Counts | Sigma | Mean | Median | Sigma |
| A | 0 | 13 | 5929 | 408.89 | 60 | 59 | 14.4 |
| A | 13 | 254 | 869 | 56.42 | 60 | 59 | 14.4 |
| A | 3 | 137 | 568 | 35.46 | 60 | 59 | 14.4 |
| B | 6 | 159 | 121145 | 8952.19 | 57 | 56 | 13.5 |
| B | 4 | 80 | 3846 | 280.2 | 57 | 56 | 13.5 |
| B | 0 | 230 | 1677 | 119.84 | 57 | 56 | 13.5 |
| C | 14 | 238 | 9301 | 601.81 | 57 | 57 | 15.4 |
| C | 0 | 10 | 3943 | 252.99 | 57 | 57 | 15.4 |
| C | 2 | 114 | 1084 | 66.86 | 57 | 57 | 15.4 |
| D | 8 | 195 | 31549 | 2027.43 | 57 | 55 | 15.5 |
| D | 2 | 250 | 9192 | 588.19 | 57 | 55 | 15.5 |
| D | 2 | 120 | 8469 | 541.65 | 57 | 55 | 15.5 |
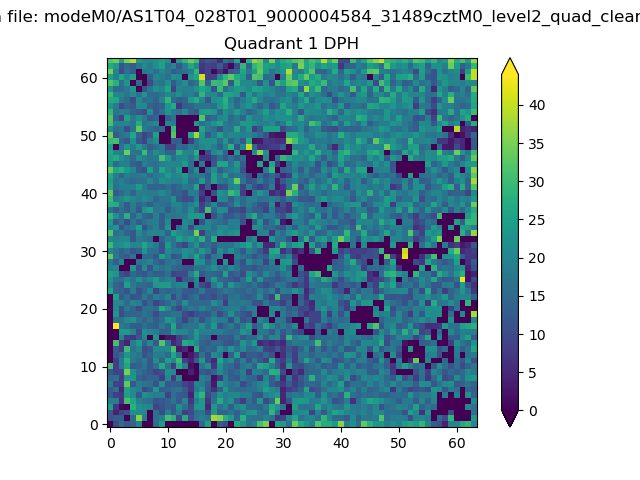
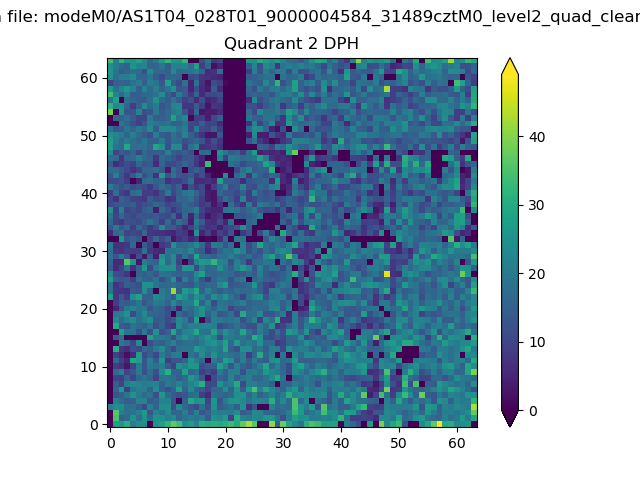
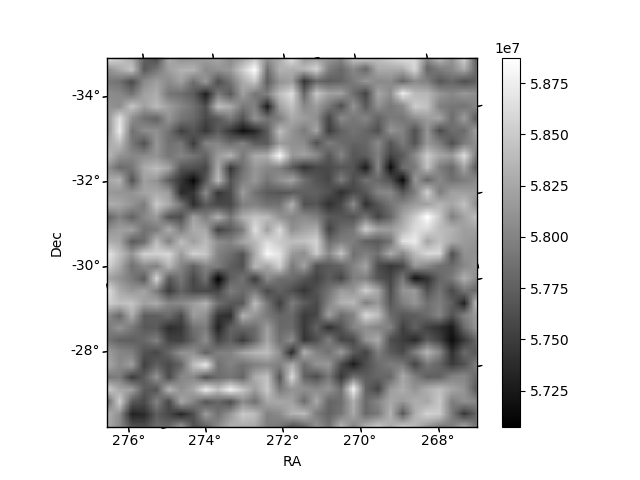
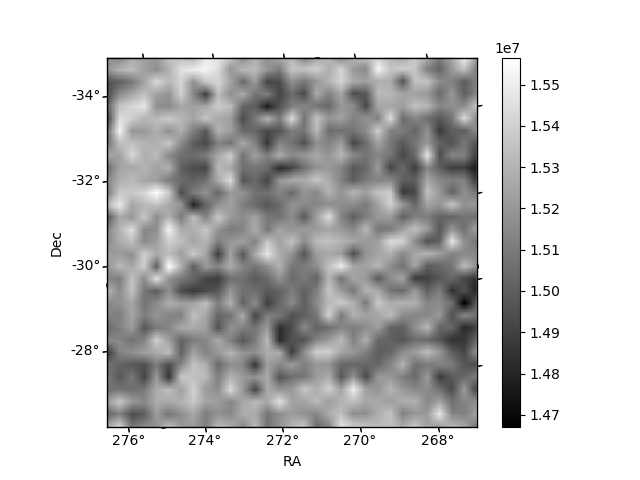
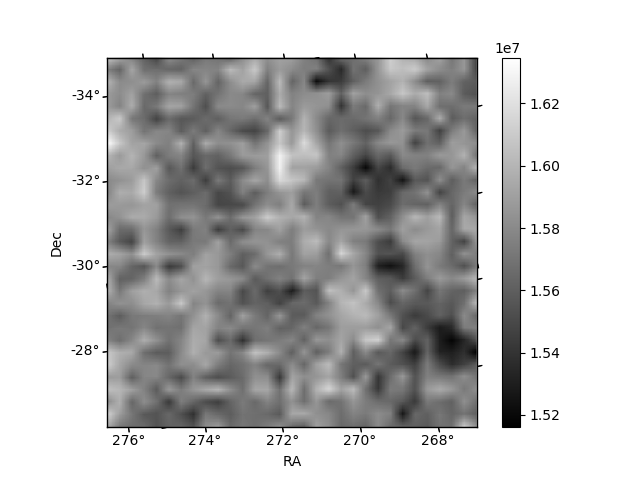
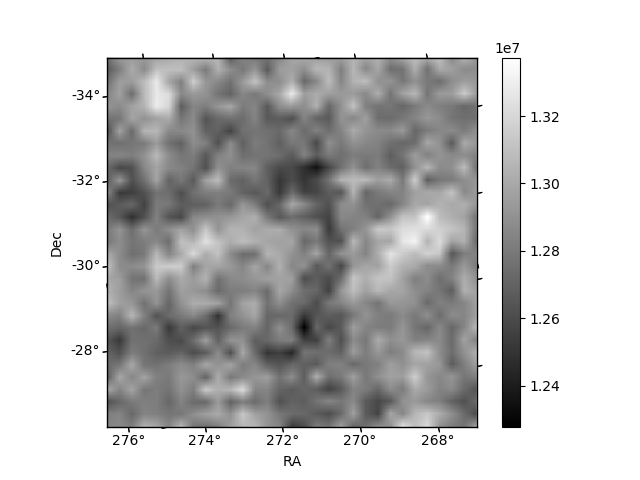
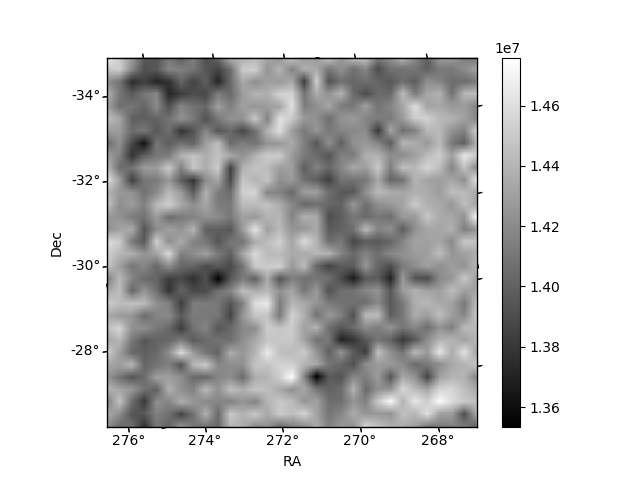
Histogram calculated using DETX and DETY for each event in the final _common_clean file
| Quadrant A | 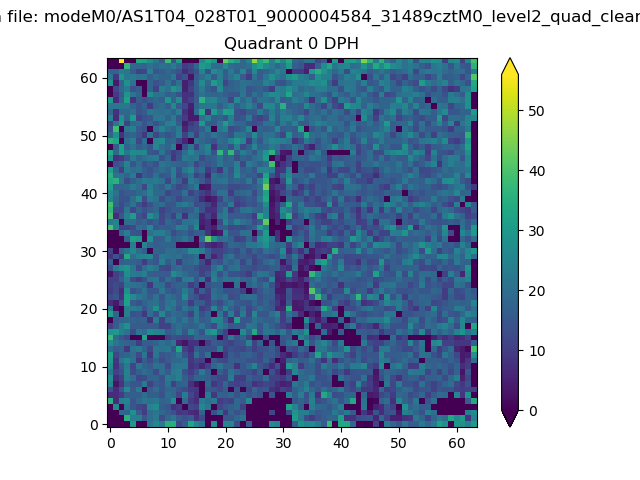 |
 |
Quadrant B |
|---|---|---|---|
| Quadrant D | 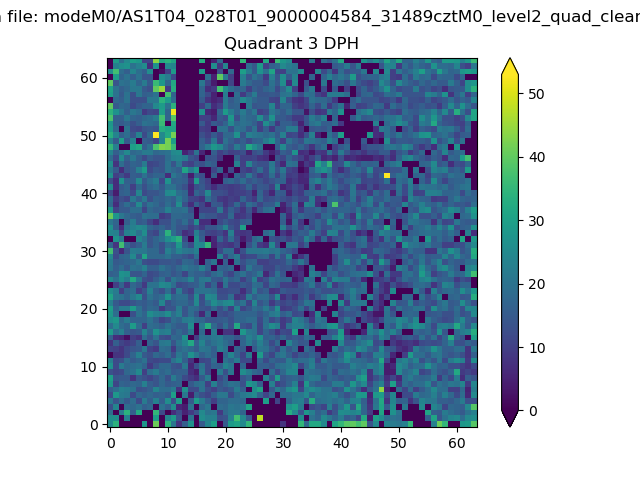 |
 |
Quadrant C |
| Plot type | Count rate plots | Images |
|---|---|---|
| Comparison with Poisson distribution Blue bars denote a histogram of data divided into 1 sec bins. Red curve is a Poisson curve with rate = median count rate of data. |
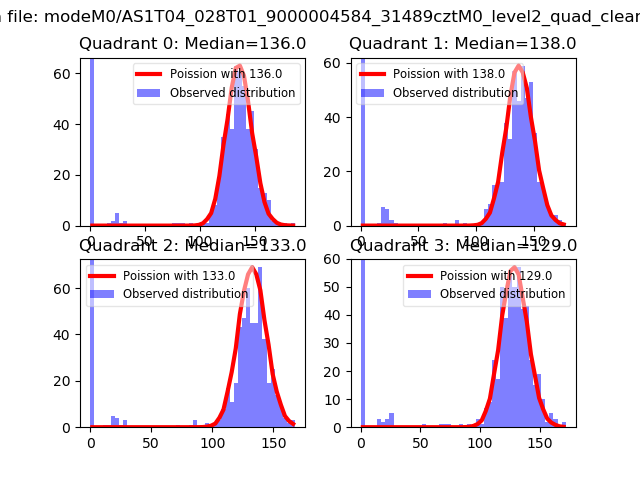 |
 |
| Quadrant-wise count rates Data is divided into 100 sec bins |
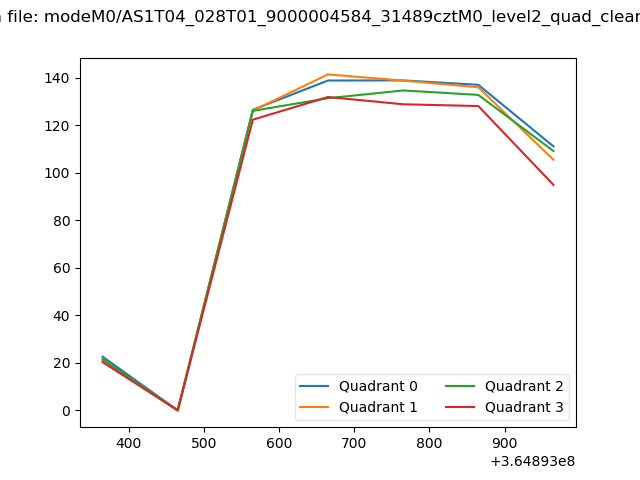 |
|
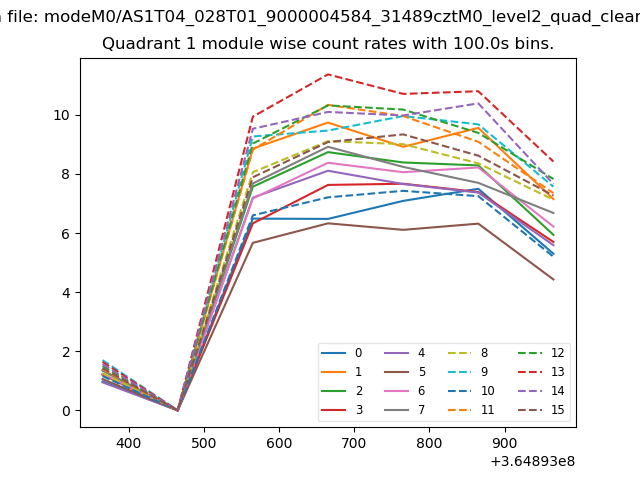
| Module-wise count rates for Quadrant A Data is divided into 100 sec bins |
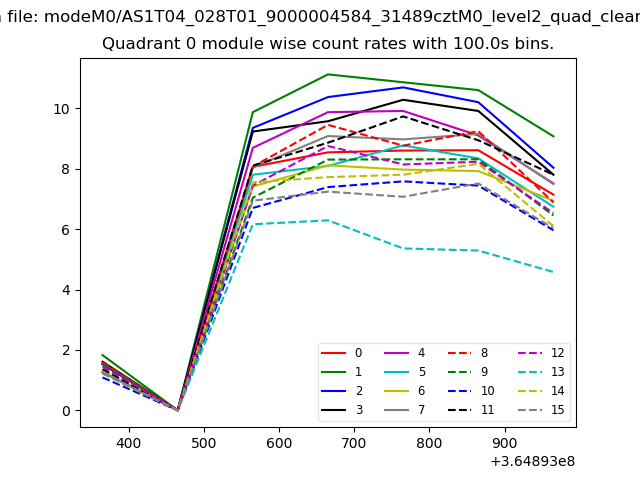 |
 |
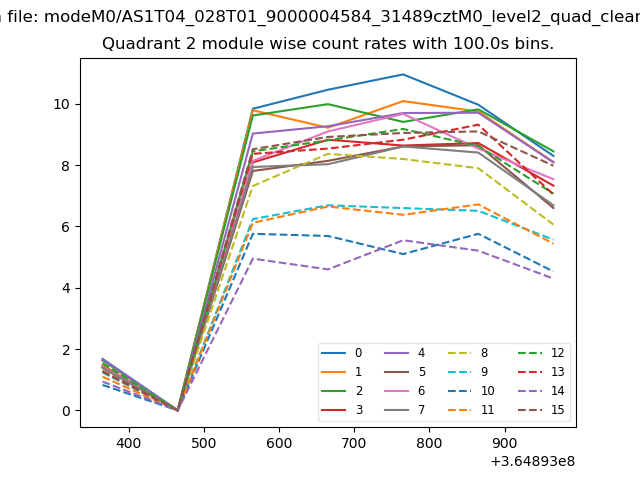
| Module-wise count rates for Quadrant B Data is divided into 100 sec bins |
 |
 |
| Module-wise count rates for Quadrant C Data is divided into 100 sec bins |
 |
 |
| Module-wise count rates for Quadrant D Data is divided into 100 sec bins |
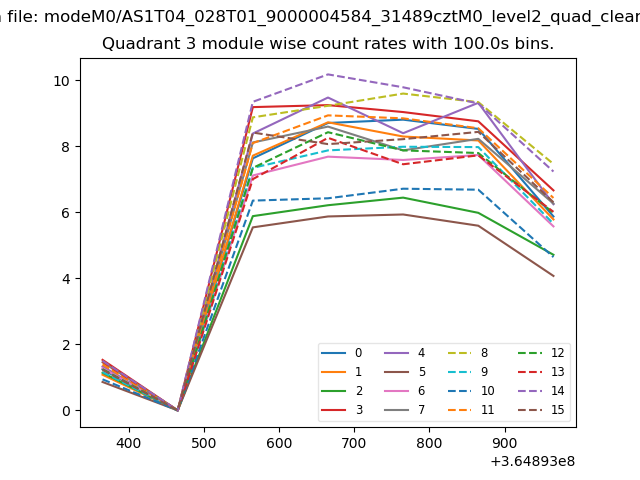 |
 |
| Parameter | Plot |
|---|---|
| CZT HV Monitor | 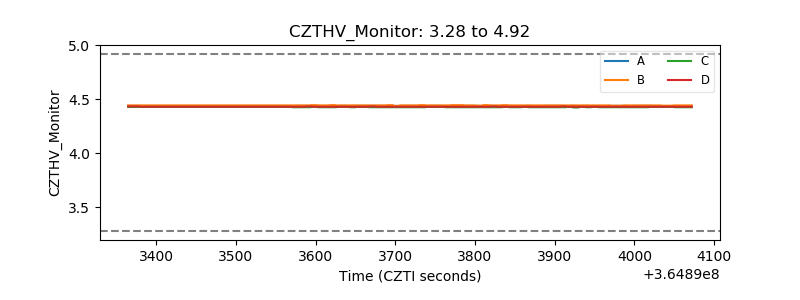 |
| D_VDD | 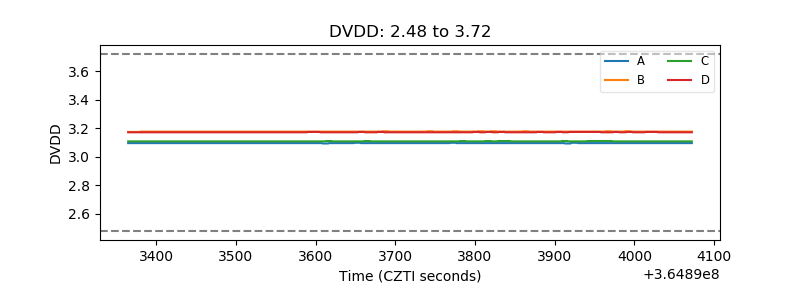 |
| Temperature 1 | 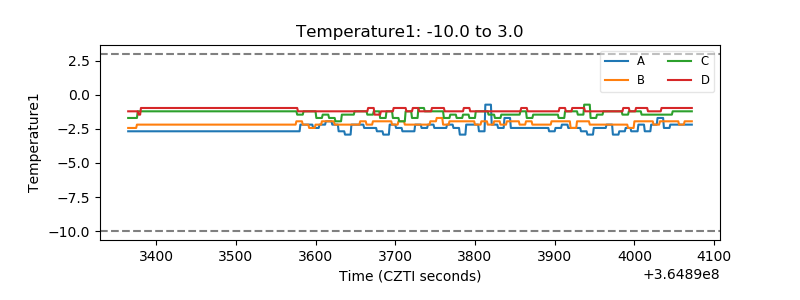 |
| Veto HV Monitor | 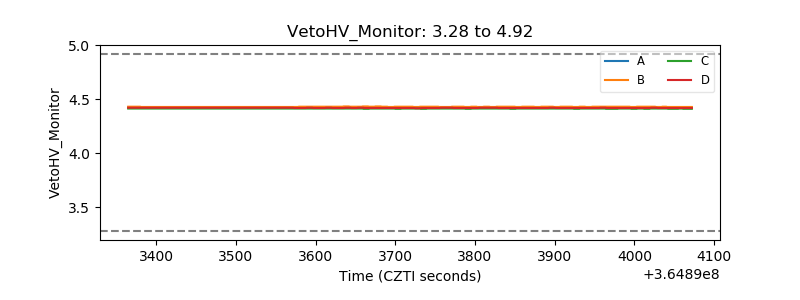 |
| Veto LLD | 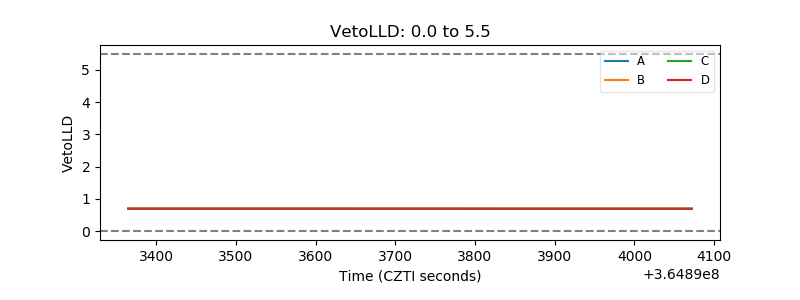 |
| Alpha Counter | 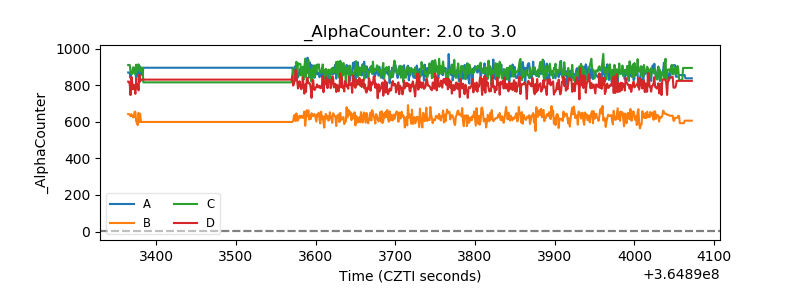 |
| _CPM_Rate | 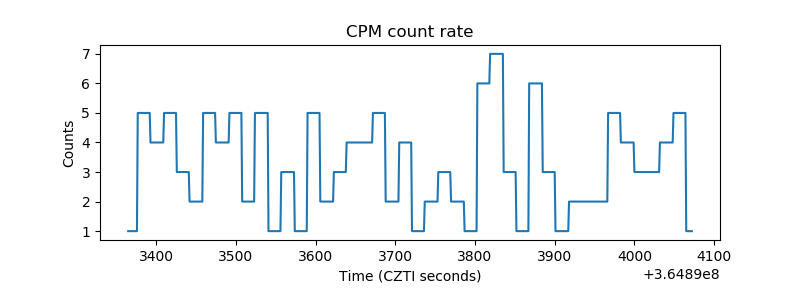 |
| CZT Counter | 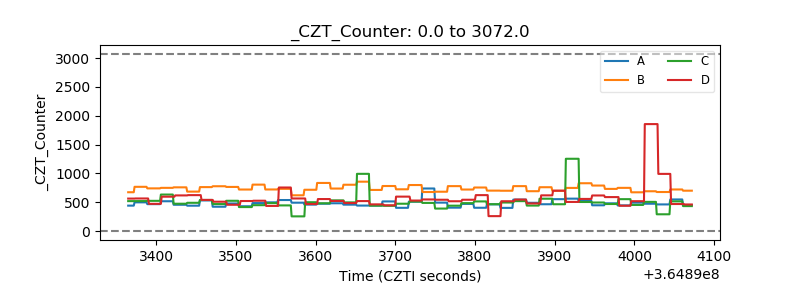 |
| +2.5 Volts monitor |  |
| +5 Volts monitor |  |
| _ROLL_ROT | 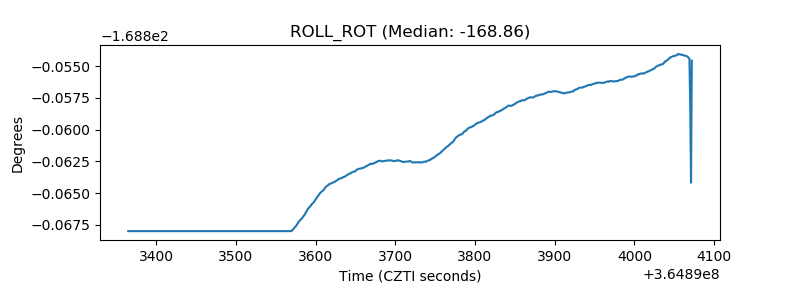 |
| _Roll_DEC | 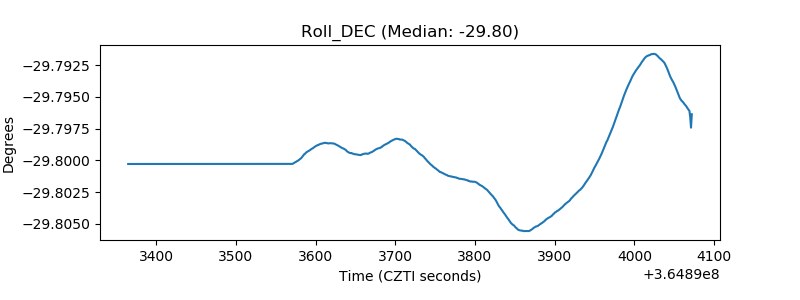 |
| _Roll_RA | 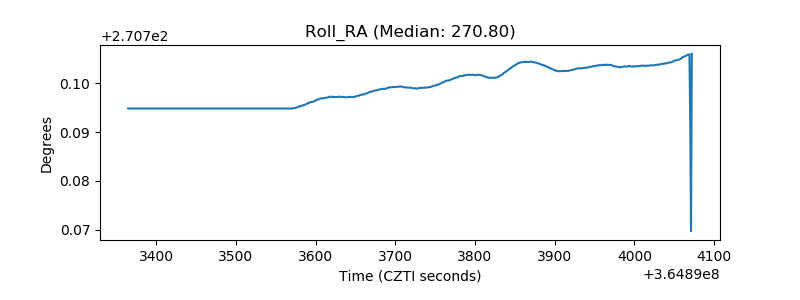 |
| Veto Counter | 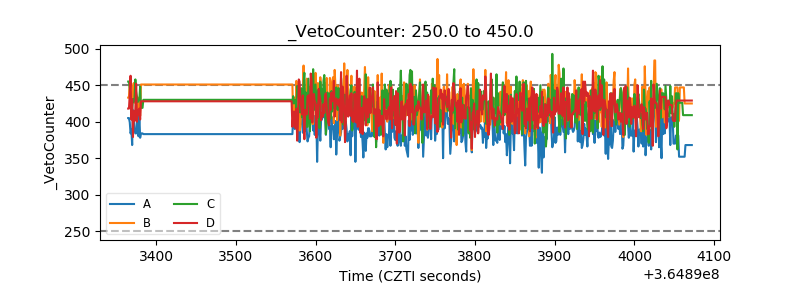 |