| Param | Original file | Final file |
|---|---|---|
| Filename | modeM0/AS1T04_028T01_9000004584_31491cztM0_level2.evt | modeM0/AS1T04_028T01_9000004584_31491cztM0_level2_quad_clean.evt |
| Size (bytes) | 278,723,520 | 37,402,560 |
| Size | 265.8 MB | 35.7 MB |
| Events in quadrant A | 1,732,648 | 231,784 |
| Events in quadrant B | 2,602,675 | 230,761 |
| Events in quadrant C | 1,721,220 | 227,226 |
| Events in quadrant D | 2,163,537 | 212,388 |
| Mode SS | |||
|---|---|---|---|
| Quadrant | BADHDUFLAG | Total packets | Discarded packets |
| A | 0 | 76 | 10 |
| B | 0 | 74 | 8 |
| C | 0 | 75 | 9 |
| D | 0 | 71 | 5 |
| Mode M0 | |||
|---|---|---|---|
| Quadrant | BADHDUFLAG | Total packets | Discarded packets |
| A | 0 | 8183 | 1098 |
| B | 0 | 11721 | 1794 |
| C | 0 | 8081 | 1086 |
| D | 0 | 9948 | 1485 |
| Mode M9 | |||
|---|---|---|---|
| Quadrant | BADHDUFLAG | Total packets | Discarded packets |
| A | 0 | 1 | 1 |
| B | 1 | 1 | 1 |
| C | 1 | -1 | -1 |
| D | 1 | -1 | -1 |
| Quadrant | Total seconds | Saturated seconds | Saturation percentage |
|---|---|---|---|
| A | 3230 | 28 | 0.866873% |
| B | 3232 | 37 | 1.144802% |
| C | 3245 | 30 | 0.924499% |
| D | 3223 | 109 | 3.381942% |
Noise dominated data is calculated using 1-second bins in cleaned event files. If a bin has >2000 counts, and if more than 50% of those come from <1% of pixels, then it is considered to be noise-dominated and hence unusable.
| Quadrant | # 1 sec bins | Bins with >0 counts | Bins with >2000 counts | High rate bins dominated by noise | Noise dominated (total time) | Noise dominated (detector-on time) | Marked lightcurve |
|---|---|---|---|---|---|---|---|
| A | 10330 | 3269 | 15 | 15 | 0.15% | 0.46% | 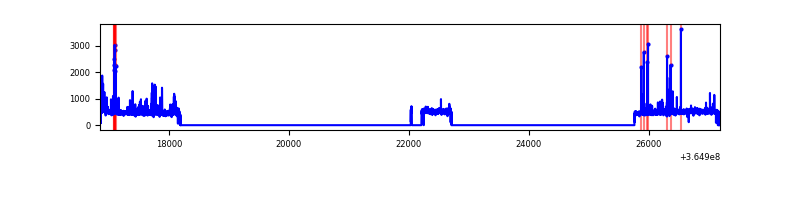 |
| B | 10321 | 3257 | 6 | 6 | 0.06% | 0.18% | 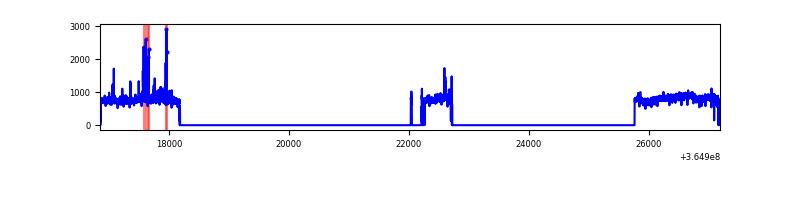 |
| C | 10332 | 3276 | 0 | 0 | 0.00% | 0.00% | 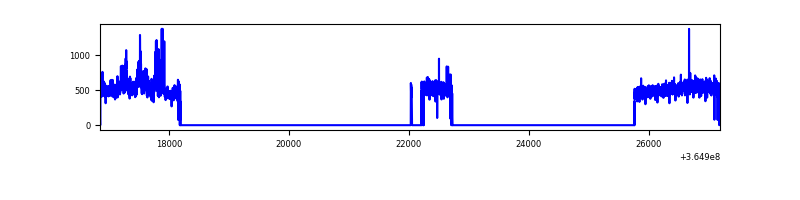 |
| D | 10323 | 3262 | 103 | 103 | 1.00% | 3.16% | 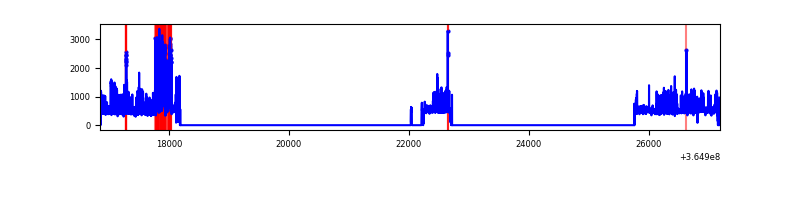 |
Top three noisy pixels from each quadrant. If the there are fewer than three noisy pixels in the level2.evt file, extra rows are filled as -1
| Pixel properties | Quadrant properties | ||||||
|---|---|---|---|---|---|---|---|
| Quadrant | DetID | PixID | Counts | Sigma | Mean | Median | Sigma |
| A | 0 | 13 | 207393 | 2543.27 | 395 | 387 | 81.4 |
| A | 13 | 254 | 5173 | 58.8 | 395 | 387 | 81.4 |
| A | 3 | 137 | 4097 | 45.58 | 395 | 387 | 81.4 |
| B | 6 | 159 | 908904 | 11636.09 | 391 | 381 | 78.1 |
| B | 12 | 1 | 36009 | 456.31 | 391 | 381 | 78.1 |
| B | 0 | 245 | 34212 | 433.3 | 391 | 381 | 78.1 |
| C | 3 | 233 | 118277 | 1291.27 | 381 | 382 | 91.3 |
| C | 14 | 238 | 60889 | 662.71 | 381 | 382 | 91.3 |
| C | 0 | 10 | 43571 | 473.04 | 381 | 382 | 91.3 |
| D | 8 | 195 | 359466 | 3919.47 | 375 | 364 | 91.6 |
| D | 13 | 249 | 264638 | 2884.46 | 375 | 364 | 91.6 |
| D | 12 | 218 | 32124 | 346.65 | 375 | 364 | 91.6 |
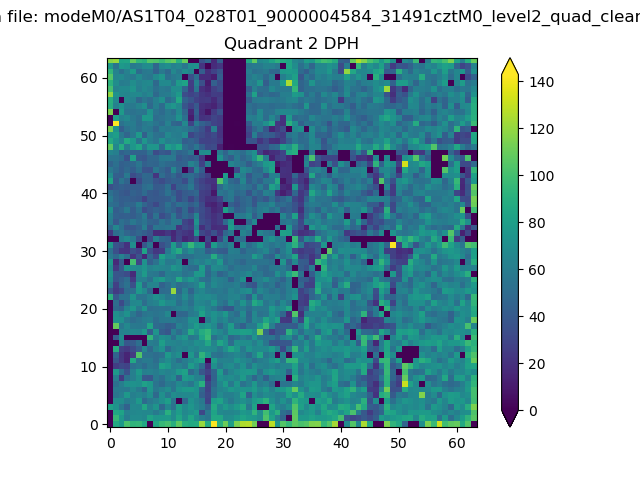
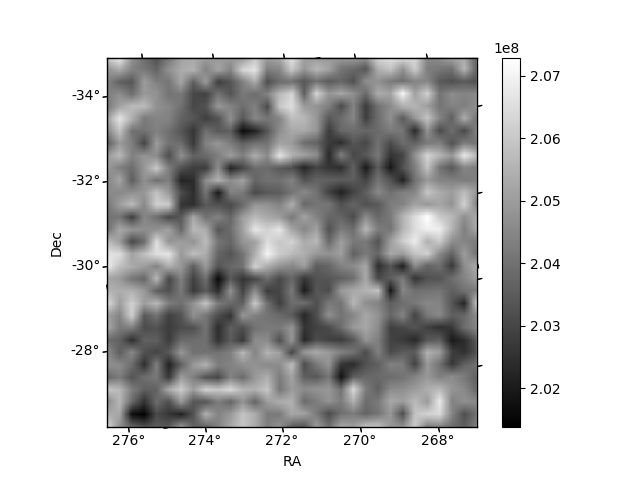
Histogram calculated using DETX and DETY for each event in the final _common_clean file
| Quadrant A | 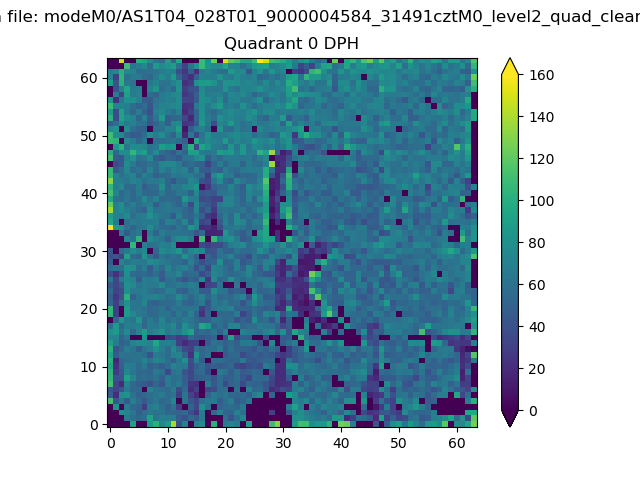 |
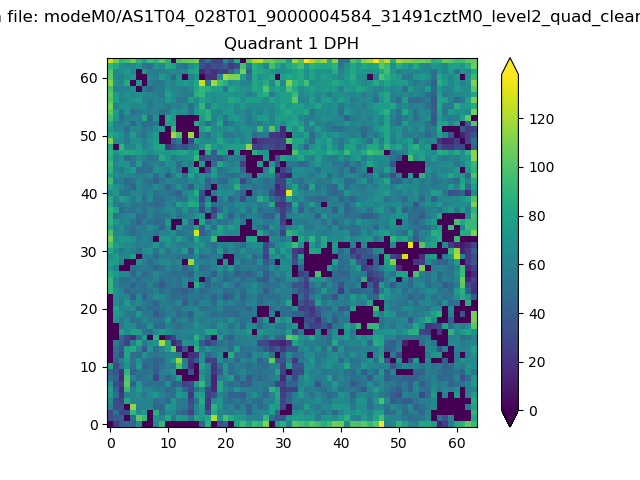 |
Quadrant B |
|---|---|---|---|
| Quadrant D | 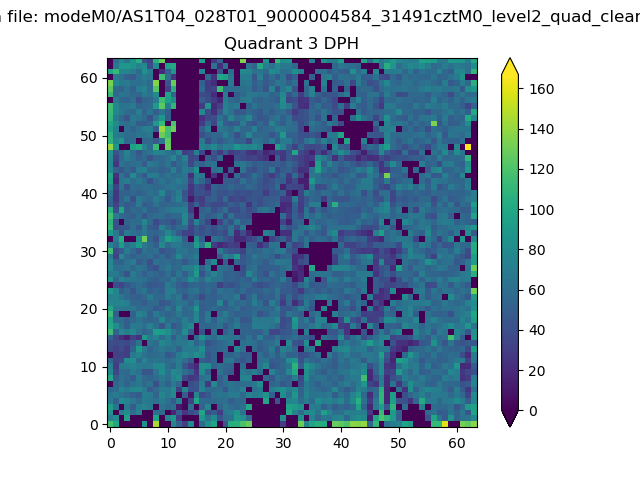 |
 |
Quadrant C |
| Plot type | Count rate plots | Images |
|---|---|---|
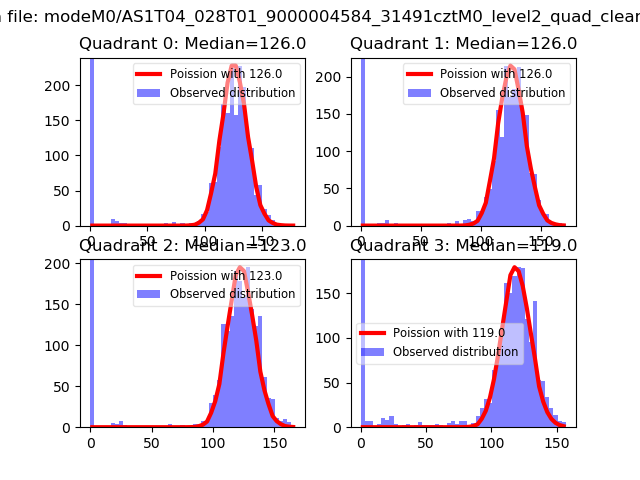
| Comparison with Poisson distribution Blue bars denote a histogram of data divided into 1 sec bins. Red curve is a Poisson curve with rate = median count rate of data. |
 |
 |
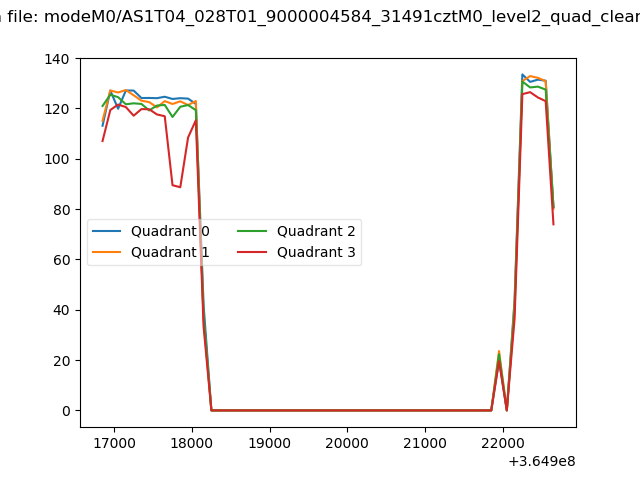
| Quadrant-wise count rates Data is divided into 100 sec bins |
 |
|
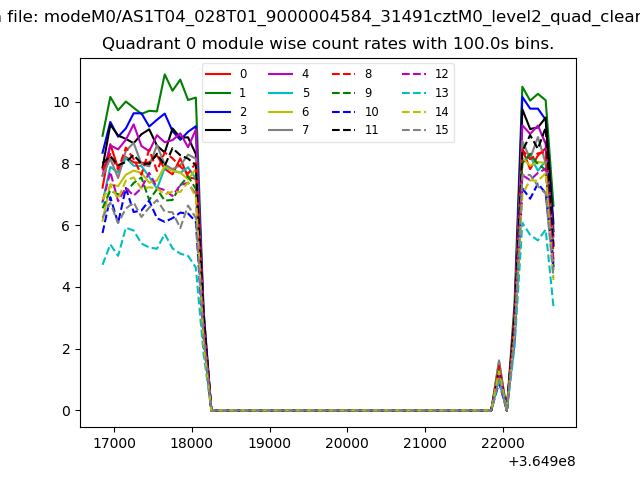
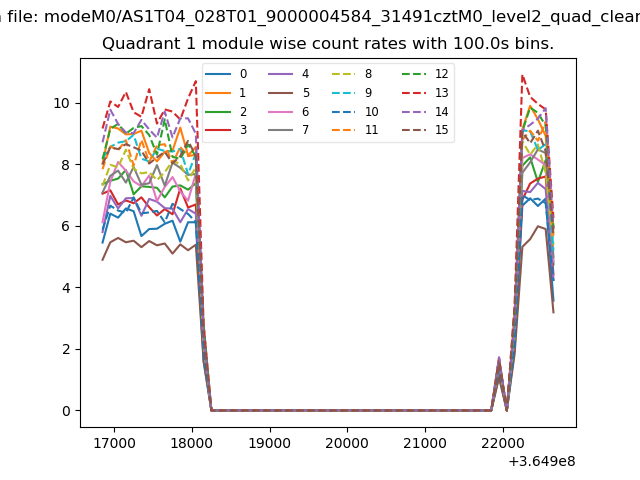
| Module-wise count rates for Quadrant A Data is divided into 100 sec bins |
 |
 |
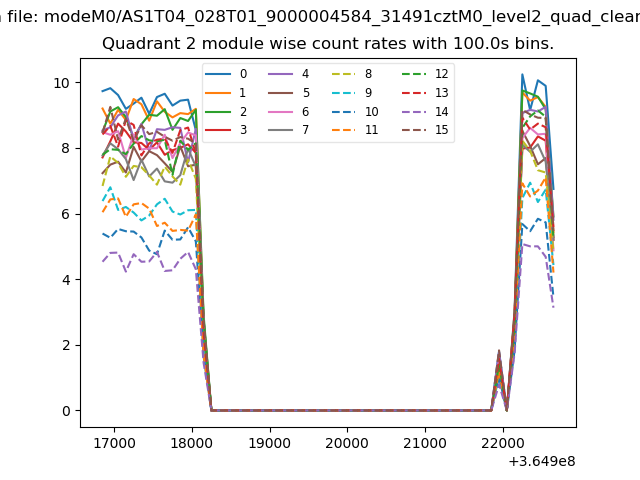
| Module-wise count rates for Quadrant B Data is divided into 100 sec bins |
 |
 |
| Module-wise count rates for Quadrant C Data is divided into 100 sec bins |
 |
 |
| Module-wise count rates for Quadrant D Data is divided into 100 sec bins |
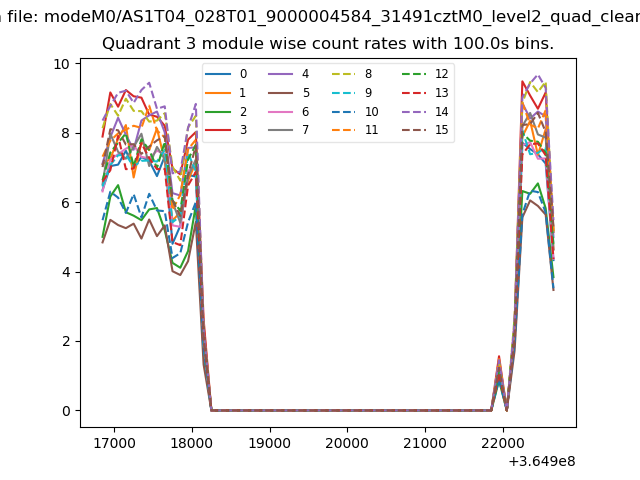 |
 |
| Parameter | Plot |
|---|---|
| CZT HV Monitor | 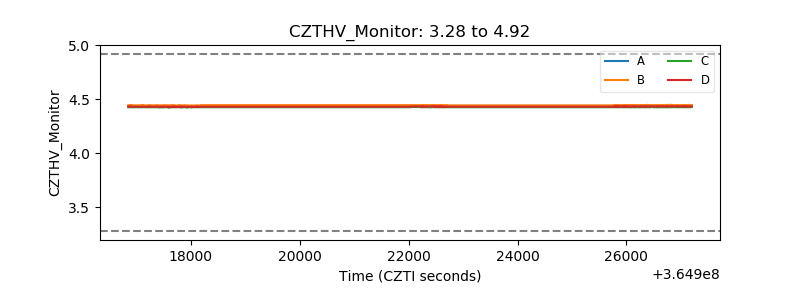 |
| D_VDD |  |
| Temperature 1 | 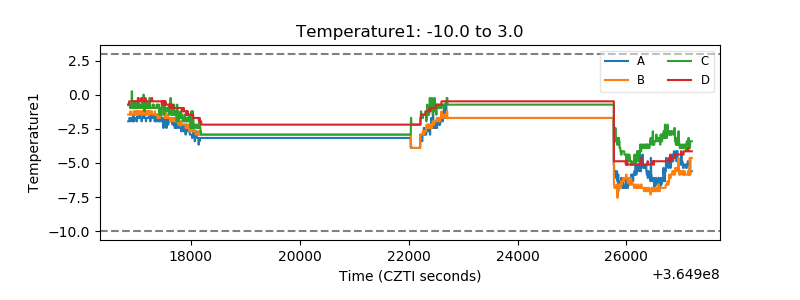 |
| Veto HV Monitor | 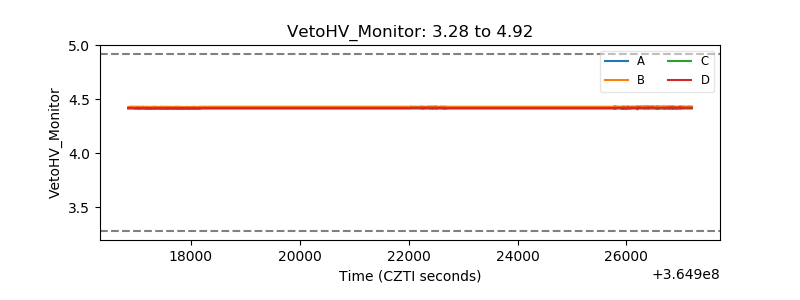 |
| Veto LLD |  |
| Alpha Counter | 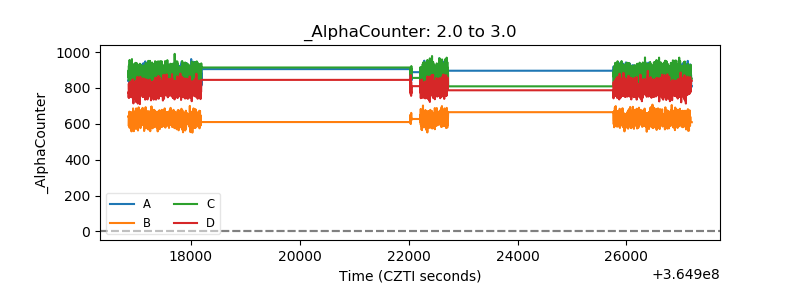 |
| _CPM_Rate | 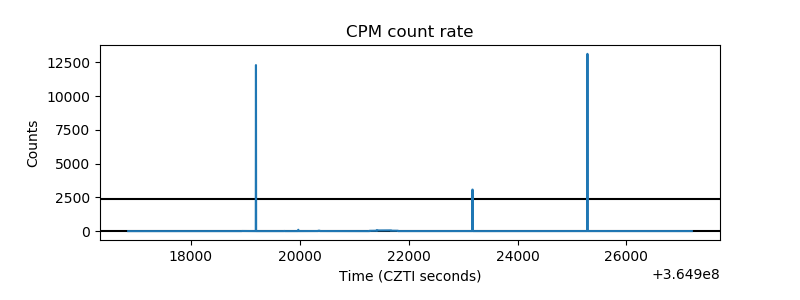 |
| CZT Counter | 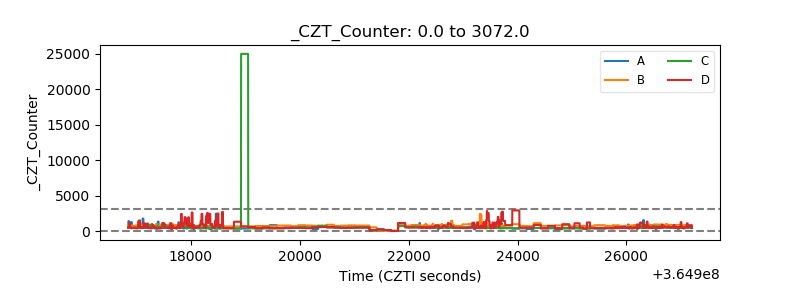 |
| +2.5 Volts monitor |  |
| +5 Volts monitor |  |
| _ROLL_ROT | 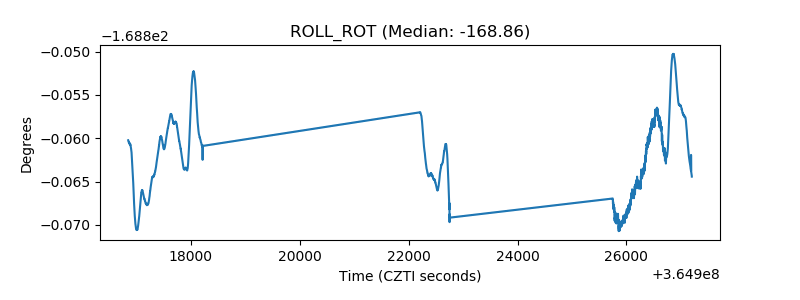 |
| _Roll_DEC | 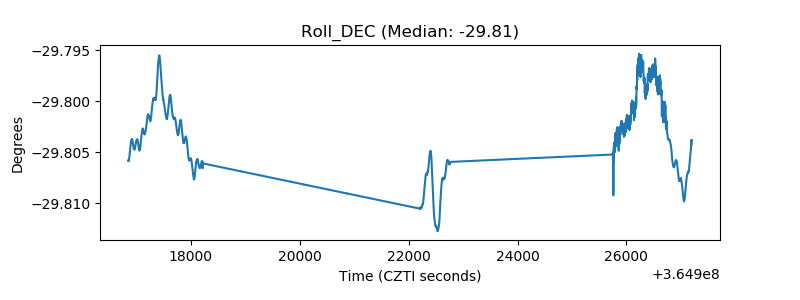 |
| _Roll_RA | 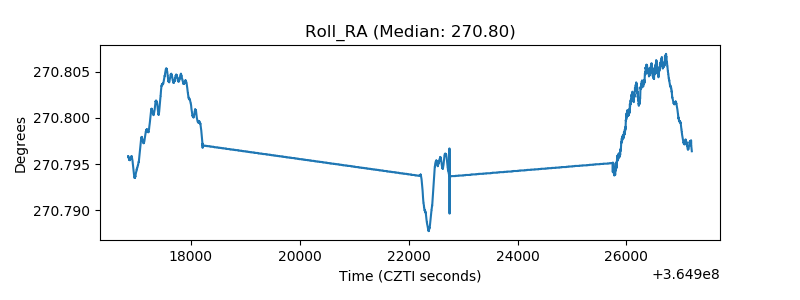 |
| Veto Counter | 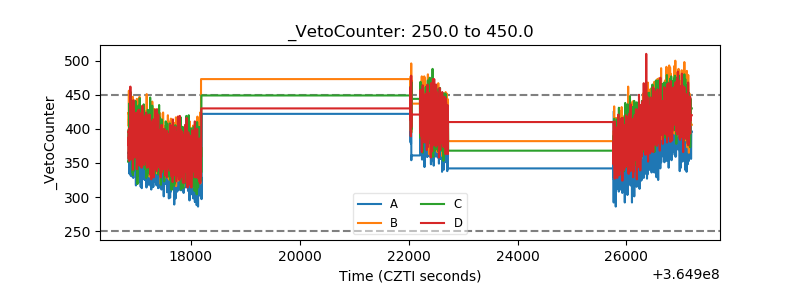 |