| Param | Original file | Final file |
|---|---|---|
| Filename | modeM0/AS1T04_028T01_9000004584_31492cztM0_level2.evt | modeM0/AS1T04_028T01_9000004584_31492cztM0_level2_quad_clean.evt |
| Size (bytes) | 3,939,163,200 | 540,984,960 |
| Size | 3.7 GB | 515.9 MB |
| Events in quadrant A | 22,295,001 | 3,478,353 |
| Events in quadrant B | 42,459,261 | 3,346,312 |
| Events in quadrant C | 23,326,769 | 3,390,779 |
| Events in quadrant D | 28,351,669 | 3,243,808 |
| Mode SS | |||
|---|---|---|---|
| Quadrant | BADHDUFLAG | Total packets | Discarded packets |
| A | 0 | 868 | 2 |
| B | 0 | 868 | 2 |
| C | 0 | 868 | 2 |
| D | 0 | 868 | 4 |
| Mode M0 | |||
|---|---|---|---|
| Quadrant | BADHDUFLAG | Total packets | Discarded packets |
| A | 0 | 93307 | 274 |
| B | 0 | 157550 | 929 |
| C | 0 | 95243 | 219 |
| D | 0 | 111848 | 249 |
| Mode M9 | |||
|---|---|---|---|
| Quadrant | BADHDUFLAG | Total packets | Discarded packets |
| A | 0 | 54 | 0 |
| B | 0 | 54 | 0 |
| C | 0 | 55 | 0 |
| D | 0 | 55 | 0 |
| Quadrant | Total seconds | Saturated seconds | Saturation percentage |
|---|---|---|---|
| A | 42621 | 1043 | 2.447150% |
| B | 42570 | 5823 | 13.678647% |
| C | 42635 | 1494 | 3.504163% |
| D | 42630 | 1836 | 4.306826% |
Noise dominated data is calculated using 1-second bins in cleaned event files. If a bin has >2000 counts, and if more than 50% of those come from <1% of pixels, then it is considered to be noise-dominated and hence unusable.
| Quadrant | # 1 sec bins | Bins with >0 counts | Bins with >2000 counts | High rate bins dominated by noise | Noise dominated (total time) | Noise dominated (detector-on time) | Marked lightcurve |
|---|---|---|---|---|---|---|---|
| A | 56825 | 42681 | 235 | 235 | 0.41% | 0.55% | 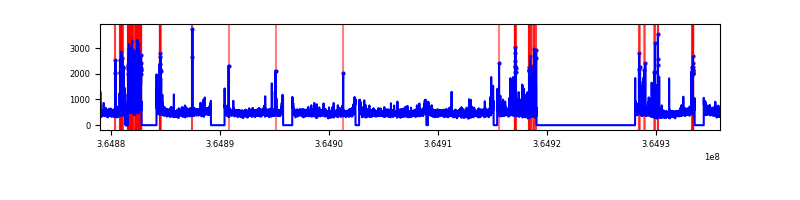 |
| B | 56826 | 42601 | 4324 | 4324 | 7.61% | 10.15% | 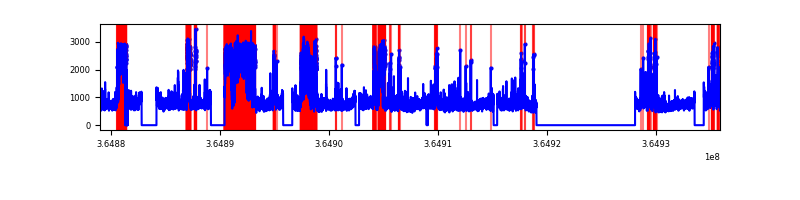 |
| C | 56826 | 42688 | 346 | 346 | 0.61% | 0.81% | 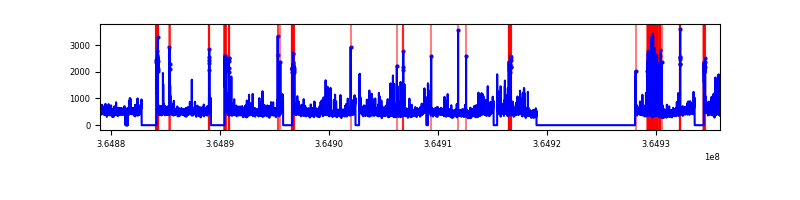 |
| D | 56826 | 42679 | 1136 | 1136 | 2.00% | 2.66% | 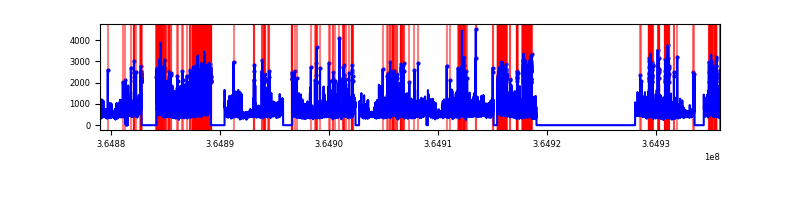 |
Top three noisy pixels from each quadrant. If the there are fewer than three noisy pixels in the level2.evt file, extra rows are filled as -1
| Pixel properties | Quadrant properties | ||||||
|---|---|---|---|---|---|---|---|
| Quadrant | DetID | PixID | Counts | Sigma | Mean | Median | Sigma |
| A | 0 | 13 | 1727797 | 1617.85 | 5330 | 5213 | 1064.7 |
| A | 13 | 254 | 72329 | 63.03 | 5330 | 5213 | 1064.7 |
| A | 3 | 137 | 54248 | 46.05 | 5330 | 5213 | 1064.7 |
| B | 6 | 159 | 10812020 | 11395.48 | 4969 | 4836 | 948.4 |
| B | 12 | 1 | 10652688 | 11227.47 | 4969 | 4836 | 948.4 |
| B | 5 | 172 | 436234 | 454.88 | 4969 | 4836 | 948.4 |
| C | 3 | 233 | 1115861 | 931.3 | 5091 | 5126 | 1192.7 |
| C | 0 | 10 | 1064511 | 888.25 | 5091 | 5126 | 1192.7 |
| C | 14 | 238 | 824316 | 686.85 | 5091 | 5126 | 1192.7 |
| D | 8 | 195 | 4126401 | 3405.62 | 5102 | 4972 | 1210.2 |
| D | 12 | 218 | 2273620 | 1874.63 | 5102 | 4972 | 1210.2 |
| D | 13 | 249 | 1222214 | 1005.83 | 5102 | 4972 | 1210.2 |
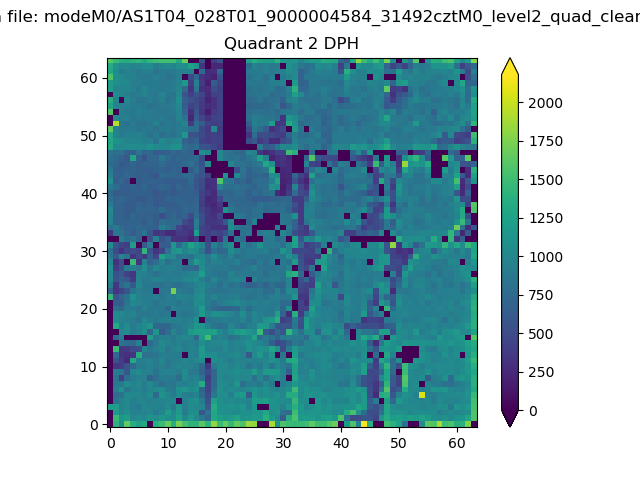
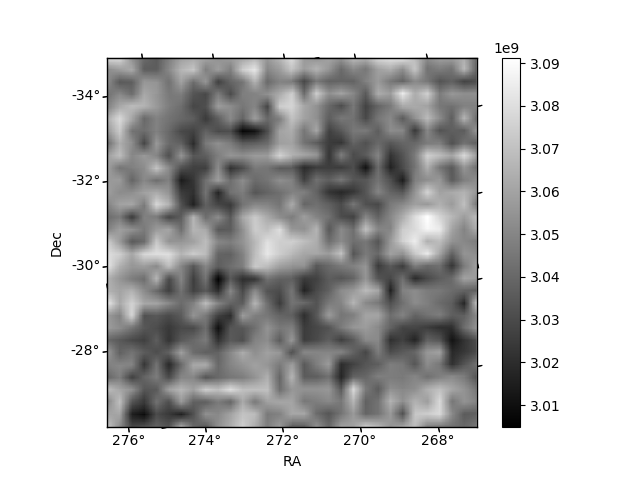
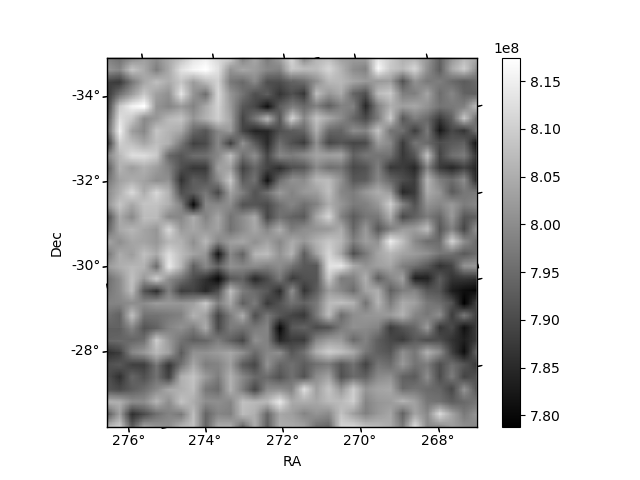
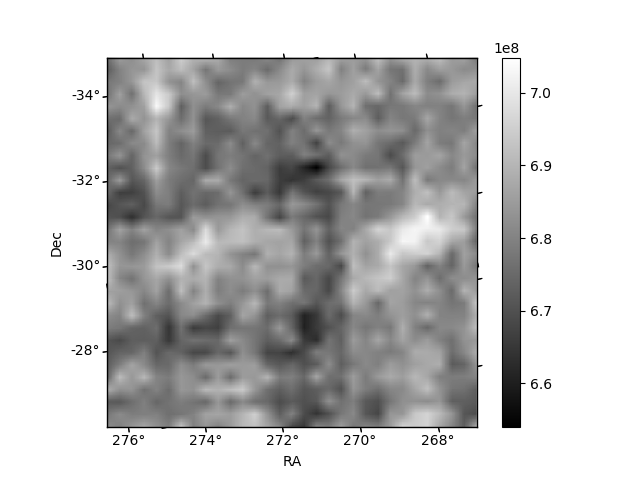
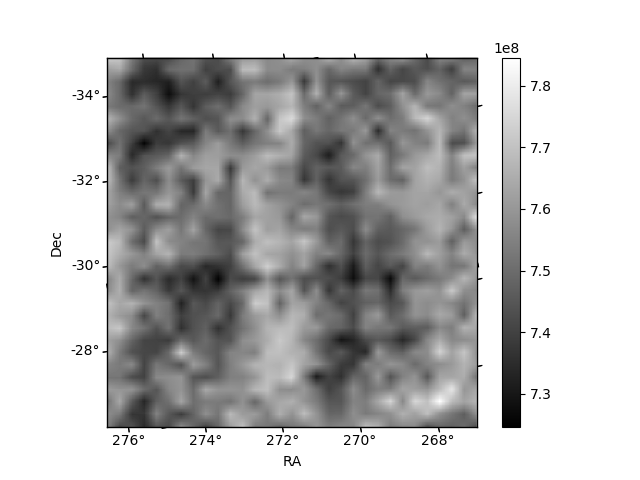
Histogram calculated using DETX and DETY for each event in the final _common_clean file
| Quadrant A | 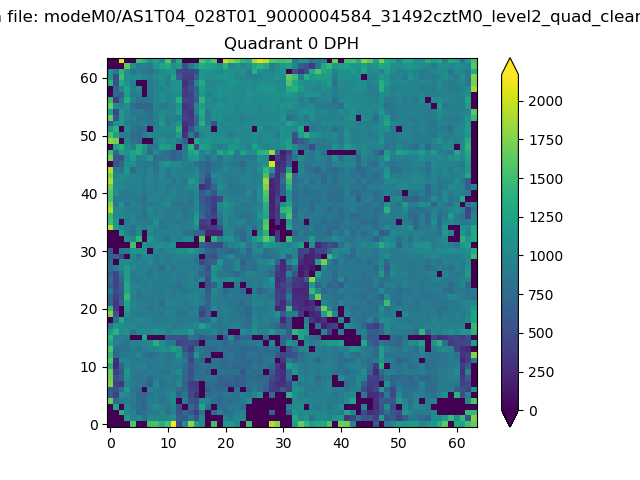 |
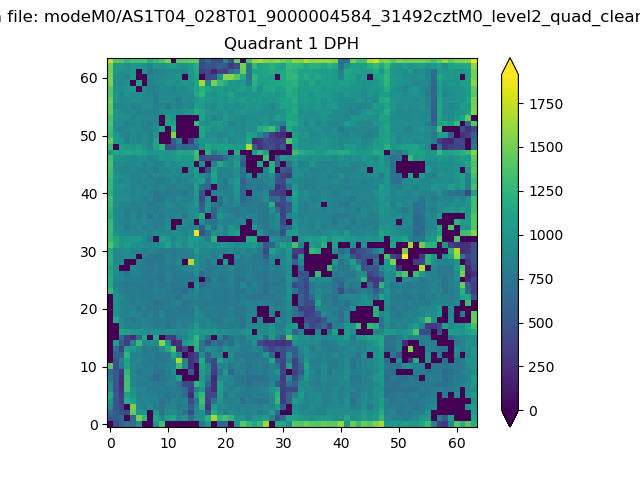 |
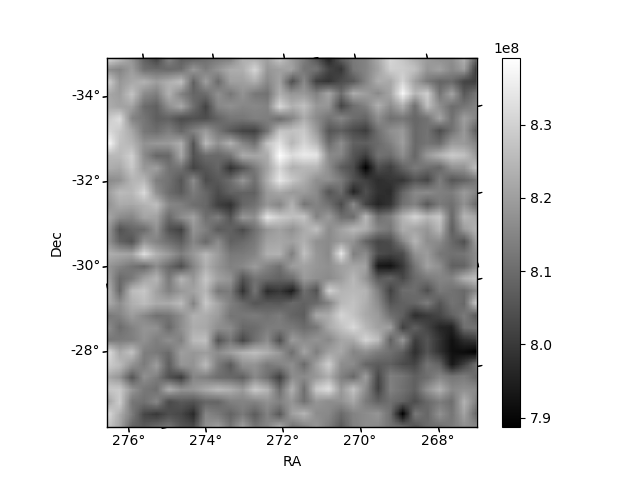
Quadrant B |
|---|---|---|---|
| Quadrant D | 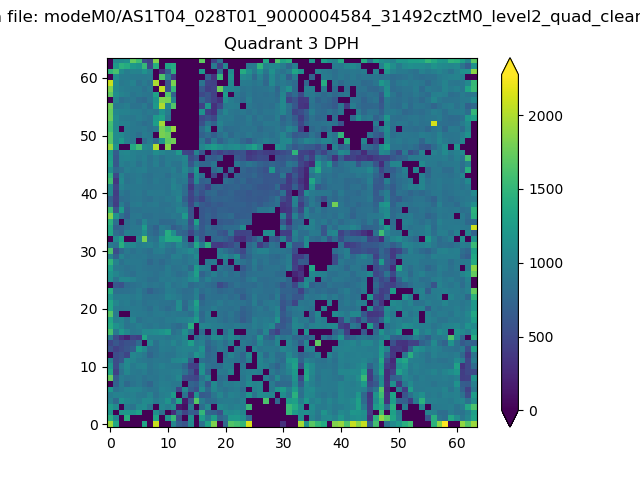 |
 |
Quadrant C |
| Plot type | Count rate plots | Images |
|---|---|---|
| Comparison with Poisson distribution Blue bars denote a histogram of data divided into 1 sec bins. Red curve is a Poisson curve with rate = median count rate of data. |
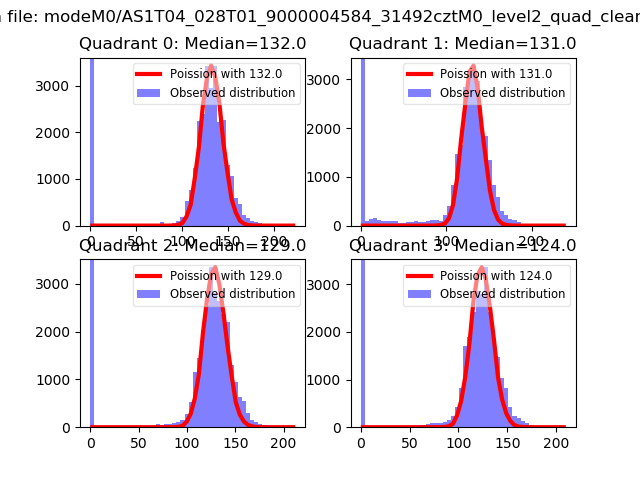 |
 |
| Quadrant-wise count rates Data is divided into 100 sec bins |
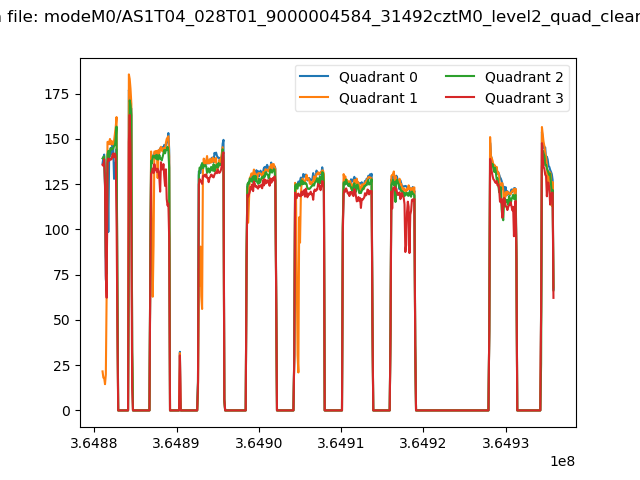 |
|
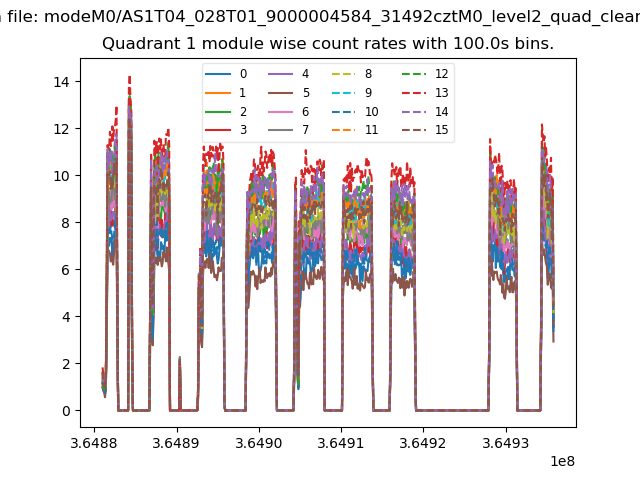
| Module-wise count rates for Quadrant A Data is divided into 100 sec bins |
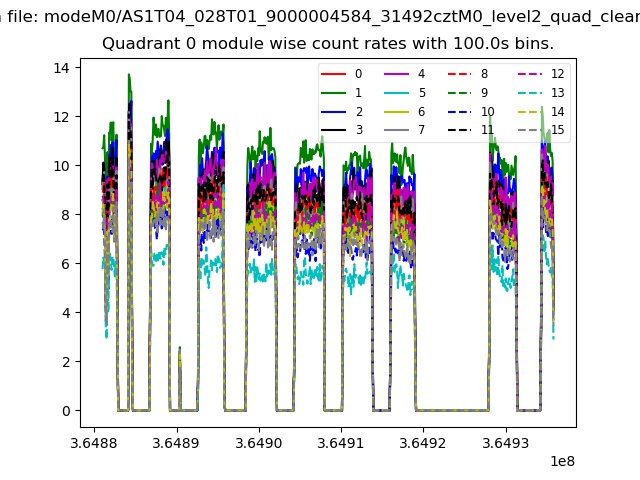 |
 |
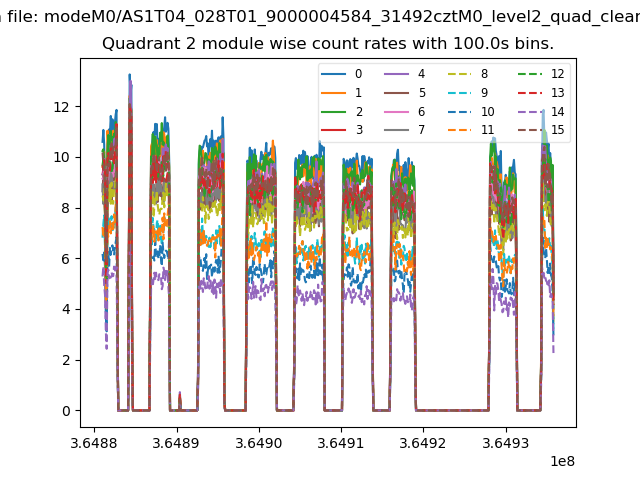
| Module-wise count rates for Quadrant B Data is divided into 100 sec bins |
 |
 |
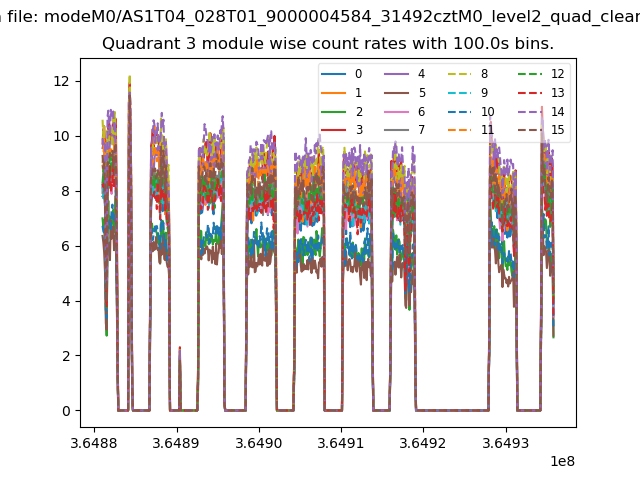
| Module-wise count rates for Quadrant C Data is divided into 100 sec bins |
 |
 |
| Module-wise count rates for Quadrant D Data is divided into 100 sec bins |
 |
 |
| Parameter | Plot |
|---|---|
| CZT HV Monitor | 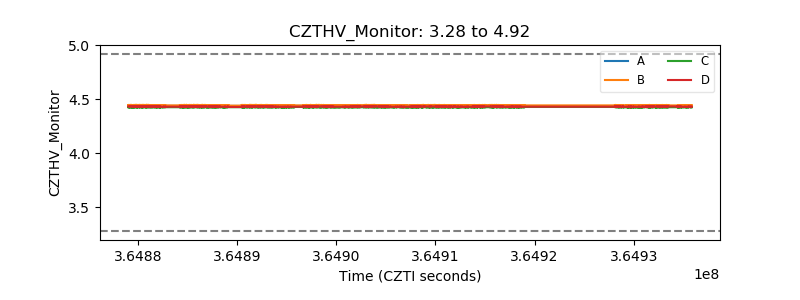 |
| D_VDD | 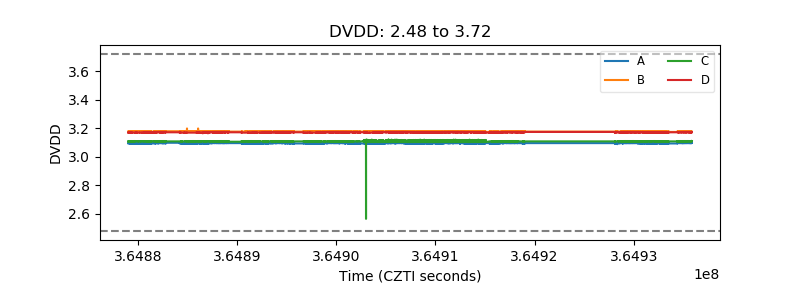 |
| Temperature 1 |  |
| Veto HV Monitor | 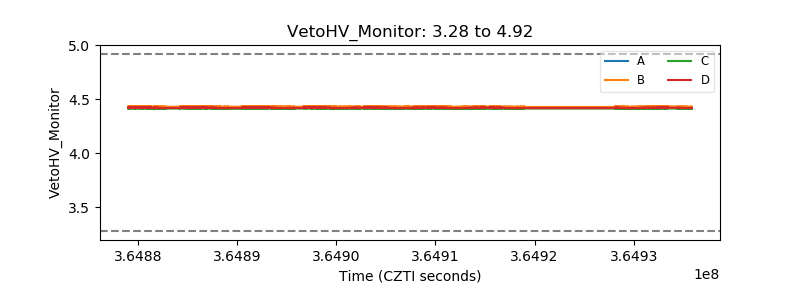 |
| Veto LLD | 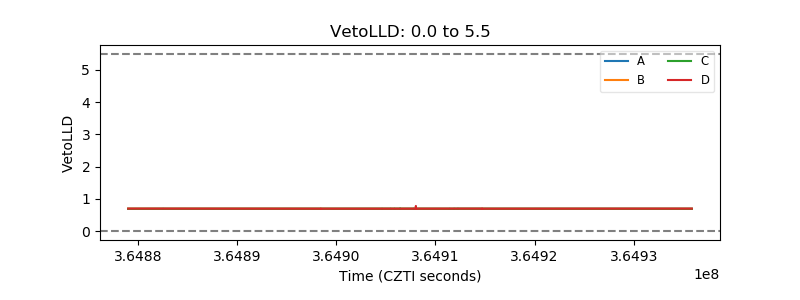 |
| Alpha Counter | 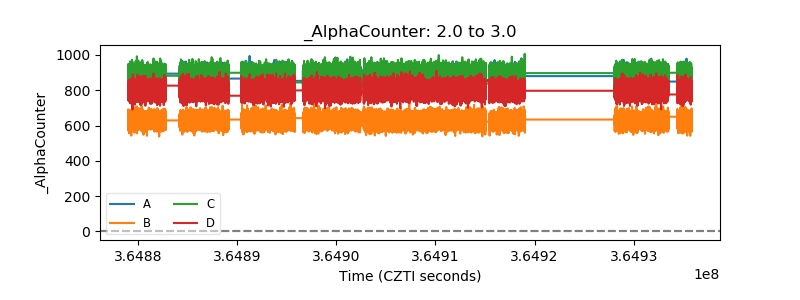 |
| _CPM_Rate | 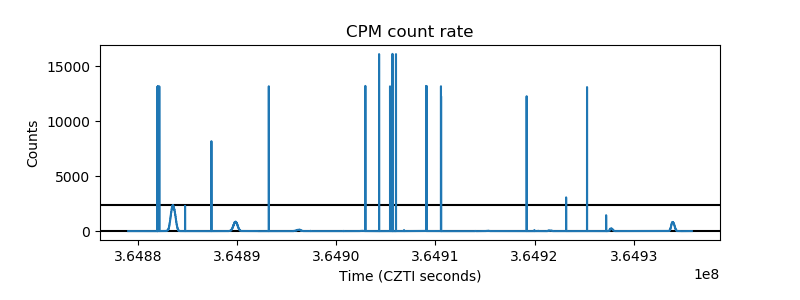 |
| CZT Counter | 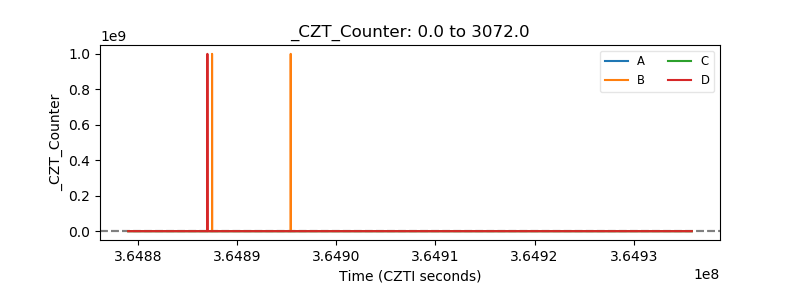 |
| +2.5 Volts monitor |  |
| +5 Volts monitor |  |
| _ROLL_ROT | 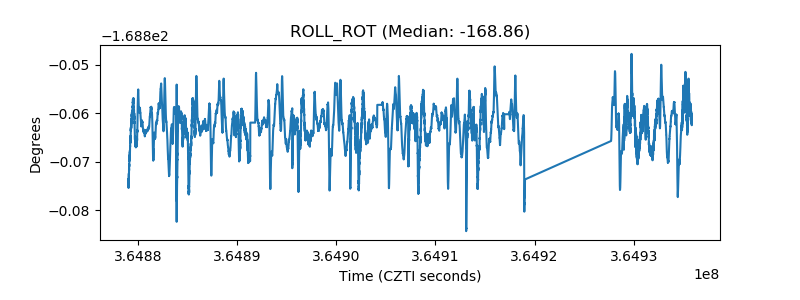 |
| _Roll_DEC | 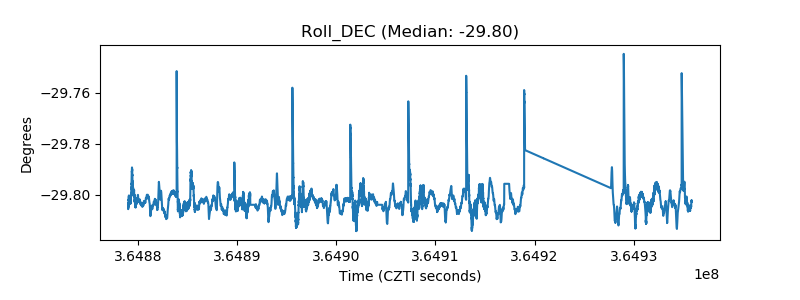 |
| _Roll_RA | 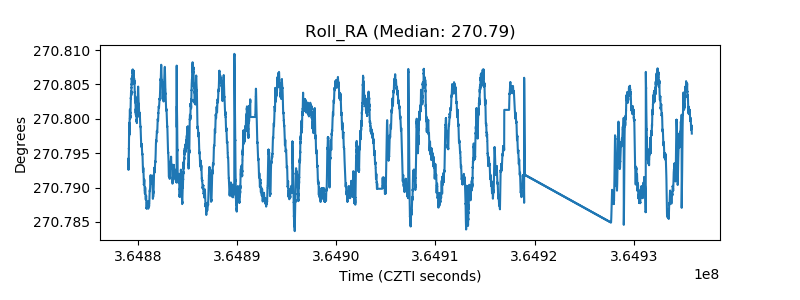 |
| Veto Counter | 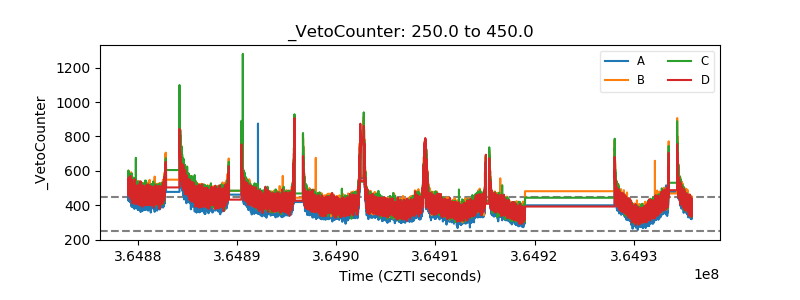 |