| Param | Original file | Final file |
|---|---|---|
| Filename | modeM0/AS1T04_028T01_9000004584_31493cztM0_level2.evt | modeM0/AS1T04_028T01_9000004584_31493cztM0_level2_quad_clean.evt |
| Size (bytes) | 2,209,533,120 | 309,133,440 |
| Size | 2.1 GB | 294.8 MB |
| Events in quadrant A | 13,203,000 | 1,970,734 |
| Events in quadrant B | 20,335,553 | 1,945,158 |
| Events in quadrant C | 13,808,077 | 1,905,633 |
| Events in quadrant D | 17,873,019 | 1,807,088 |
| Mode SS | |||
|---|---|---|---|
| Quadrant | BADHDUFLAG | Total packets | Discarded packets |
| A | 0 | 530 | 14 |
| B | 0 | 532 | 20 |
| C | 0 | 529 | 15 |
| D | 0 | 529 | 13 |
| Mode M0 | |||
|---|---|---|---|
| Quadrant | BADHDUFLAG | Total packets | Discarded packets |
| A | 0 | 57278 | 1823 |
| B | 0 | 81406 | 2859 |
| C | 0 | 58989 | 2082 |
| D | 0 | 71676 | 2172 |
| Mode M9 | |||
|---|---|---|---|
| Quadrant | BADHDUFLAG | Total packets | Discarded packets |
| A | 0 | 34 | 5 |
| B | 0 | 33 | 3 |
| C | 0 | 33 | 4 |
| D | 0 | 33 | 5 |
| Quadrant | Total seconds | Saturated seconds | Saturation percentage |
|---|---|---|---|
| A | 25221 | 442 | 1.752508% |
| B | 25157 | 772 | 3.068728% |
| C | 25225 | 765 | 3.032706% |
| D | 25201 | 1302 | 5.166462% |
Noise dominated data is calculated using 1-second bins in cleaned event files. If a bin has >2000 counts, and if more than 50% of those come from <1% of pixels, then it is considered to be noise-dominated and hence unusable.
| Quadrant | # 1 sec bins | Bins with >0 counts | Bins with >2000 counts | High rate bins dominated by noise | Noise dominated (total time) | Noise dominated (detector-on time) | Marked lightcurve |
|---|---|---|---|---|---|---|---|
| A | 31435 | 25336 | 104 | 104 | 0.33% | 0.41% | 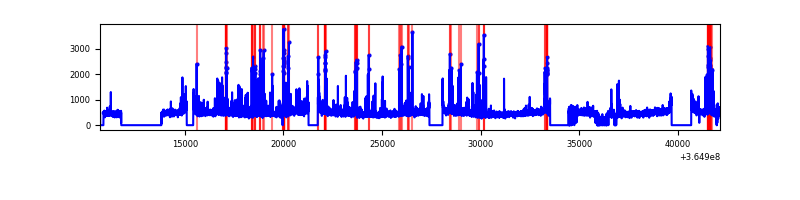 |
| B | 31428 | 25281 | 197 | 197 | 0.63% | 0.78% | 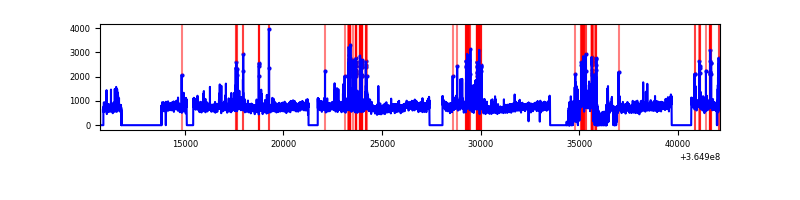 |
| C | 31430 | 25361 | 220 | 220 | 0.70% | 0.87% | 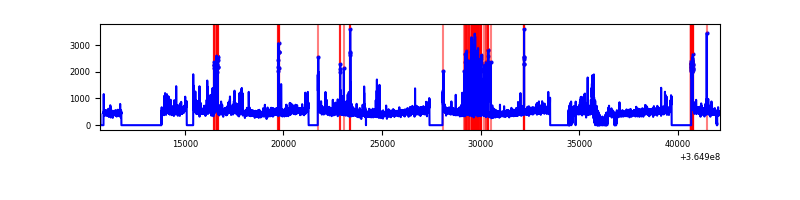 |
| D | 31430 | 25330 | 1124 | 1124 | 3.58% | 4.44% | 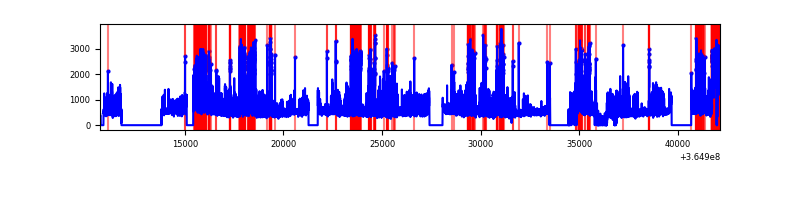 |
Top three noisy pixels from each quadrant. If the there are fewer than three noisy pixels in the level2.evt file, extra rows are filled as -1
| Pixel properties | Quadrant properties | ||||||
|---|---|---|---|---|---|---|---|
| Quadrant | DetID | PixID | Counts | Sigma | Mean | Median | Sigma |
| A | 0 | 13 | 1311921 | 2117.1 | 3082 | 3013 | 618.3 |
| A | 13 | 254 | 43320 | 65.19 | 3082 | 3013 | 618.3 |
| A | 3 | 137 | 31817 | 46.59 | 3082 | 3013 | 618.3 |
| B | 6 | 159 | 6956855 | 11850.38 | 3037 | 2954 | 586.8 |
| B | 5 | 172 | 633609 | 1074.72 | 3037 | 2954 | 586.8 |
| B | 4 | 80 | 180885 | 303.22 | 3037 | 2954 | 586.8 |
| C | 3 | 233 | 1013841 | 1456.51 | 2944 | 2960 | 694.0 |
| C | 14 | 238 | 471094 | 674.5 | 2944 | 2960 | 694.0 |
| C | 0 | 10 | 440402 | 630.28 | 2944 | 2960 | 694.0 |
| D | 8 | 195 | 3085022 | 4426.07 | 2927 | 2841 | 696.4 |
| D | 13 | 249 | 1558566 | 2234.05 | 2927 | 2841 | 696.4 |
| D | 12 | 218 | 1112634 | 1593.68 | 2927 | 2841 | 696.4 |
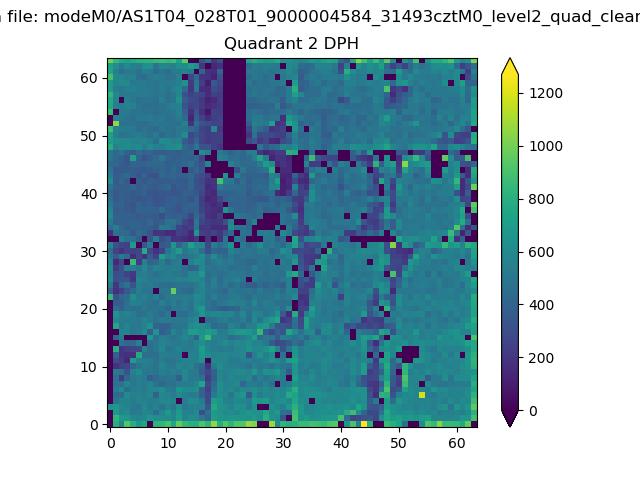
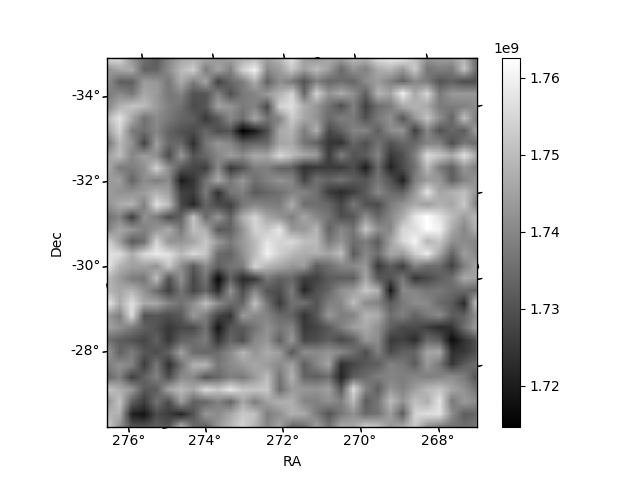
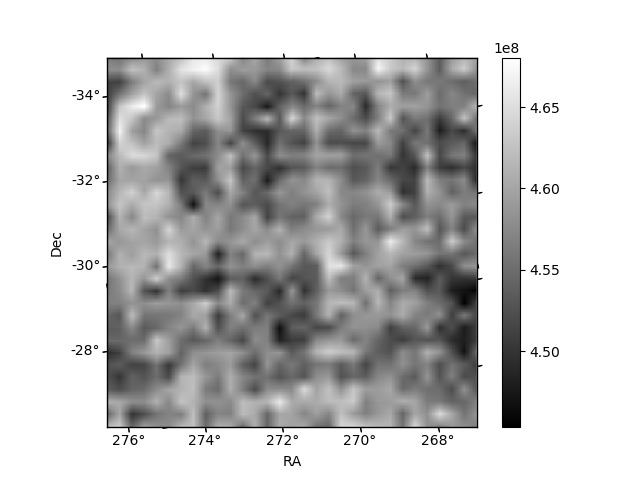
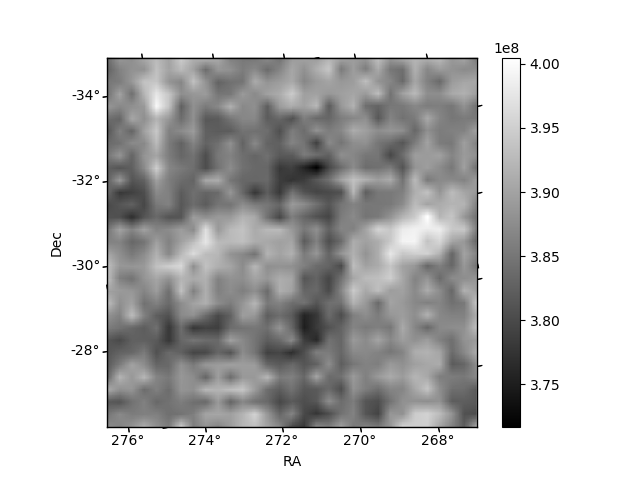
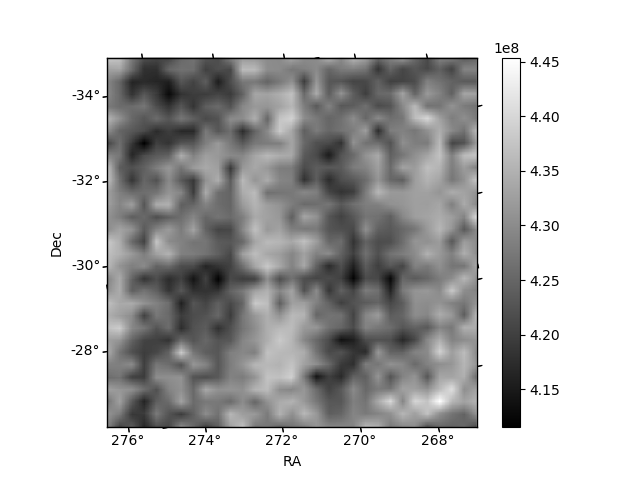
Histogram calculated using DETX and DETY for each event in the final _common_clean file
| Quadrant A | 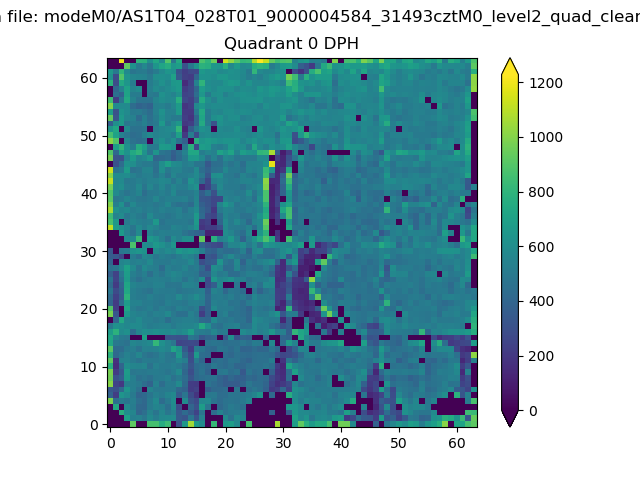 |
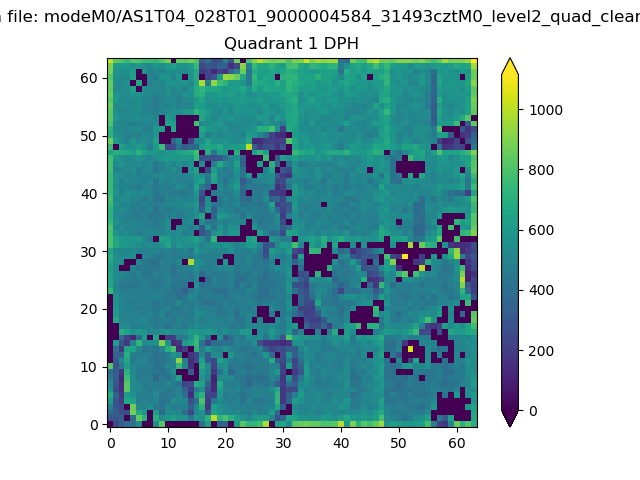 |
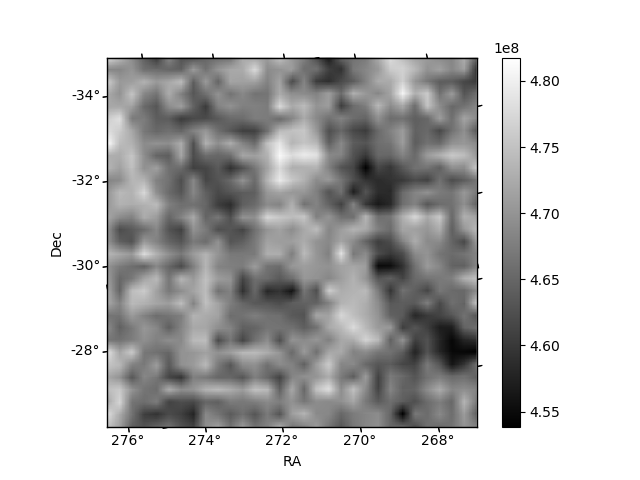
Quadrant B |
|---|---|---|---|
| Quadrant D | 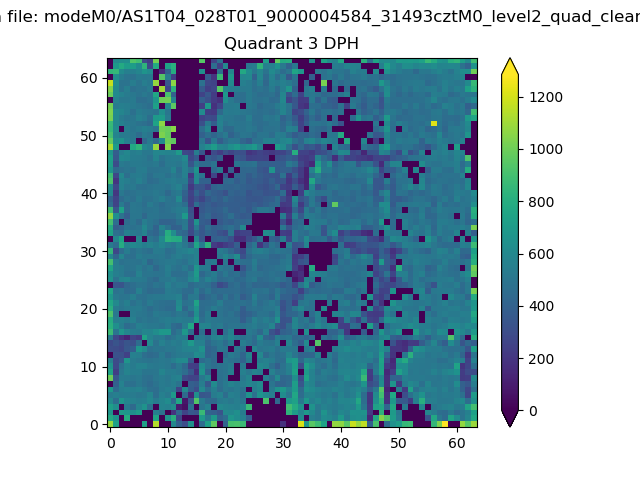 |
 |
Quadrant C |
| Plot type | Count rate plots | Images |
|---|---|---|
| Comparison with Poisson distribution Blue bars denote a histogram of data divided into 1 sec bins. Red curve is a Poisson curve with rate = median count rate of data. |
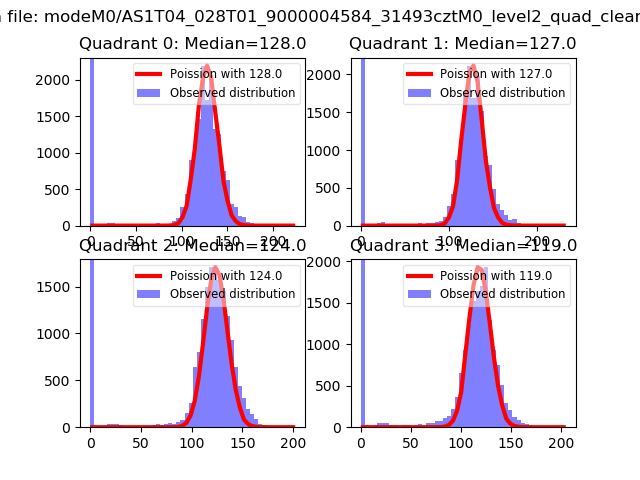 |
 |
| Quadrant-wise count rates Data is divided into 100 sec bins |
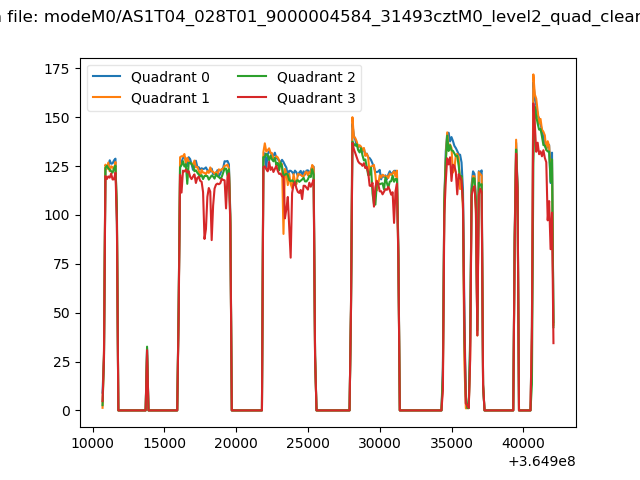 |
|
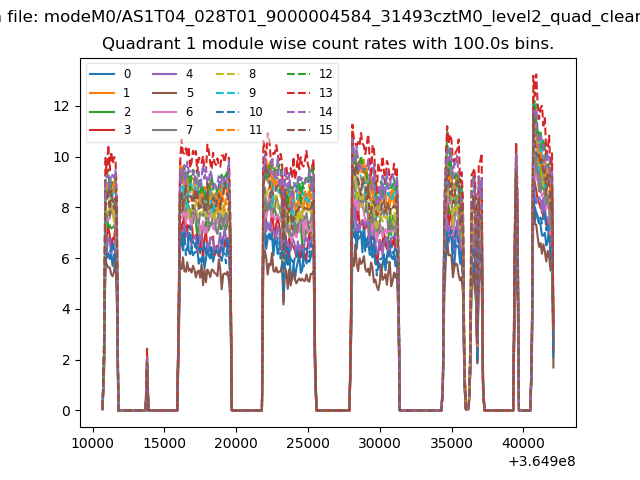
| Module-wise count rates for Quadrant A Data is divided into 100 sec bins |
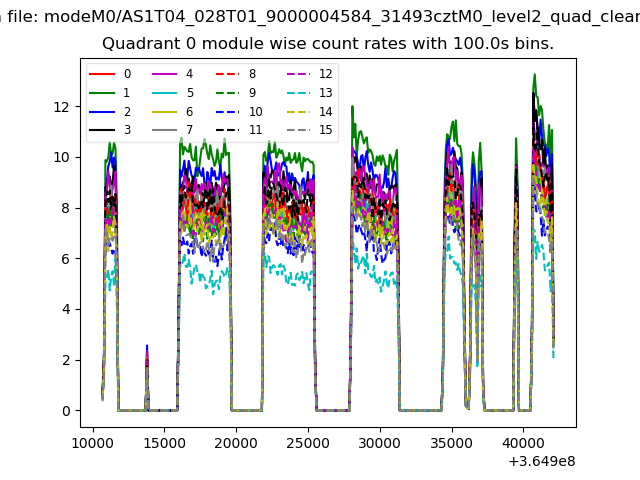 |
 |
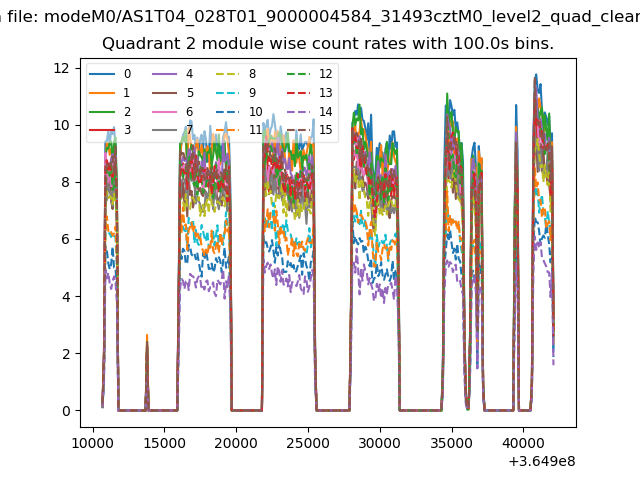
| Module-wise count rates for Quadrant B Data is divided into 100 sec bins |
 |
 |
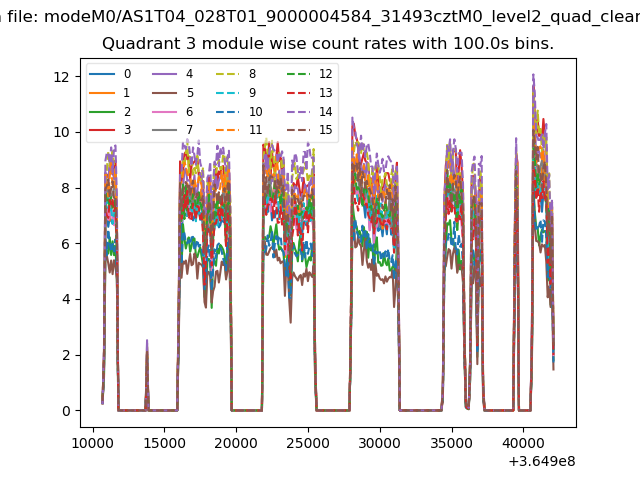
| Module-wise count rates for Quadrant C Data is divided into 100 sec bins |
 |
 |
| Module-wise count rates for Quadrant D Data is divided into 100 sec bins |
 |
 |
| Parameter | Plot |
|---|---|
| CZT HV Monitor | 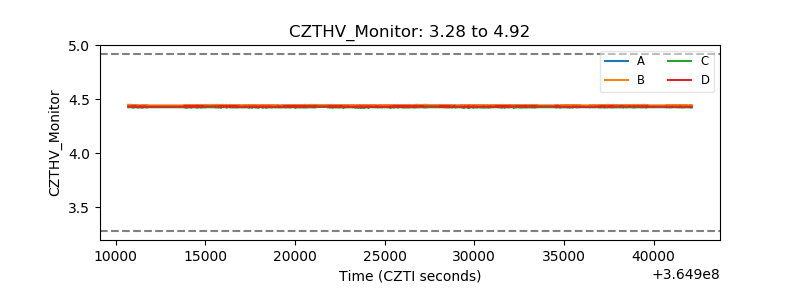 |
| D_VDD | 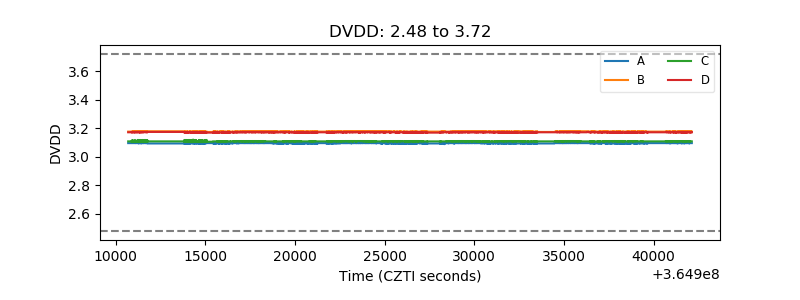 |
| Temperature 1 | 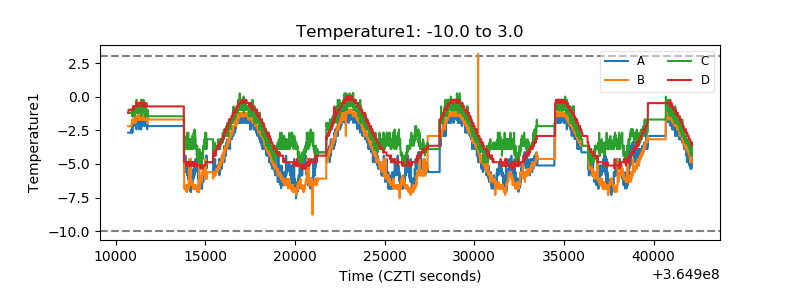 |
| Veto HV Monitor | 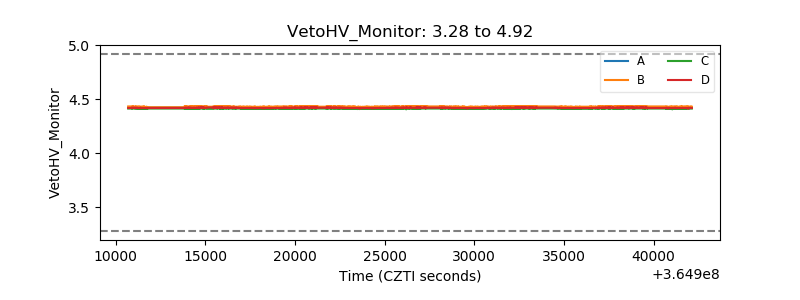 |
| Veto LLD | 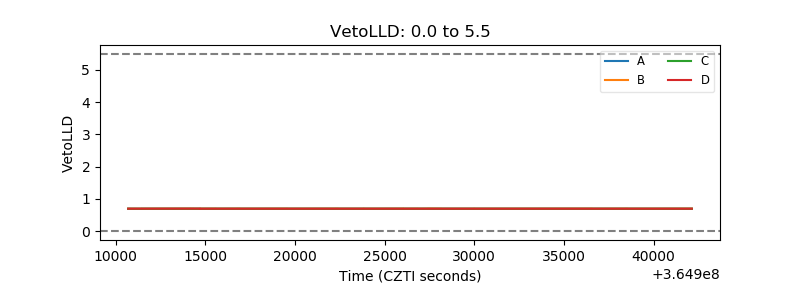 |
| Alpha Counter | 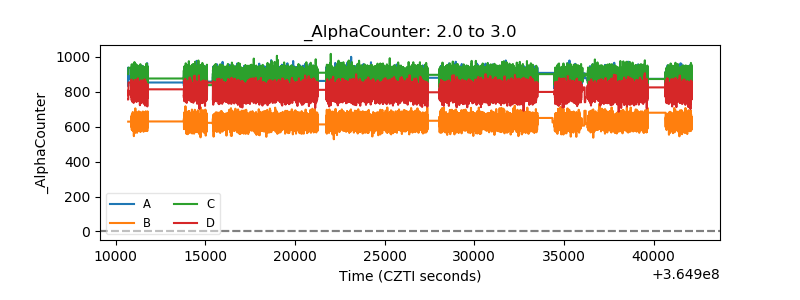 |
| _CPM_Rate | 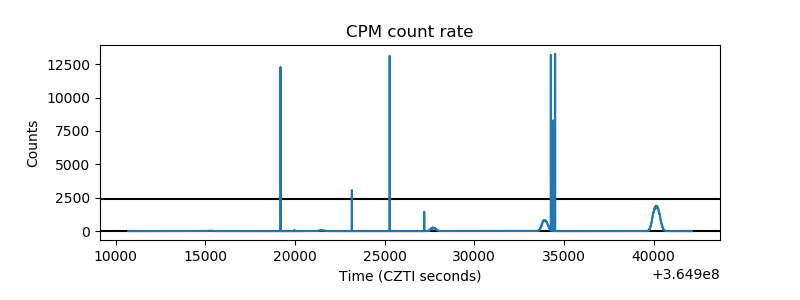 |
| CZT Counter | 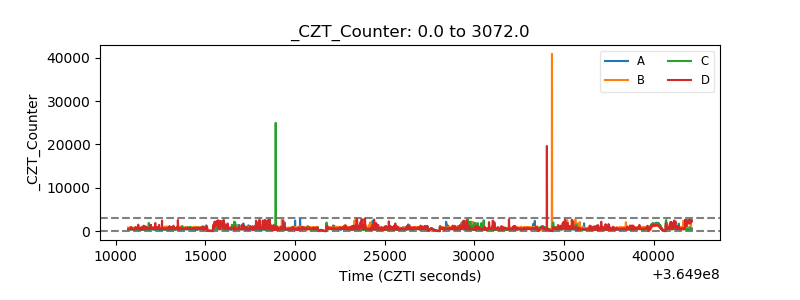 |
| +2.5 Volts monitor |  |
| +5 Volts monitor |  |
| _ROLL_ROT | 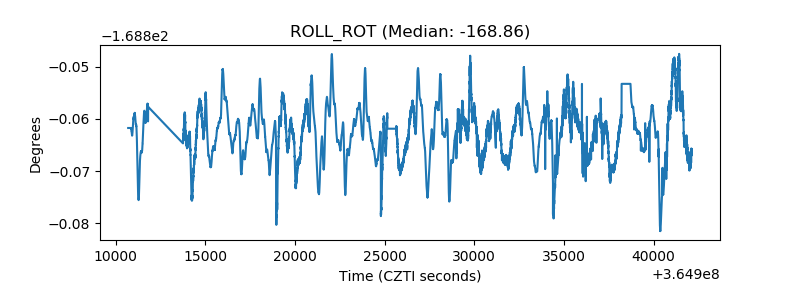 |
| _Roll_DEC | 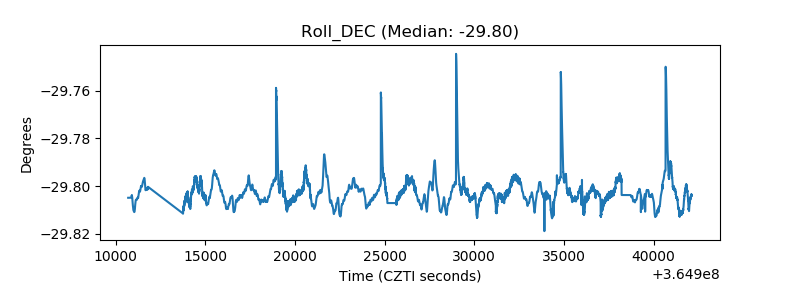 |
| _Roll_RA | 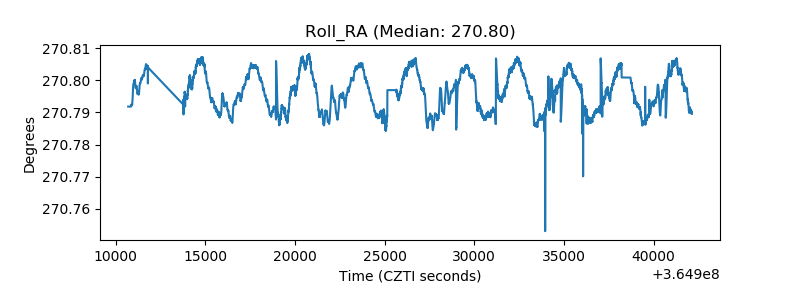 |
| Veto Counter | 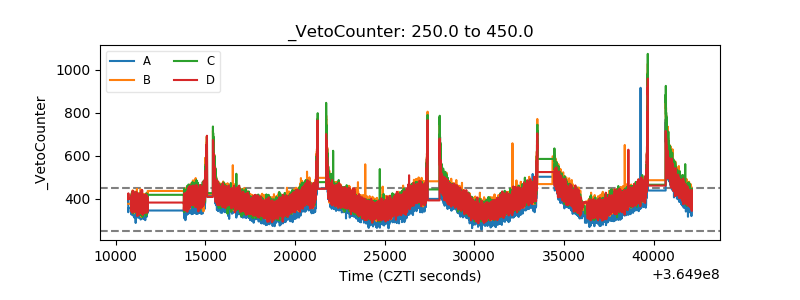 |