| Param | Original file | Final file |
|---|---|---|
| Filename | modeM0/AS1T04_028T01_9000004584_31495cztM0_level2.evt | modeM0/AS1T04_028T01_9000004584_31495cztM0_level2_quad_clean.evt |
| Size (bytes) | 616,924,800 | 91,319,040 |
| Size | 588.3 MB | 87.1 MB |
| Events in quadrant A | 3,350,055 | 602,951 |
| Events in quadrant B | 5,252,023 | 608,909 |
| Events in quadrant C | 3,487,905 | 572,875 |
| Events in quadrant D | 6,161,377 | 534,250 |
| Mode SS | |||
|---|---|---|---|
| Quadrant | BADHDUFLAG | Total packets | Discarded packets |
| A | 0 | 128 | 0 |
| B | 0 | 128 | 0 |
| C | 0 | 128 | 0 |
| D | 0 | 128 | 0 |
| Mode M0 | |||
|---|---|---|---|
| Quadrant | BADHDUFLAG | Total packets | Discarded packets |
| A | 0 | 14088 | 2 |
| B | 0 | 20090 | 2 |
| C | 0 | 14340 | 2 |
| D | 0 | 22588 | 3 |
| Mode M9 | |||
|---|---|---|---|
| Quadrant | BADHDUFLAG | Total packets | Discarded packets |
| A | 0 | 16 | 0 |
| B | 0 | 17 | 0 |
| C | 0 | 17 | 0 |
| D | 0 | 17 | 0 |
| Quadrant | Total seconds | Saturated seconds | Saturation percentage |
|---|---|---|---|
| A | 6400 | 52 | 0.812500% |
| B | 6400 | 128 | 2.000000% |
| C | 6400 | 213 | 3.328125% |
| D | 6399 | 514 | 8.032505% |
Noise dominated data is calculated using 1-second bins in cleaned event files. If a bin has >2000 counts, and if more than 50% of those come from <1% of pixels, then it is considered to be noise-dominated and hence unusable.
| Quadrant | # 1 sec bins | Bins with >0 counts | Bins with >2000 counts | High rate bins dominated by noise | Noise dominated (total time) | Noise dominated (detector-on time) | Marked lightcurve |
|---|---|---|---|---|---|---|---|
| A | 7540 | 6401 | 15 | 15 | 0.20% | 0.23% | 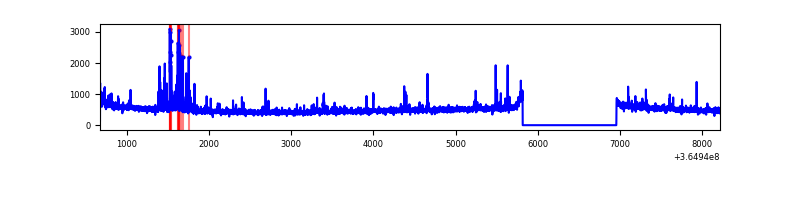 |
| B | 7540 | 6400 | 28 | 28 | 0.37% | 0.44% | 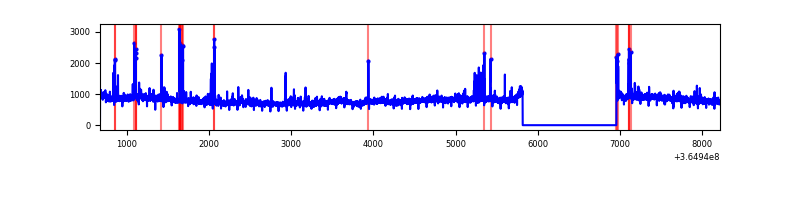 |
| C | 7540 | 6400 | 110 | 110 | 1.46% | 1.72% | 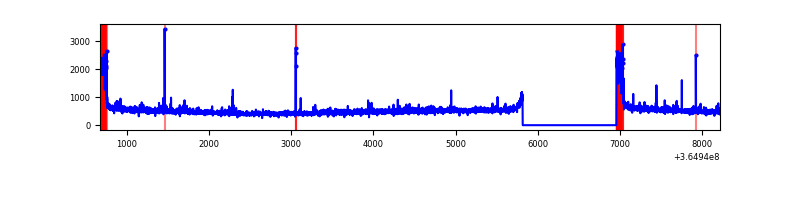 |
| D | 7539 | 6400 | 754 | 754 | 10.00% | 11.78% | 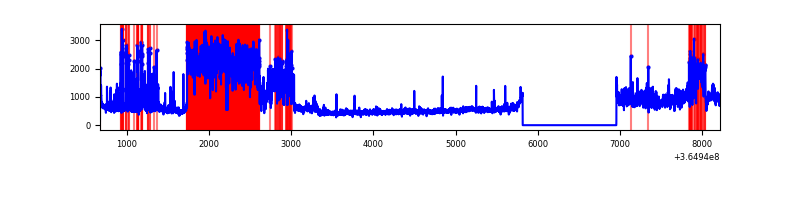 |
Top three noisy pixels from each quadrant. If the there are fewer than three noisy pixels in the level2.evt file, extra rows are filled as -1
| Pixel properties | Quadrant properties | ||||||
|---|---|---|---|---|---|---|---|
| Quadrant | DetID | PixID | Counts | Sigma | Mean | Median | Sigma |
| A | 0 | 13 | 240452 | 1469.32 | 806 | 791 | 163.1 |
| A | 13 | 254 | 12572 | 72.22 | 806 | 791 | 163.1 |
| A | 3 | 137 | 8180 | 45.3 | 806 | 791 | 163.1 |
| B | 6 | 159 | 1809830 | 11835.93 | 802 | 782 | 152.8 |
| B | 5 | 172 | 77377 | 501.13 | 802 | 782 | 152.8 |
| B | 15 | 33 | 62432 | 403.35 | 802 | 782 | 152.8 |
| C | 0 | 10 | 317634 | 1772.15 | 760 | 765 | 178.8 |
| C | 14 | 238 | 122914 | 683.14 | 760 | 765 | 178.8 |
| C | 12 | 249 | 41039 | 225.24 | 760 | 765 | 178.8 |
| D | 8 | 195 | 2907043 | 16053.22 | 757 | 735 | 181.0 |
| D | 12 | 233 | 211561 | 1164.51 | 757 | 735 | 181.0 |
| D | 13 | 249 | 55853 | 304.45 | 757 | 735 | 181.0 |
Histogram calculated using DETX and DETY for each event in the final _common_clean file
| Quadrant A | 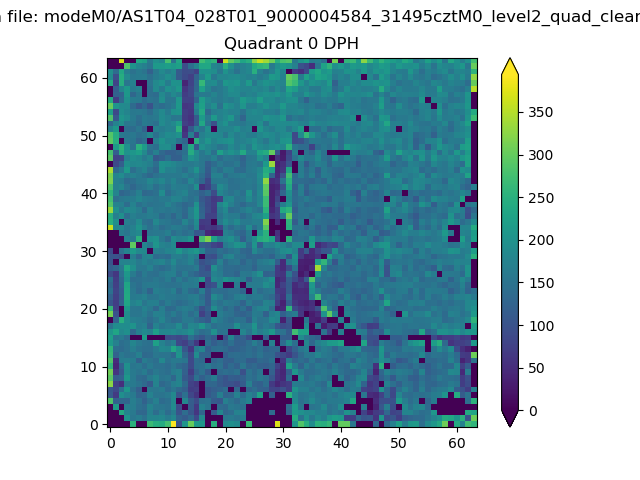 |
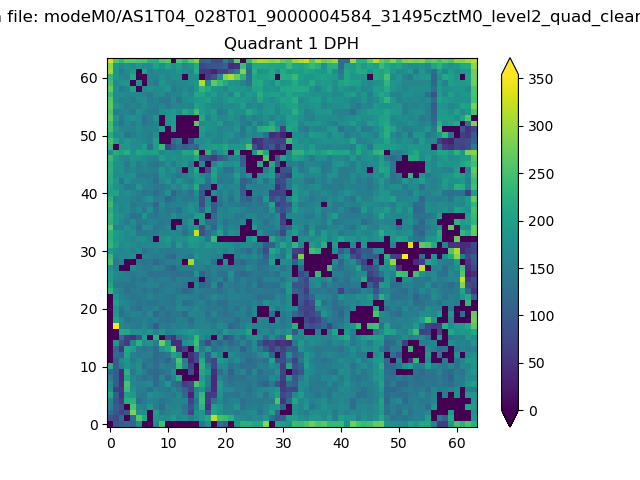 |
Quadrant B |
|---|---|---|---|
| Quadrant D | 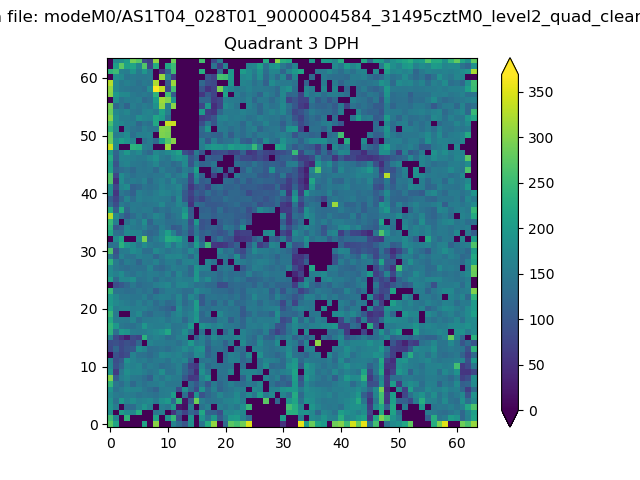 |
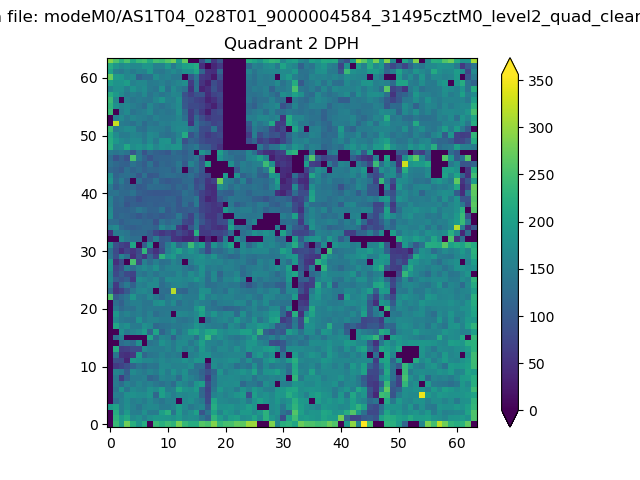 |
Quadrant C |
| Plot type | Count rate plots | Images |
|---|---|---|
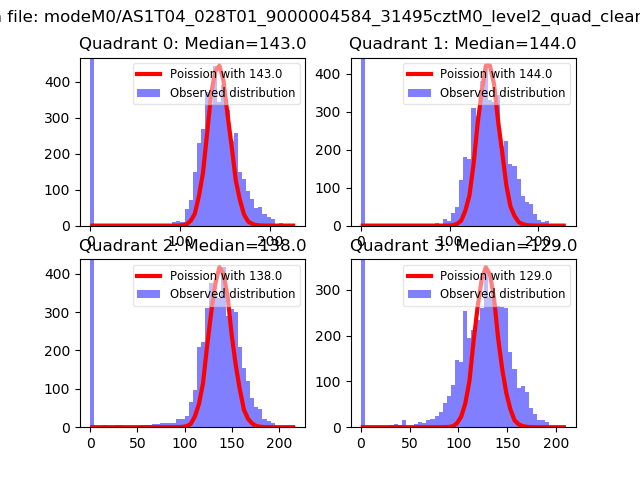
| Comparison with Poisson distribution Blue bars denote a histogram of data divided into 1 sec bins. Red curve is a Poisson curve with rate = median count rate of data. |
 |
 |
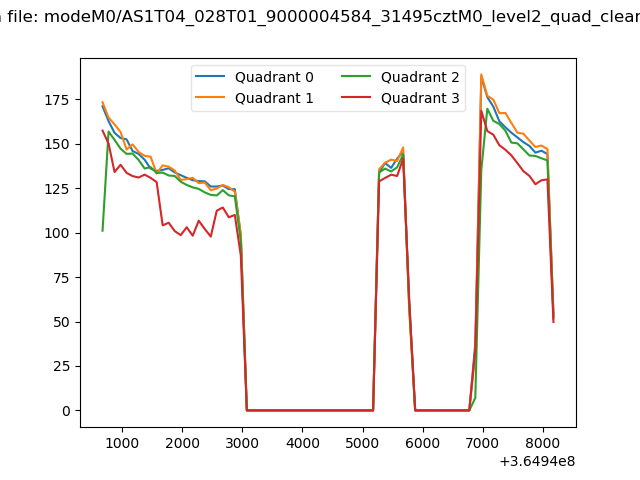
| Quadrant-wise count rates Data is divided into 100 sec bins |
 |
|
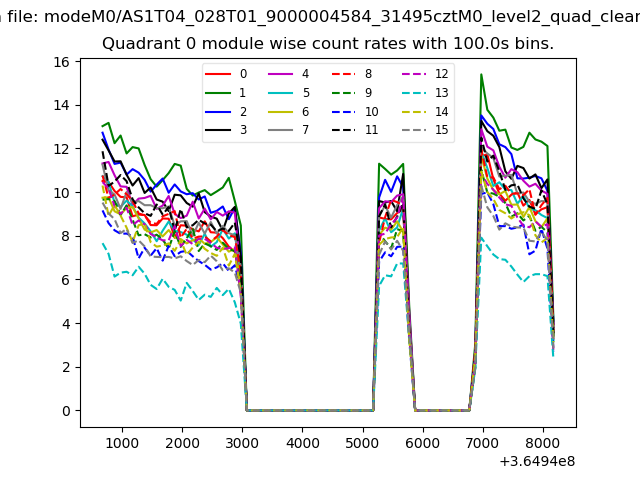
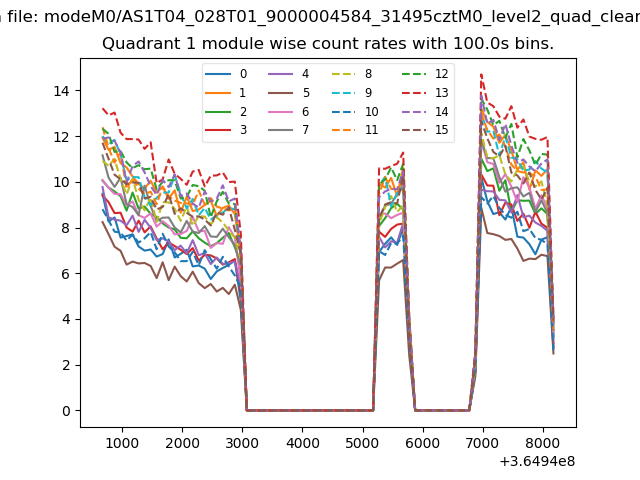
| Module-wise count rates for Quadrant A Data is divided into 100 sec bins |
 |
 |
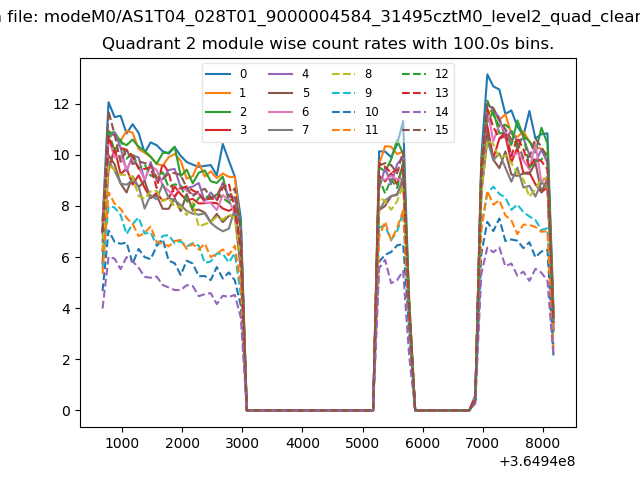
| Module-wise count rates for Quadrant B Data is divided into 100 sec bins |
 |
 |
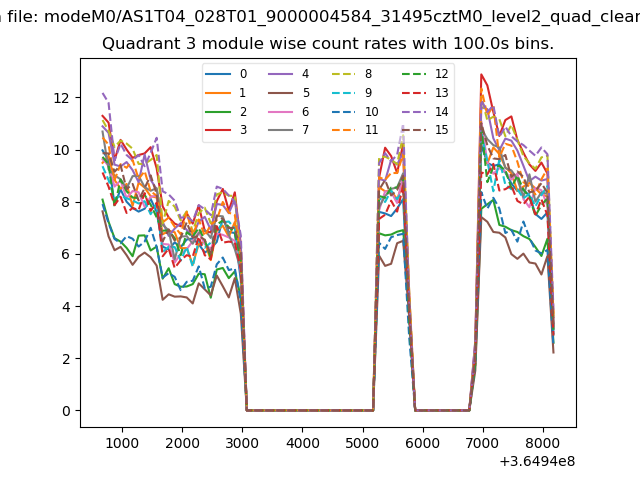
| Module-wise count rates for Quadrant C Data is divided into 100 sec bins |
 |
 |
| Module-wise count rates for Quadrant D Data is divided into 100 sec bins |
 |
 |
| Parameter | Plot |
|---|---|
| CZT HV Monitor | 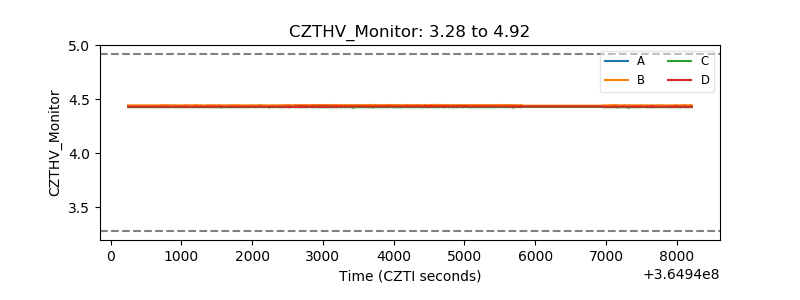 |
| D_VDD | 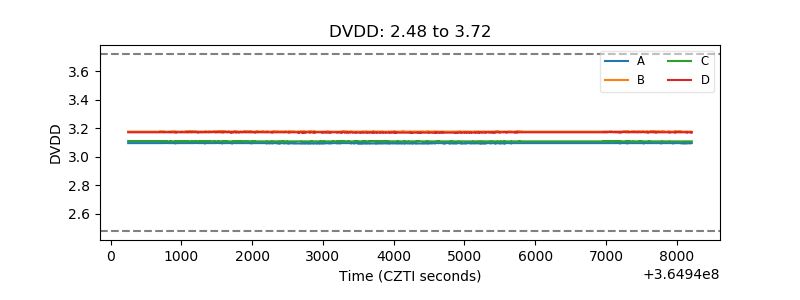 |
| Temperature 1 | 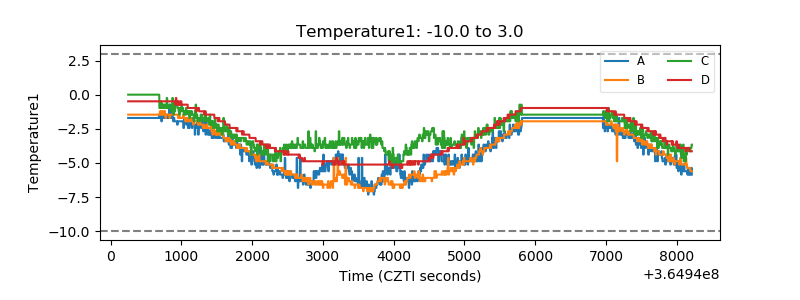 |
| Veto HV Monitor | 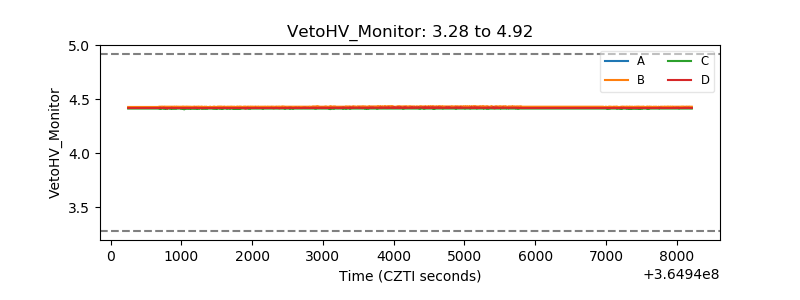 |
| Veto LLD | 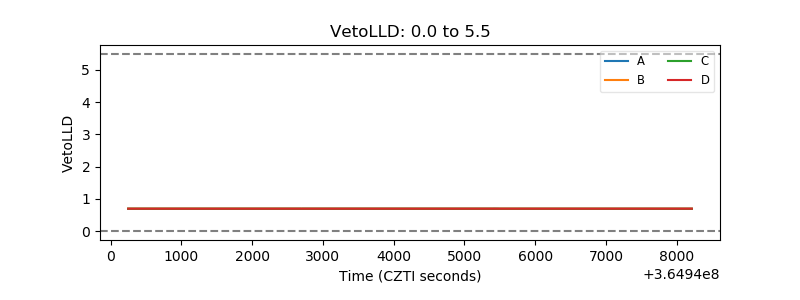 |
| Alpha Counter | 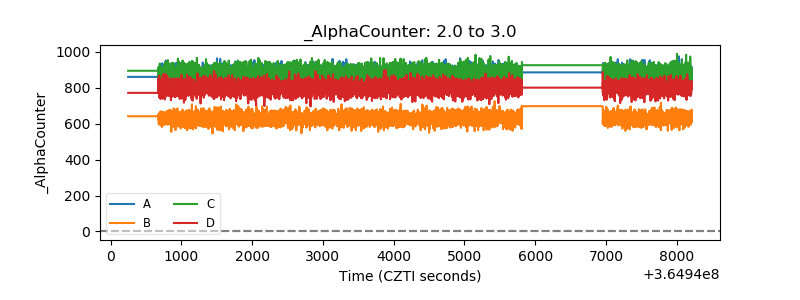 |
| _CPM_Rate | 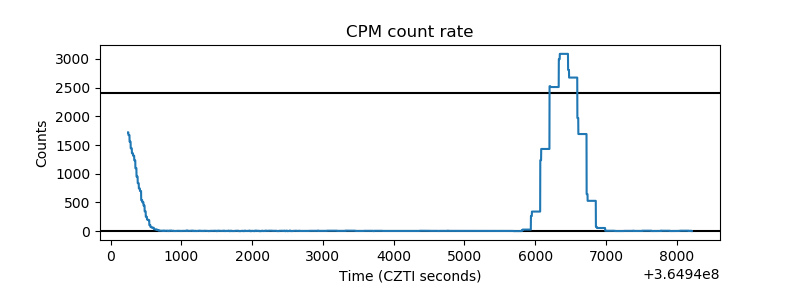 |
| CZT Counter | 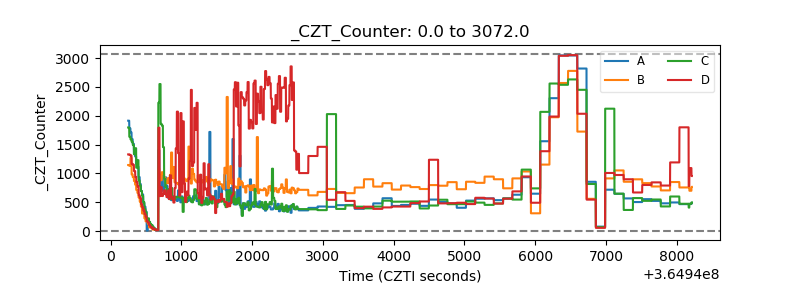 |
| +2.5 Volts monitor |  |
| +5 Volts monitor |  |
| _ROLL_ROT | 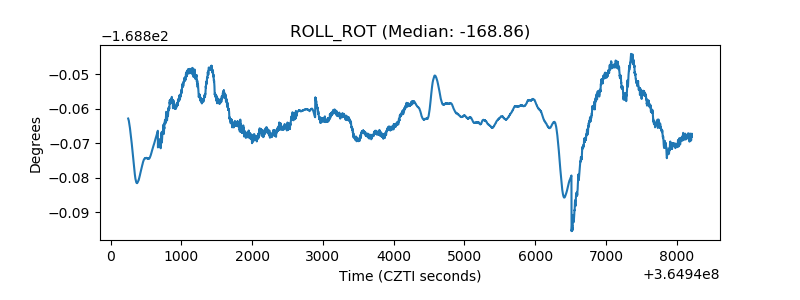 |
| _Roll_DEC | 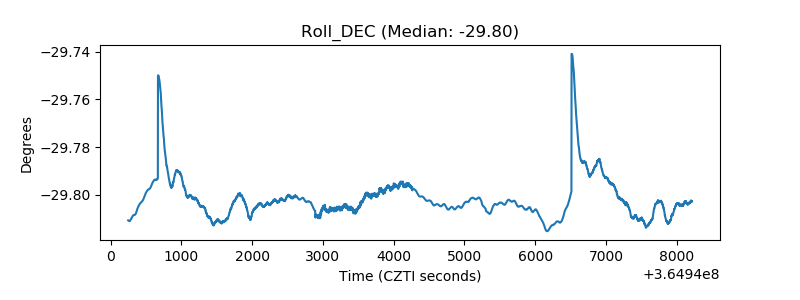 |
| _Roll_RA | 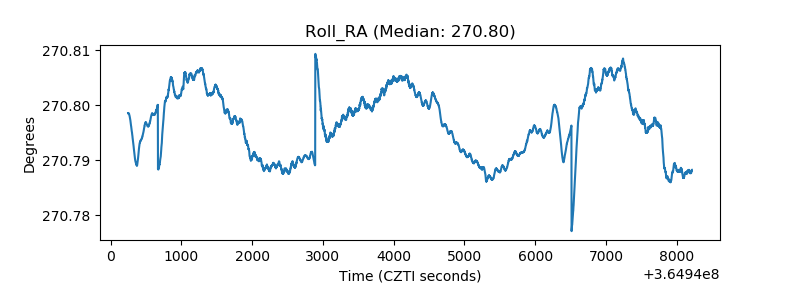 |
| Veto Counter | 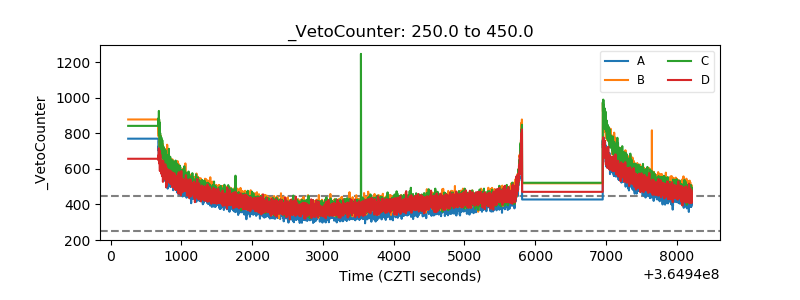 |