| Param | Original file | Final file |
|---|---|---|
| Filename | modeM0/AS1A10_048T04_9000004586cztM0_level2.fits | modeM0/AS1A10_048T04_9000004586cztM0_level2_quad_clean.evt |
| Size (bytes) | 117,466,560 | 46,520,640 |
| Size | 112.0 MB | 44.4 MB |
| Events in quadrant A | 755,408 | 170,698 |
| Events in quadrant B | 705,412 | 169,852 |
| Events in quadrant C | 709,336 | 163,577 |
| Events in quadrant D | 631,680 | 147,158 |
| Mode M0 | |||
|---|---|---|---|
| Quadrant | BADHDUFLAG | Total packets | Discarded packets |
| A | 0 | 23617 | 0 |
| B | 0 | 33825 | 0 |
| C | 0 | 25125 | 0 |
| D | 0 | 28910 | 0 |
| Mode SS | |||
|---|---|---|---|
| Quadrant | BADHDUFLAG | Total packets | Discarded packets |
| A | 0 | 224 | 0 |
| B | 0 | 224 | 0 |
| C | 0 | 222 | 0 |
| D | 0 | 224 | 0 |
| Mode M9 | |||
|---|---|---|---|
| Quadrant | BADHDUFLAG | Total packets | Discarded packets |
| A | 0 | 26 | 0 |
| B | 0 | 26 | 0 |
| C | 0 | 26 | 0 |
| D | 0 | 26 | 0 |
| Quadrant | Total seconds | Saturated seconds | Saturation percentage |
|---|---|---|---|
| A | 10940 | 145 | 1.325411% |
| B | 10920 | 270 | 2.472527% |
| C | 10928 | 432 | 3.953148% |
| D | 10906 | 159 | 1.457913% |
Noise dominated data is calculated using 1-second bins in cleaned event files. If a bin has >2000 counts, and if more than 50% of those come from <1% of pixels, then it is considered to be noise-dominated and hence unusable.
| Quadrant | # 1 sec bins | Bins with >0 counts | Bins with >2000 counts | High rate bins dominated by noise | Noise dominated (total time) | Noise dominated (detector-on time) | Marked lightcurve |
|---|---|---|---|---|---|---|---|
| A | 13598 | 10303 | 0 | 0 | 0.00% | 0.00% | 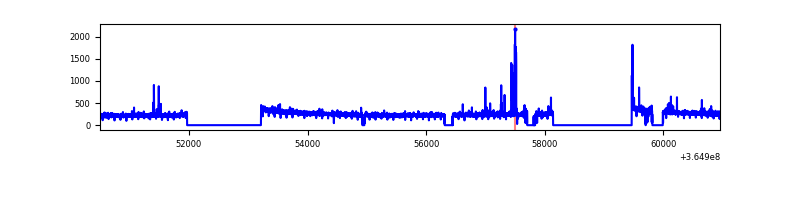 |
| B | 13598 | 10295 | 0 | 0 | 0.00% | 0.00% |  |
| C | 13597 | 10295 | 0 | 0 | 0.00% | 0.00% |  |
| D | 13598 | 10282 | 0 | 0 | 0.00% | 0.00% |  |
Top three noisy pixels from each quadrant. If the there are fewer than three noisy pixels in the level2.evt file, extra rows are filled as -1
| Pixel properties | Quadrant properties | ||||||
|---|---|---|---|---|---|---|---|
| Quadrant | DetID | PixID | Counts | Sigma | Mean | Median | Sigma |
| A | 0 | 29 | 655 | 9.56 | 197 | 187 | 49.0 |
| A | 9 | 19 | 560 | 7.62 | 197 | 187 | 49.0 |
| A | 0 | 30 | 554 | 7.49 | 197 | 187 | 49.0 |
| B | 2 | 9 | 520 | 8.81 | 187 | 180 | 38.6 |
| B | 5 | 232 | 491 | 8.06 | 187 | 180 | 38.6 |
| B | 5 | 255 | 468 | 7.47 | 187 | 180 | 38.6 |
| C | 1 | 80 | 525 | 7.17 | 187 | 177 | 48.5 |
| C | 1 | 81 | 525 | 7.17 | 187 | 177 | 48.5 |
| C | 9 | 242 | 510 | 6.86 | 187 | 177 | 48.5 |
| D | 7 | 3 | 461 | 6.08 | 180 | 165 | 48.6 |
| D | 15 | 47 | 460 | 6.06 | 180 | 165 | 48.6 |
| D | 10 | 189 | 459 | 6.04 | 180 | 165 | 48.6 |
Histogram calculated using DETX and DETY for each event in the final _common_clean file
| Quadrant A | 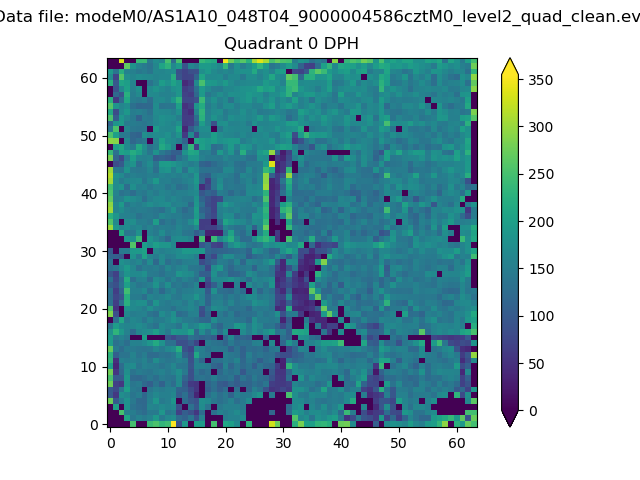 |
 |
Quadrant B |
|---|---|---|---|
| Quadrant D |  |
 |
Quadrant C |
| Plot type | Count rate plots | Images |
|---|---|---|
| Comparison with Poisson distribution Blue bars denote a histogram of data divided into 1 sec bins. Red curve is a Poisson curve with rate = median count rate of data. |
 |
 |
| Quadrant-wise count rates Data is divided into 100 sec bins |
 |
|
| Module-wise count rates for Quadrant A Data is divided into 100 sec bins |
 |
 |
| Module-wise count rates for Quadrant B Data is divided into 100 sec bins |
 |
 |
| Module-wise count rates for Quadrant C Data is divided into 100 sec bins |
 |
 |
| Module-wise count rates for Quadrant D Data is divided into 100 sec bins |
 |
 |
| Parameter | Plot |
|---|---|
| CZT HV Monitor |  |
| D_VDD |  |
| Temperature 1 |  |
| Veto HV Monitor | 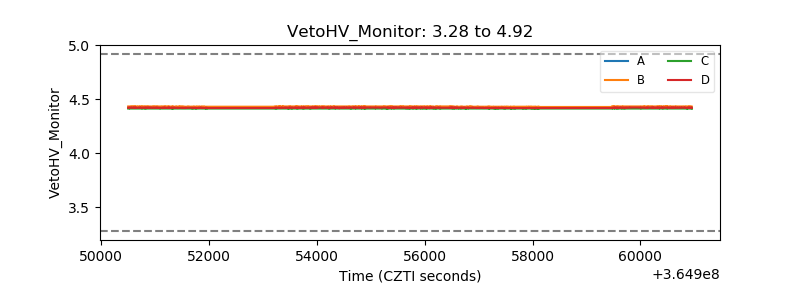 |
| Veto LLD |  |
| Alpha Counter | 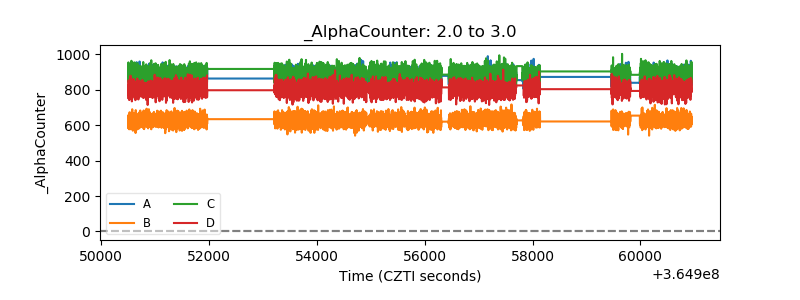 |
| _CPM_Rate | 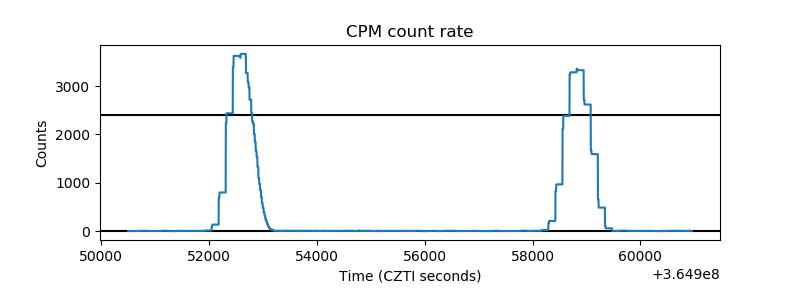 |
| CZT Counter |  |
| +2.5 Volts monitor |  |
| +5 Volts monitor |  |
| _ROLL_ROT |  |
| _Roll_DEC |  |
| _Roll_RA |  |
| Veto Counter |  |