| Param | Original file | Final file |
|---|---|---|
| Filename | modeM0/AS1A10_048T04_9000004586_31496cztM0_level2.evt | modeM0/AS1A10_048T04_9000004586_31496cztM0_level2_quad_clean.evt |
| Size (bytes) | 260,424,000 | 41,618,880 |
| Size | 248.4 MB | 39.7 MB |
| Events in quadrant A | 1,487,521 | 277,111 |
| Events in quadrant B | 2,247,954 | 278,961 |
| Events in quadrant C | 1,654,555 | 255,575 |
| Events in quadrant D | 2,312,742 | 255,360 |
| Mode M0 | |||
|---|---|---|---|
| Quadrant | BADHDUFLAG | Total packets | Discarded packets |
| A | 0 | 5947 | 1 |
| B | 0 | 8435 | 1 |
| C | 0 | 6436 | 1 |
| D | 0 | 8646 | 1 |
| Mode SS | |||
|---|---|---|---|
| Quadrant | BADHDUFLAG | Total packets | Discarded packets |
| A | 0 | 56 | 0 |
| B | 0 | 56 | 0 |
| C | 0 | 56 | 0 |
| D | 0 | 56 | 0 |
| Mode M9 | |||
|---|---|---|---|
| Quadrant | BADHDUFLAG | Total packets | Discarded packets |
| A | 0 | 12 | 0 |
| B | 0 | 12 | 0 |
| C | 0 | 12 | 0 |
| D | 0 | 12 | 0 |
| Quadrant | Total seconds | Saturated seconds | Saturation percentage |
|---|---|---|---|
| A | 2694 | 29 | 1.076466% |
| B | 2694 | 64 | 2.375650% |
| C | 2694 | 134 | 4.974016% |
| D | 2694 | 44 | 1.633259% |
Noise dominated data is calculated using 1-second bins in cleaned event files. If a bin has >2000 counts, and if more than 50% of those come from <1% of pixels, then it is considered to be noise-dominated and hence unusable.
| Quadrant | # 1 sec bins | Bins with >0 counts | Bins with >2000 counts | High rate bins dominated by noise | Noise dominated (total time) | Noise dominated (detector-on time) | Marked lightcurve |
|---|---|---|---|---|---|---|---|
| A | 3939 | 2695 | 0 | 0 | 0.00% | 0.00% | 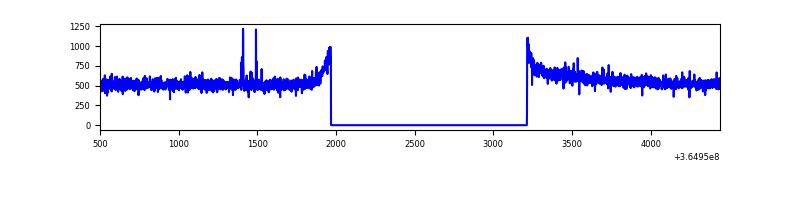 |
| B | 3939 | 2694 | 0 | 0 | 0.00% | 0.00% | 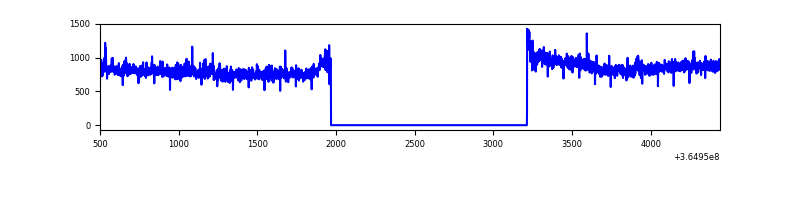 |
| C | 3939 | 2694 | 70 | 70 | 1.78% | 2.60% | 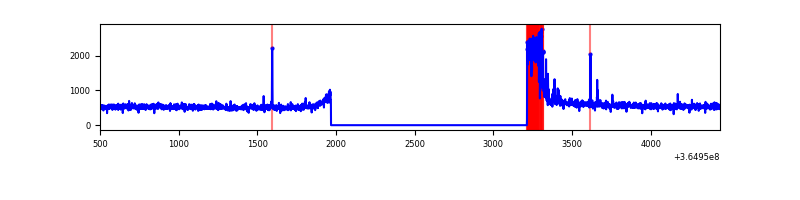 |
| D | 3939 | 2694 | 17 | 17 | 0.43% | 0.63% | 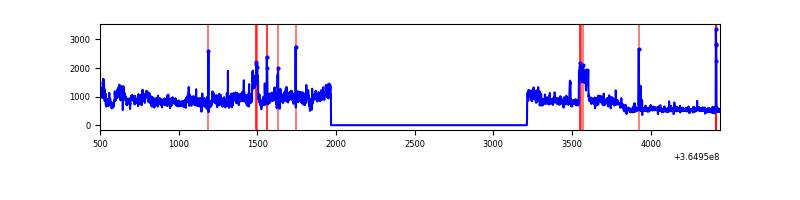 |
Top three noisy pixels from each quadrant. If the there are fewer than three noisy pixels in the level2.evt file, extra rows are filled as -1
| Pixel properties | Quadrant properties | ||||||
|---|---|---|---|---|---|---|---|
| Quadrant | DetID | PixID | Counts | Sigma | Mean | Median | Sigma |
| A | 0 | 13 | 7650 | 94.02 | 384 | 380 | 77.3 |
| A | 13 | 254 | 4600 | 54.58 | 384 | 380 | 77.3 |
| A | 3 | 137 | 3707 | 43.03 | 384 | 380 | 77.3 |
| B | 6 | 159 | 713266 | 9802.53 | 378 | 367 | 72.7 |
| B | 4 | 80 | 27253 | 369.68 | 378 | 367 | 72.7 |
| B | 0 | 190 | 10223 | 135.52 | 378 | 367 | 72.7 |
| C | 0 | 10 | 200207 | 2421.53 | 353 | 355 | 82.5 |
| C | 14 | 238 | 58211 | 701.02 | 353 | 355 | 82.5 |
| C | 12 | 249 | 7076 | 81.44 | 353 | 355 | 82.5 |
| D | 8 | 195 | 882490 | 10229.27 | 363 | 356 | 86.2 |
| D | 2 | 250 | 37792 | 434.11 | 363 | 356 | 86.2 |
| D | 2 | 234 | 10641 | 119.27 | 363 | 356 | 86.2 |
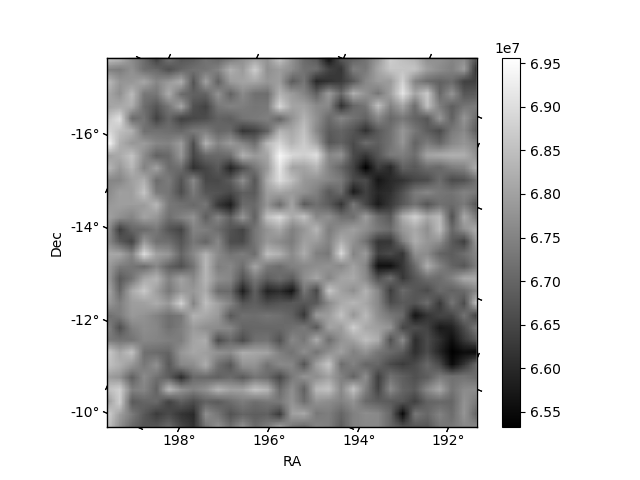
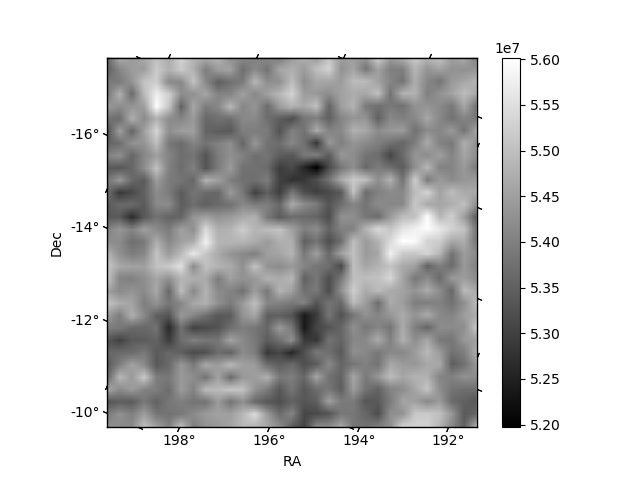
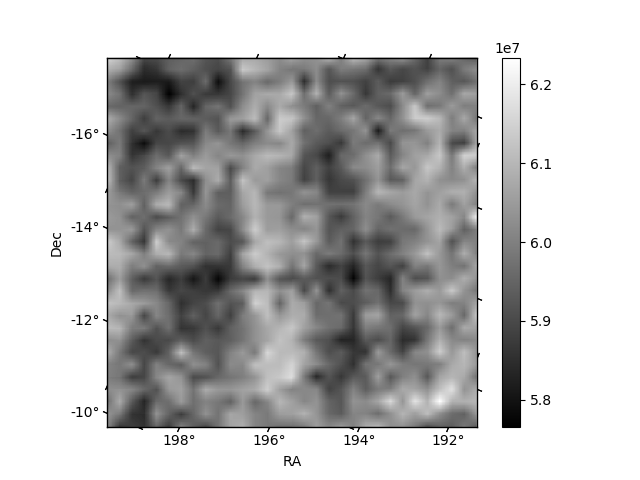
Histogram calculated using DETX and DETY for each event in the final _common_clean file
| Quadrant A | 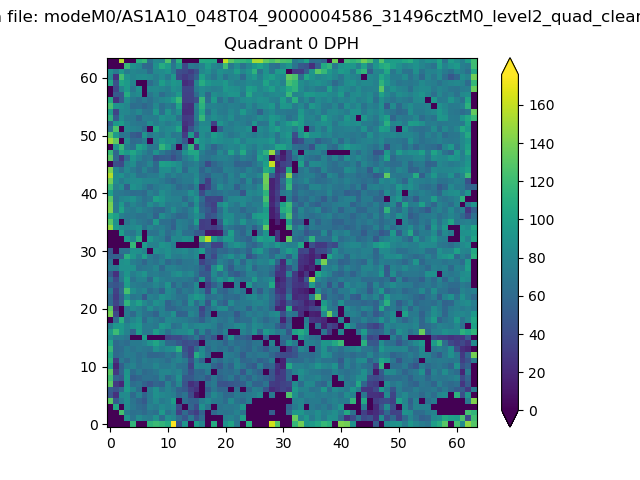 |
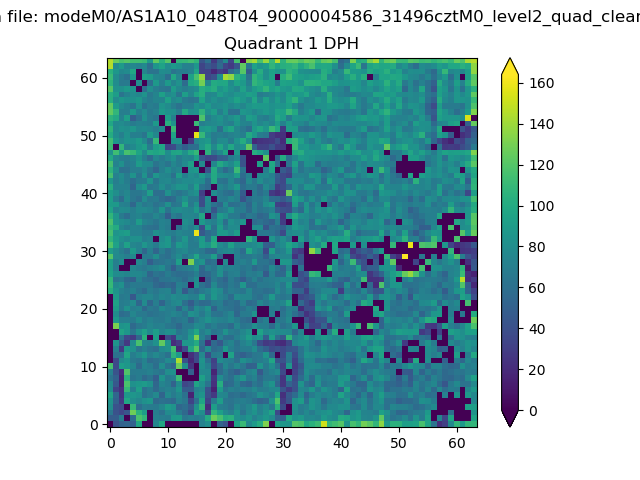 |
Quadrant B |
|---|---|---|---|
| Quadrant D | 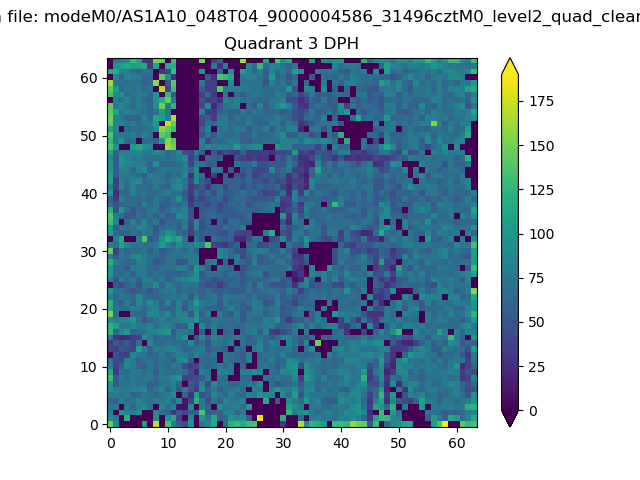 |
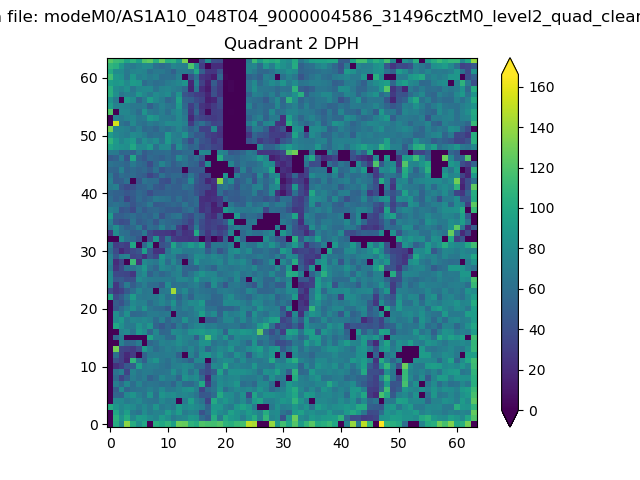 |
Quadrant C |
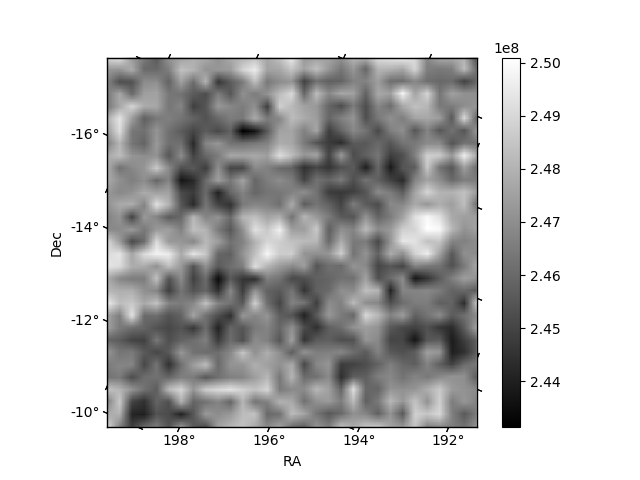
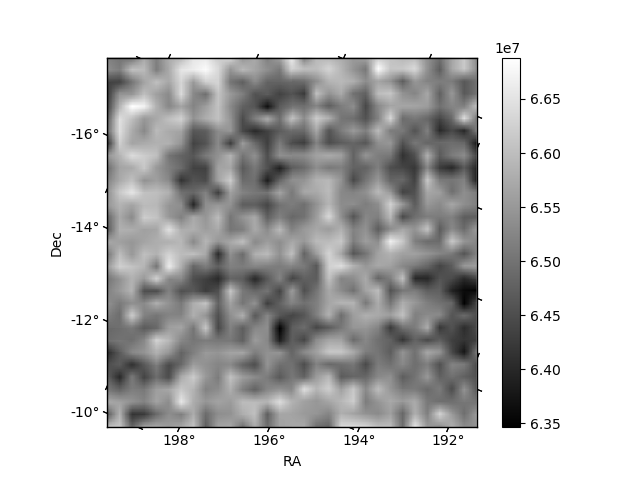
| Plot type | Count rate plots | Images |
|---|---|---|
| Comparison with Poisson distribution Blue bars denote a histogram of data divided into 1 sec bins. Red curve is a Poisson curve with rate = median count rate of data. |
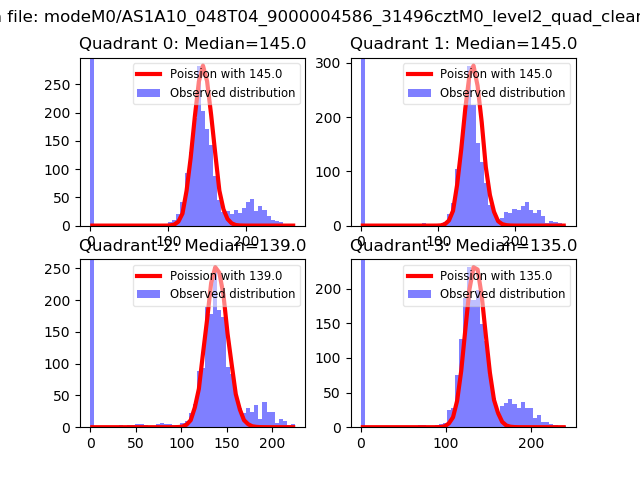 |
 |
| Quadrant-wise count rates Data is divided into 100 sec bins |
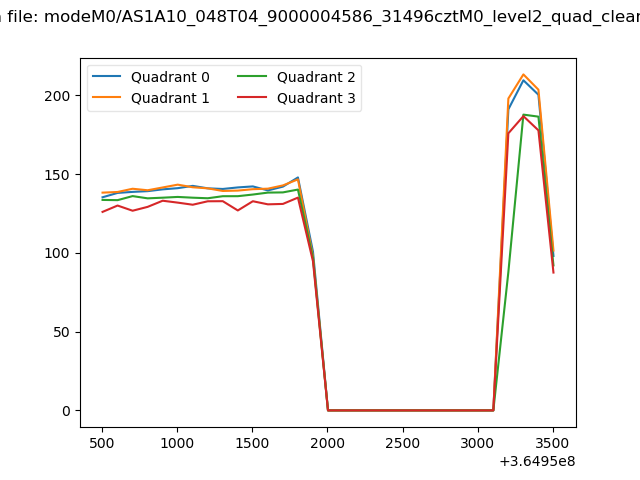 |
|
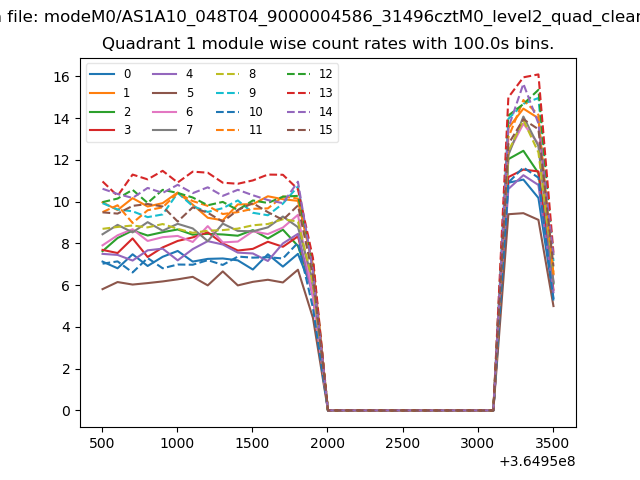
| Module-wise count rates for Quadrant A Data is divided into 100 sec bins |
 |
 |
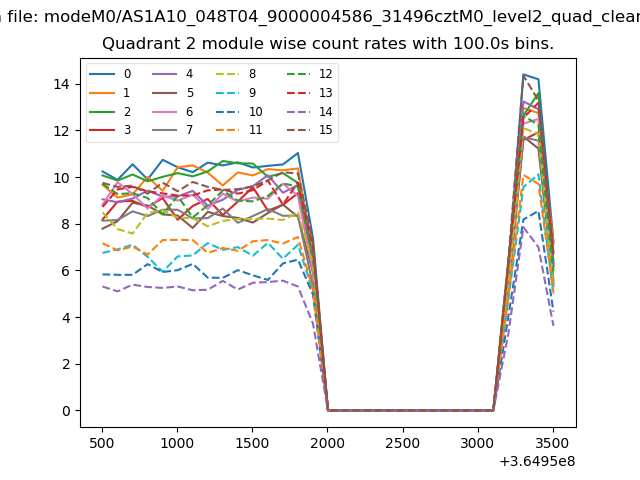
| Module-wise count rates for Quadrant B Data is divided into 100 sec bins |
 |
 |
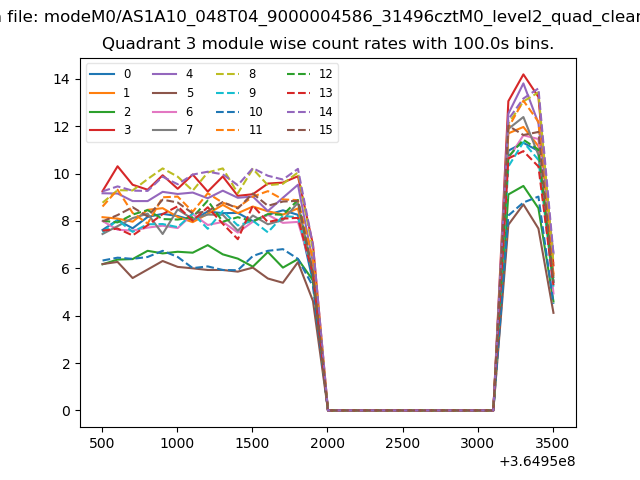
| Module-wise count rates for Quadrant C Data is divided into 100 sec bins |
 |
 |
| Module-wise count rates for Quadrant D Data is divided into 100 sec bins |
 |
 |
| Parameter | Plot |
|---|---|
| CZT HV Monitor |  |
| D_VDD | 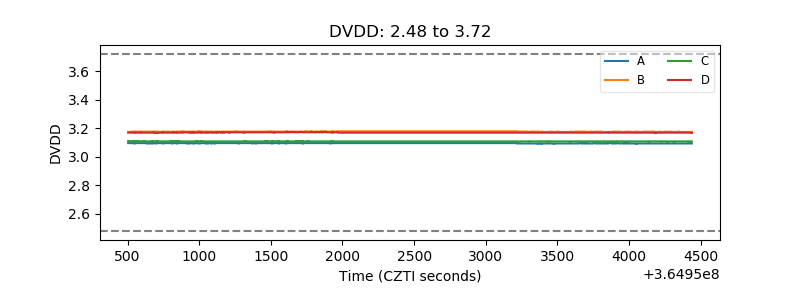 |
| Temperature 1 |  |
| Veto HV Monitor | 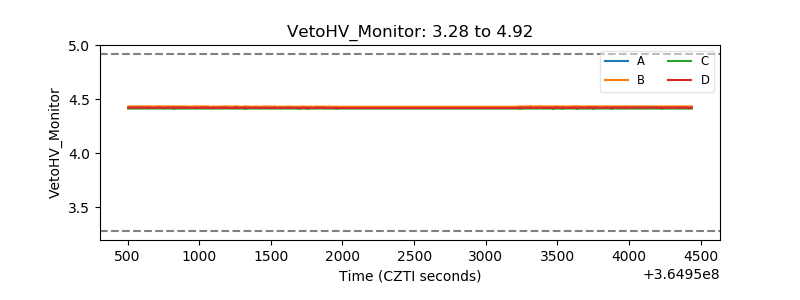 |
| Veto LLD | 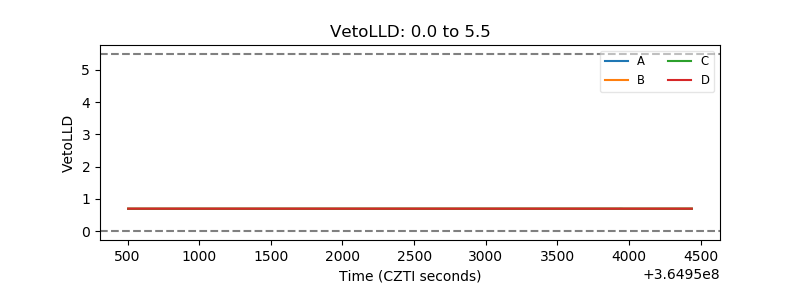 |
| Alpha Counter | 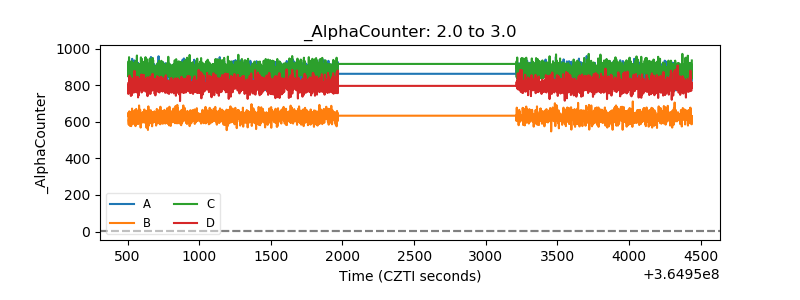 |
| _CPM_Rate | 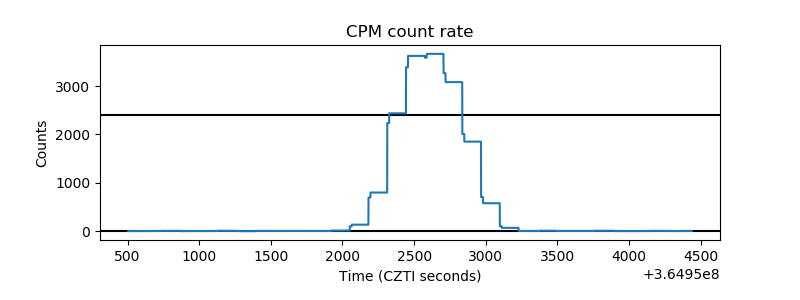 |
| CZT Counter | 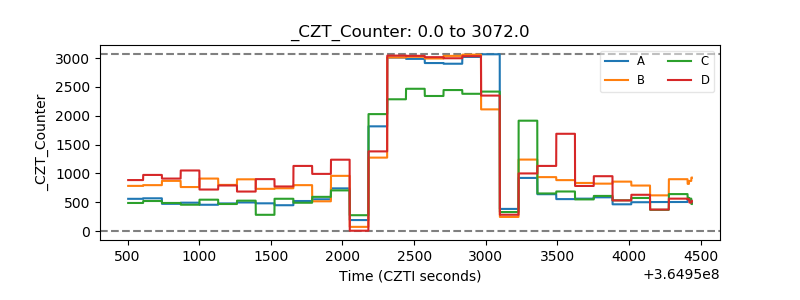 |
| +2.5 Volts monitor |  |
| +5 Volts monitor |  |
| _ROLL_ROT | 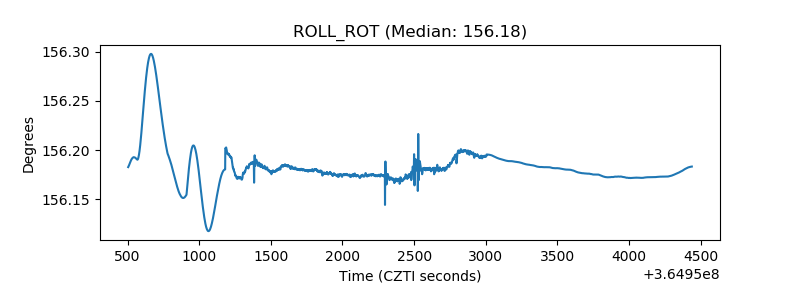 |
| _Roll_DEC | 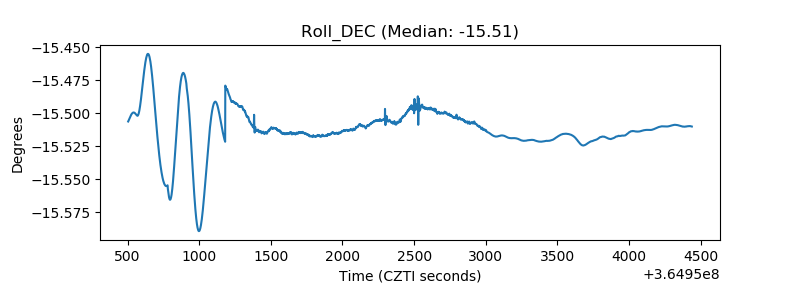 |
| _Roll_RA | 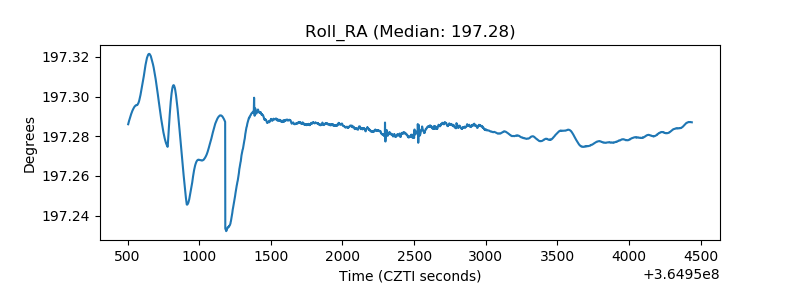 |
| Veto Counter | 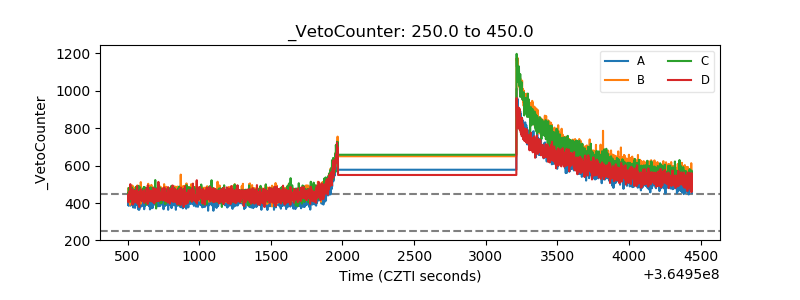 |