| Param | Original file | Final file |
|---|---|---|
| Filename | modeM0/AS1A10_048T04_9000004586_31497cztM0_level2.evt | modeM0/AS1A10_048T04_9000004586_31497cztM0_level2_quad_clean.evt |
| Size (bytes) | 483,750,720 | 57,813,120 |
| Size | 461.3 MB | 55.1 MB |
| Events in quadrant A | 3,048,836 | 355,191 |
| Events in quadrant B | 4,553,352 | 355,228 |
| Events in quadrant C | 3,239,116 | 336,289 |
| Events in quadrant D | 3,441,377 | 323,628 |
| Mode M0 | |||
|---|---|---|---|
| Quadrant | BADHDUFLAG | Total packets | Discarded packets |
| A | 0 | 13677 | 1494 |
| B | 0 | 19252 | 2232 |
| C | 0 | 14258 | 1551 |
| D | 0 | 15478 | 1954 |
| Mode SS | |||
|---|---|---|---|
| Quadrant | BADHDUFLAG | Total packets | Discarded packets |
| A | 0 | 123 | 15 |
| B | 0 | 125 | 15 |
| C | 0 | 124 | 18 |
| D | 0 | 126 | 18 |
| Mode M9 | |||
|---|---|---|---|
| Quadrant | BADHDUFLAG | Total packets | Discarded packets |
| A | 0 | 13 | 1 |
| B | 0 | 14 | 2 |
| C | 0 | 13 | 1 |
| D | 0 | 14 | 2 |
| Quadrant | Total seconds | Saturated seconds | Saturation percentage |
|---|---|---|---|
| A | 5454 | 57 | 1.045105% |
| B | 5425 | 99 | 1.824885% |
| C | 5446 | 189 | 3.470437% |
| D | 5422 | 63 | 1.161933% |
Noise dominated data is calculated using 1-second bins in cleaned event files. If a bin has >2000 counts, and if more than 50% of those come from <1% of pixels, then it is considered to be noise-dominated and hence unusable.
| Quadrant | # 1 sec bins | Bins with >0 counts | Bins with >2000 counts | High rate bins dominated by noise | Noise dominated (total time) | Noise dominated (detector-on time) | Marked lightcurve |
|---|---|---|---|---|---|---|---|
| A | 7670 | 5512 | 13 | 13 | 0.17% | 0.24% |  |
| B | 7670 | 5479 | 1 | 1 | 0.01% | 0.02% |  |
| C | 7669 | 5506 | 79 | 79 | 1.03% | 1.43% | 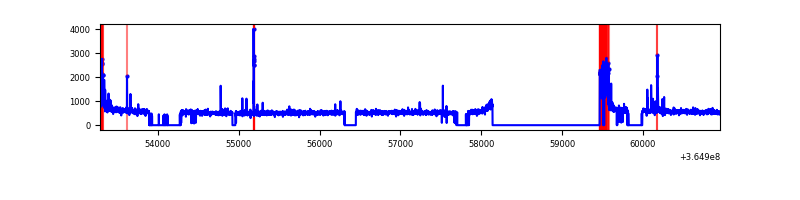 |
| D | 7670 | 5487 | 39 | 39 | 0.51% | 0.71% | 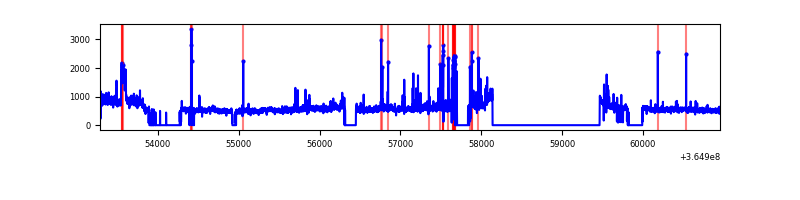 |
Top three noisy pixels from each quadrant. If the there are fewer than three noisy pixels in the level2.evt file, extra rows are filled as -1
| Pixel properties | Quadrant properties | ||||||
|---|---|---|---|---|---|---|---|
| Quadrant | DetID | PixID | Counts | Sigma | Mean | Median | Sigma |
| A | 0 | 13 | 88599 | 581.24 | 767 | 755 | 151.1 |
| A | 13 | 254 | 9658 | 58.91 | 767 | 755 | 151.1 |
| A | 3 | 137 | 7200 | 42.64 | 767 | 755 | 151.1 |
| B | 6 | 159 | 1464785 | 10322.53 | 759 | 742 | 141.8 |
| B | 4 | 80 | 42503 | 294.44 | 759 | 742 | 141.8 |
| B | 15 | 33 | 25797 | 176.66 | 759 | 742 | 141.8 |
| C | 0 | 10 | 246125 | 1469.28 | 717 | 722 | 167.0 |
| C | 14 | 238 | 118964 | 707.94 | 717 | 722 | 167.0 |
| C | 12 | 249 | 31187 | 182.4 | 717 | 722 | 167.0 |
| D | 8 | 195 | 494653 | 2902.22 | 721 | 705 | 170.2 |
| D | 2 | 250 | 111797 | 652.73 | 721 | 705 | 170.2 |
| D | 12 | 79 | 45166 | 261.23 | 721 | 705 | 170.2 |
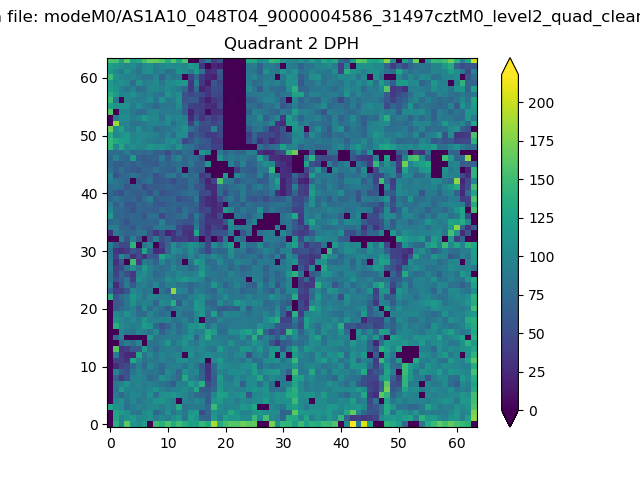
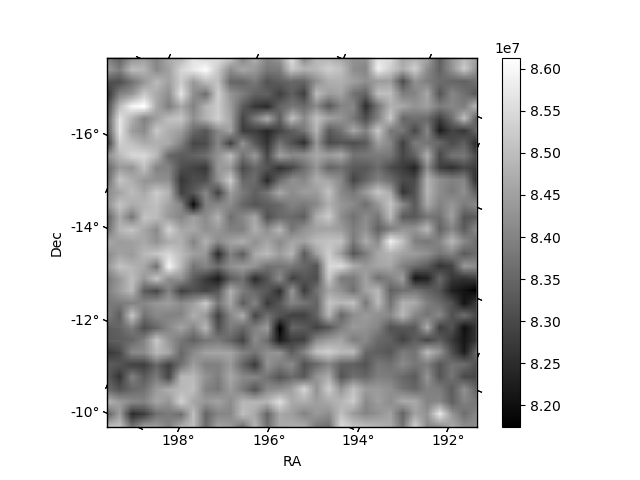
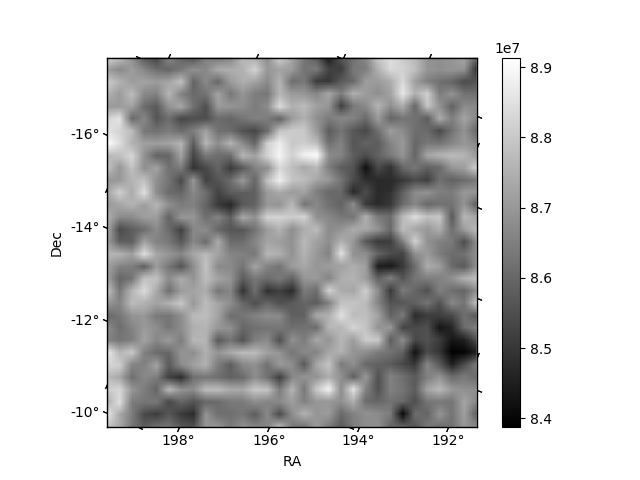
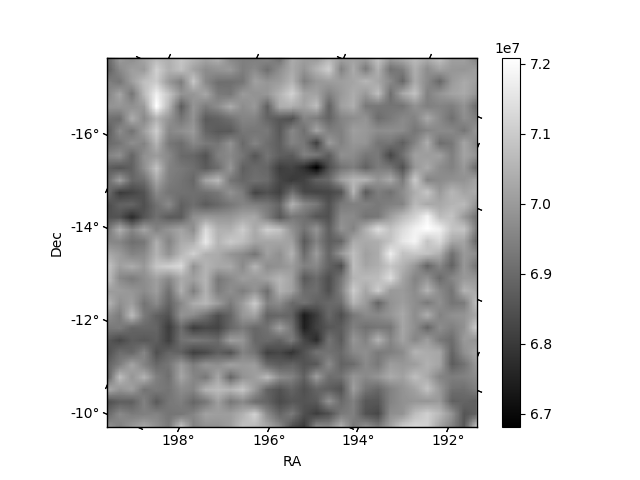
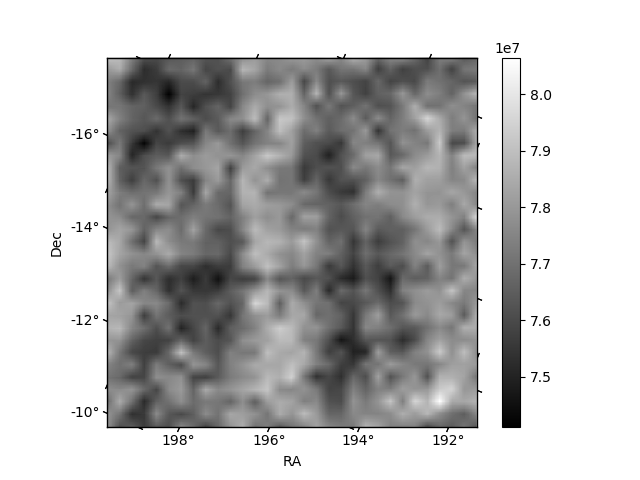
Histogram calculated using DETX and DETY for each event in the final _common_clean file
| Quadrant A | 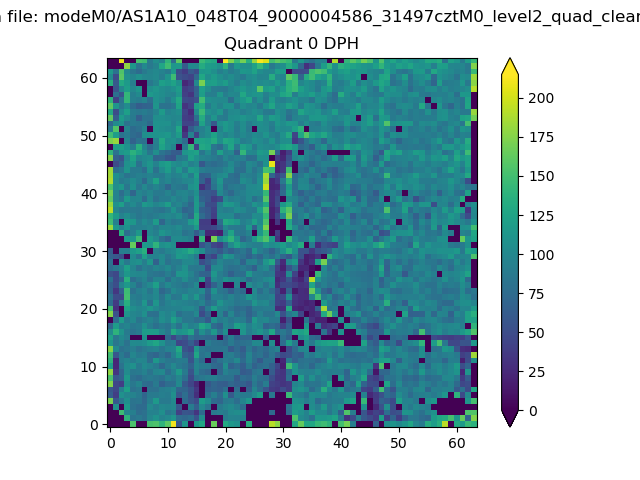 |
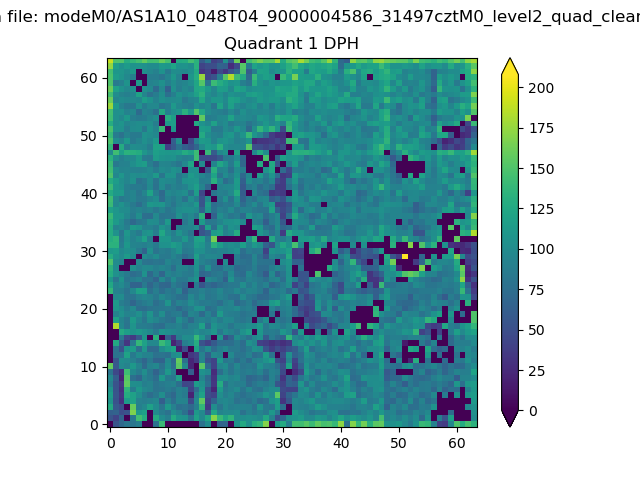 |
Quadrant B |
|---|---|---|---|
| Quadrant D | 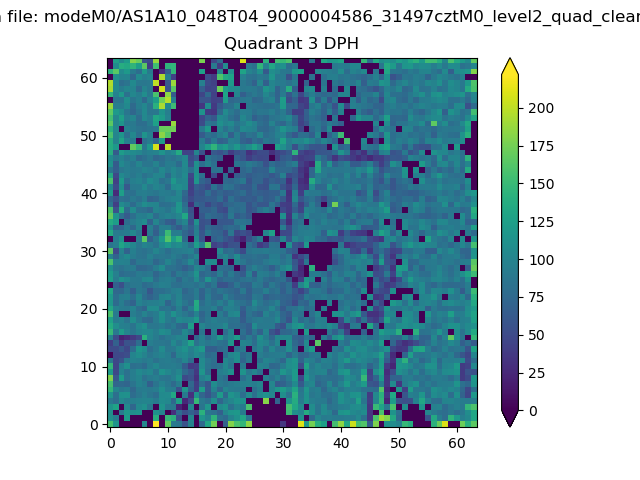 |
 |
Quadrant C |
| Plot type | Count rate plots | Images |
|---|---|---|
| Comparison with Poisson distribution Blue bars denote a histogram of data divided into 1 sec bins. Red curve is a Poisson curve with rate = median count rate of data. |
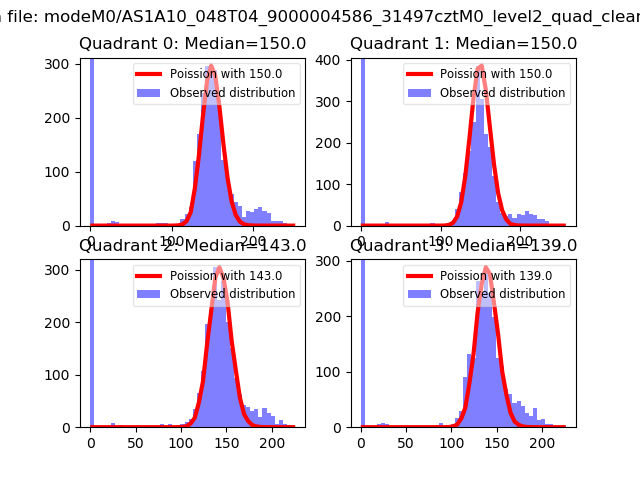 |
 |
| Quadrant-wise count rates Data is divided into 100 sec bins |
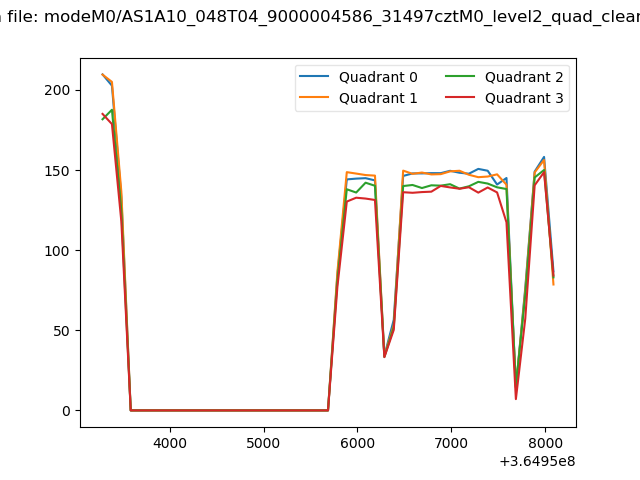 |
|
| Module-wise count rates for Quadrant A Data is divided into 100 sec bins |
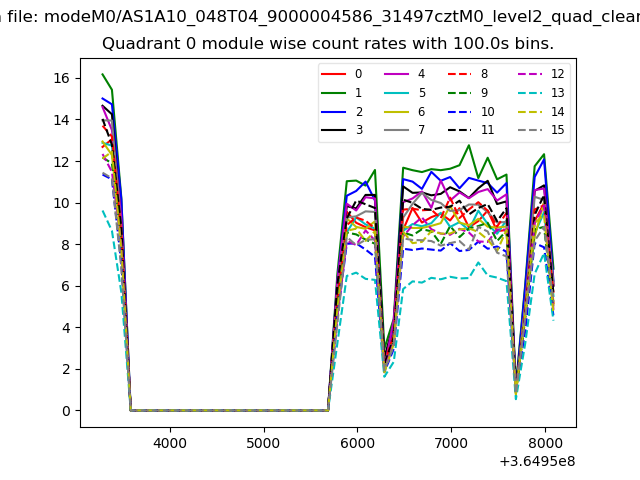 |
 |
| Module-wise count rates for Quadrant B Data is divided into 100 sec bins |
 |
 |
| Module-wise count rates for Quadrant C Data is divided into 100 sec bins |
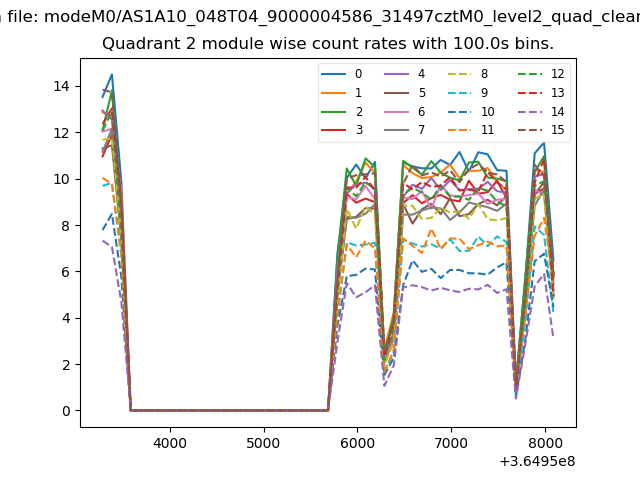 |
 |
| Module-wise count rates for Quadrant D Data is divided into 100 sec bins |
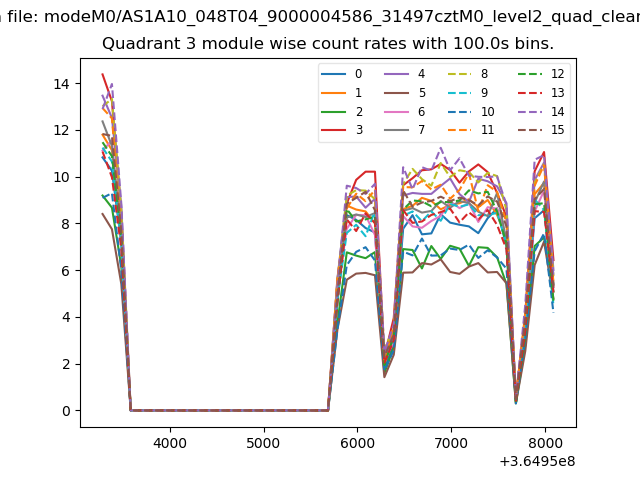 |
 |
| Parameter | Plot |
|---|---|
| CZT HV Monitor | 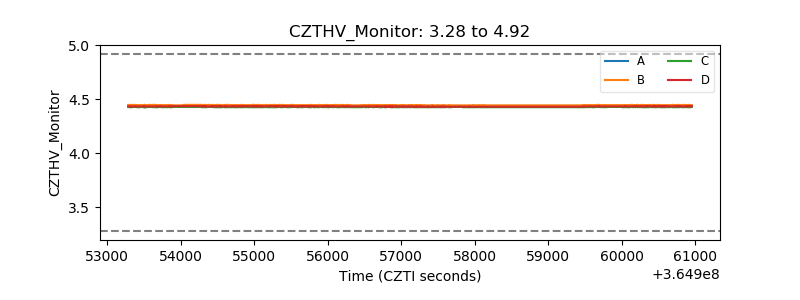 |
| D_VDD | 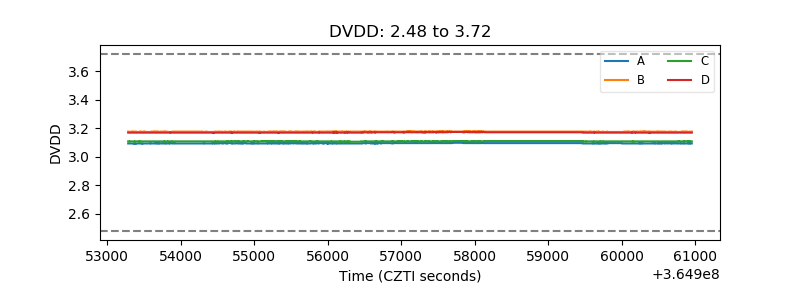 |
| Temperature 1 | 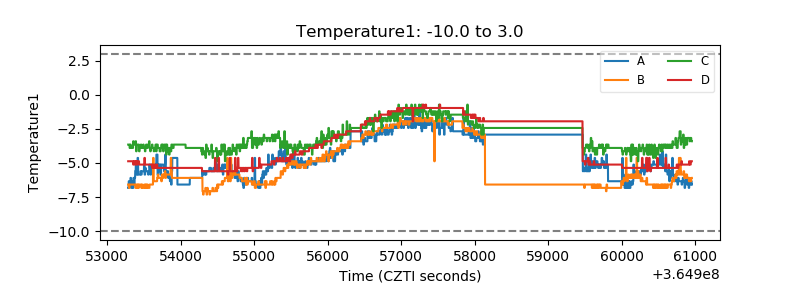 |
| Veto HV Monitor | 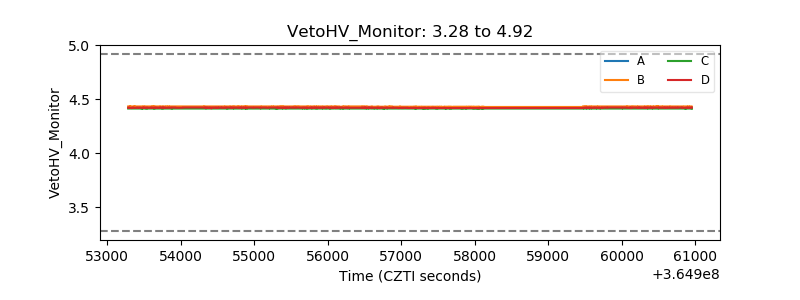 |
| Veto LLD |  |
| Alpha Counter | 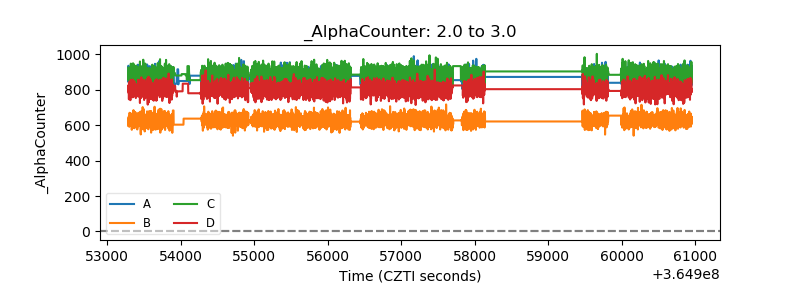 |
| _CPM_Rate | 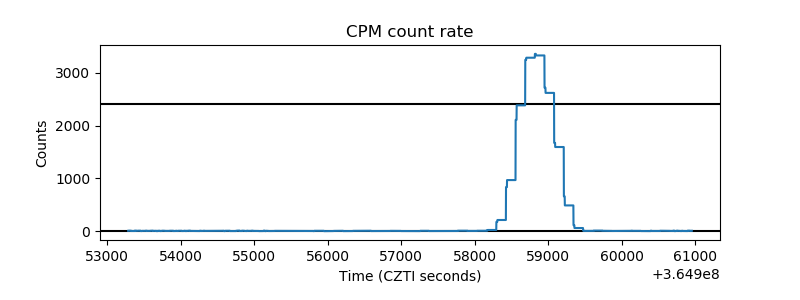 |
| CZT Counter |  |
| +2.5 Volts monitor |  |
| +5 Volts monitor |  |
| _ROLL_ROT | 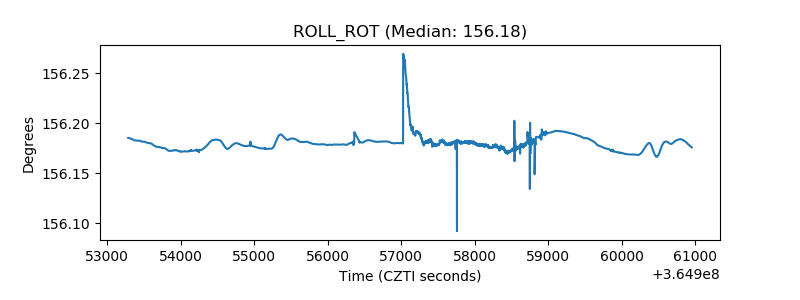 |
| _Roll_DEC | 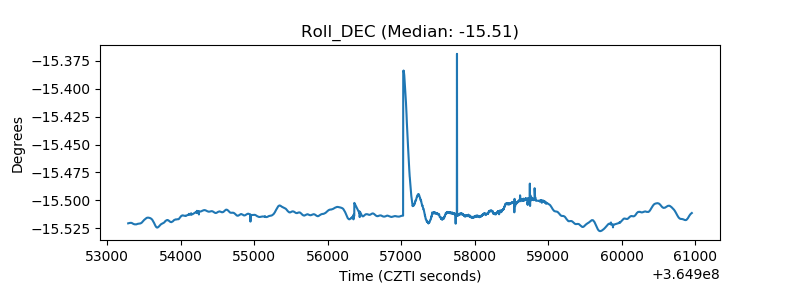 |
| _Roll_RA | 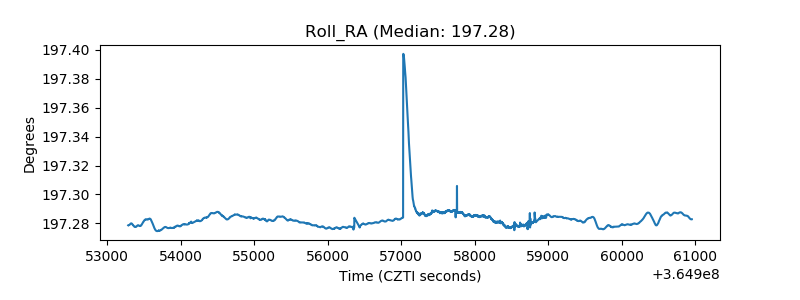 |
| Veto Counter | 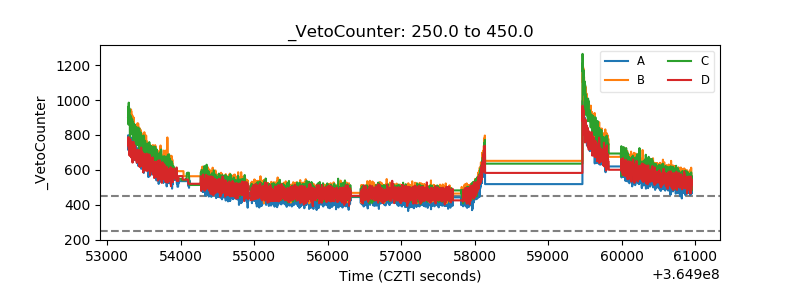 |