| Param | Original file | Final file |
|---|---|---|
| Filename | modeM0/AS1A10_119T01_9000004590cztM0_level2.fits | modeM0/AS1A10_119T01_9000004590cztM0_level2_quad_clean.evt |
| Size (bytes) | 445,248,000 | 321,569,280 |
| Size | 424.6 MB | 306.7 MB |
| Events in quadrant A | 2,547,552 | 1,618,482 |
| Events in quadrant B | 2,674,818 | 1,759,622 |
| Events in quadrant C | 2,742,652 | 1,701,629 |
| Events in quadrant D | 2,390,294 | 1,532,669 |
| Mode M9 | |||
|---|---|---|---|
| Quadrant | BADHDUFLAG | Total packets | Discarded packets |
| A | 0 | 70 | 0 |
| B | 0 | 70 | 0 |
| C | 0 | 69 | 0 |
| D | 0 | 70 | 0 |
| Mode M0 | |||
|---|---|---|---|
| Quadrant | BADHDUFLAG | Total packets | Discarded packets |
| A | 0 | 150133 | 0 |
| B | 0 | 142010 | 0 |
| C | 0 | 102893 | 0 |
| D | 0 | 122912 | 0 |
| Mode SS | |||
|---|---|---|---|
| Quadrant | BADHDUFLAG | Total packets | Discarded packets |
| A | 0 | 928 | 0 |
| B | 0 | 926 | 0 |
| C | 0 | 926 | 0 |
| D | 0 | 925 | 0 |
| Quadrant | Total seconds | Saturated seconds | Saturation percentage |
|---|---|---|---|
| A | 45478 | 8193 | 18.015304% |
| B | 45398 | 1319 | 2.905414% |
| C | 45550 | 1096 | 2.406147% |
| D | 45598 | 1748 | 3.833501% |
Noise dominated data is calculated using 1-second bins in cleaned event files. If a bin has >2000 counts, and if more than 50% of those come from <1% of pixels, then it is considered to be noise-dominated and hence unusable.
| Quadrant | # 1 sec bins | Bins with >0 counts | Bins with >2000 counts | High rate bins dominated by noise | Noise dominated (total time) | Noise dominated (detector-on time) | Marked lightcurve |
|---|---|---|---|---|---|---|---|
| A | 65038 | 45476 | 0 | 0 | 0.00% | 0.00% |  |
| B | 65041 | 45743 | 0 | 0 | 0.00% | 0.00% |  |
| C | 65041 | 45914 | 0 | 0 | 0.00% | 0.00% |  |
| D | 65041 | 45966 | 0 | 0 | 0.00% | 0.00% |  |
Top three noisy pixels from each quadrant. If the there are fewer than three noisy pixels in the level2.evt file, extra rows are filled as -1
| Pixel properties | Quadrant properties | ||||||
|---|---|---|---|---|---|---|---|
| Quadrant | DetID | PixID | Counts | Sigma | Mean | Median | Sigma |
| A | 0 | 29 | 2082 | 8.93 | 663 | 626 | 163.1 |
| A | 7 | 110 | 2081 | 8.92 | 663 | 626 | 163.1 |
| A | 9 | 19 | 1875 | 7.66 | 663 | 626 | 163.1 |
| B | 2 | 9 | 2125 | 10.18 | 708 | 676 | 142.4 |
| B | 5 | 255 | 1772 | 7.7 | 708 | 676 | 142.4 |
| B | 3 | 80 | 1768 | 7.67 | 708 | 676 | 142.4 |
| C | 12 | 241 | 2011 | 7.15 | 727 | 682 | 185.9 |
| C | 3 | 126 | 1832 | 6.19 | 727 | 682 | 185.9 |
| C | 3 | 187 | 1831 | 6.18 | 727 | 682 | 185.9 |
| D | 3 | 14 | 1743 | 6.17 | 682 | 622 | 181.8 |
| D | 7 | 3 | 1685 | 5.85 | 682 | 622 | 181.8 |
| D | 10 | 189 | 1625 | 5.52 | 682 | 622 | 181.8 |
Histogram calculated using DETX and DETY for each event in the final _common_clean file
| Quadrant A |  |
 |
Quadrant B |
|---|---|---|---|
| Quadrant D |  |
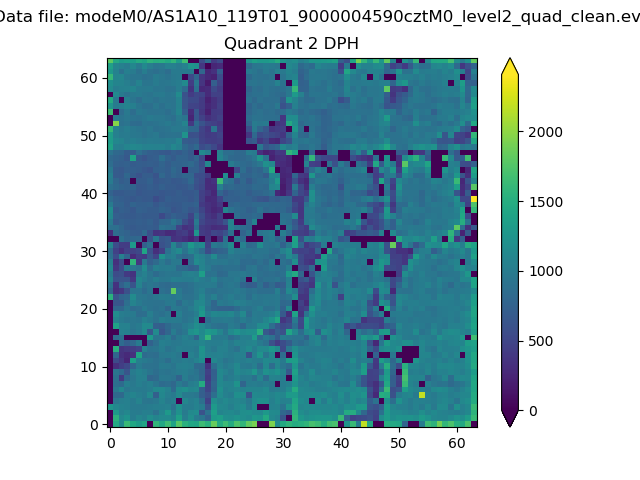 |
Quadrant C |
| Plot type | Count rate plots | Images |
|---|---|---|
| Comparison with Poisson distribution Blue bars denote a histogram of data divided into 1 sec bins. Red curve is a Poisson curve with rate = median count rate of data. |
 |
 |
| Quadrant-wise count rates Data is divided into 100 sec bins |
 |
|
| Module-wise count rates for Quadrant A Data is divided into 100 sec bins |
 |
 |
| Module-wise count rates for Quadrant B Data is divided into 100 sec bins |
 |
 |
| Module-wise count rates for Quadrant C Data is divided into 100 sec bins |
 |
 |
| Module-wise count rates for Quadrant D Data is divided into 100 sec bins |
 |
 |
| Parameter | Plot |
|---|---|
| CZT HV Monitor |  |
| D_VDD |  |
| Temperature 1 |  |
| Veto HV Monitor |  |
| Veto LLD |  |
| Alpha Counter |  |
| _CPM_Rate |  |
| CZT Counter |  |
| +2.5 Volts monitor |  |
| +5 Volts monitor |  |
| _ROLL_ROT |  |
| _Roll_DEC |  |
| _Roll_RA |  |
| Veto Counter |  |