| Param | Original file | Final file |
|---|---|---|
| Filename | modeM0/AS1A10_119T01_9000004590_31507cztM0_level2.evt | modeM0/AS1A10_119T01_9000004590_31507cztM0_level2_quad_clean.evt |
| Size (bytes) | 545,192,640 | 58,855,680 |
| Size | 519.9 MB | 56.1 MB |
| Events in quadrant A | 5,989,099 | 306,483 |
| Events in quadrant B | 4,209,189 | 382,165 |
| Events in quadrant C | 2,620,030 | 372,135 |
| Events in quadrant D | 3,345,172 | 361,059 |
| Mode M9 | |||
|---|---|---|---|
| Quadrant | BADHDUFLAG | Total packets | Discarded packets |
| A | 0 | 10 | 0 |
| B | 0 | 10 | 0 |
| C | 0 | 10 | 0 |
| D | 0 | 10 | 0 |
| Mode M0 | |||
|---|---|---|---|
| Quadrant | BADHDUFLAG | Total packets | Discarded packets |
| A | 0 | 21189 | 1 |
| B | 0 | 16176 | 1 |
| C | 0 | 11137 | 1 |
| D | 0 | 13300 | 2 |
| Mode SS | |||
|---|---|---|---|
| Quadrant | BADHDUFLAG | Total packets | Discarded packets |
| A | 0 | 104 | 0 |
| B | 0 | 104 | 0 |
| C | 0 | 104 | 0 |
| D | 0 | 104 | 0 |
| Quadrant | Total seconds | Saturated seconds | Saturation percentage |
|---|---|---|---|
| A | 5134 | 1495 | 29.119595% |
| B | 5134 | 148 | 2.882743% |
| C | 5134 | 104 | 2.025711% |
| D | 5133 | 109 | 2.123515% |
Noise dominated data is calculated using 1-second bins in cleaned event files. If a bin has >2000 counts, and if more than 50% of those come from <1% of pixels, then it is considered to be noise-dominated and hence unusable.
| Quadrant | # 1 sec bins | Bins with >0 counts | Bins with >2000 counts | High rate bins dominated by noise | Noise dominated (total time) | Noise dominated (detector-on time) | Marked lightcurve |
|---|---|---|---|---|---|---|---|
| A | 6064 | 5134 | 1202 | 1202 | 19.82% | 23.41% | 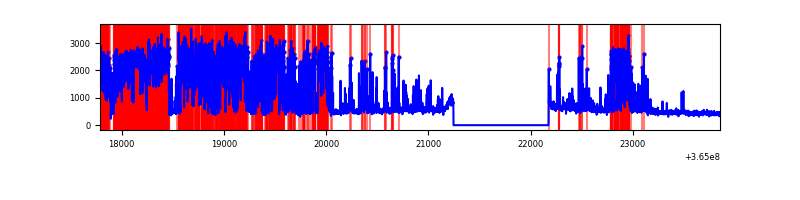 |
| B | 6064 | 5134 | 63 | 63 | 1.04% | 1.23% | 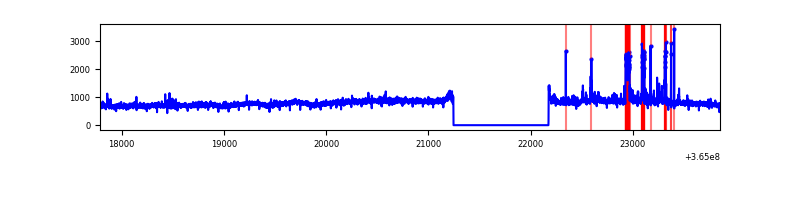 |
| C | 6064 | 5134 | 16 | 16 | 0.26% | 0.31% |  |
| D | 6063 | 5133 | 70 | 70 | 1.15% | 1.36% | 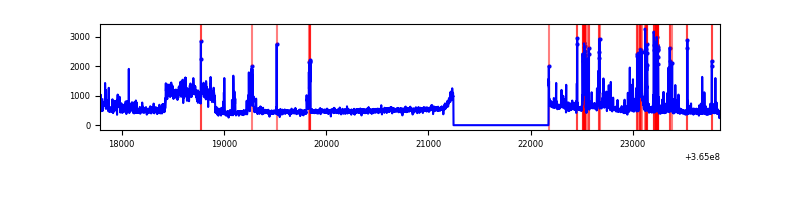 |
Top three noisy pixels from each quadrant. If the there are fewer than three noisy pixels in the level2.evt file, extra rows are filled as -1
| Pixel properties | Quadrant properties | ||||||
|---|---|---|---|---|---|---|---|
| Quadrant | DetID | PixID | Counts | Sigma | Mean | Median | Sigma |
| A | 0 | 13 | 3903850 | 35537.99 | 539 | 528 | 109.8 |
| A | 13 | 254 | 7831 | 66.49 | 539 | 528 | 109.8 |
| A | 3 | 137 | 5371 | 44.09 | 539 | 528 | 109.8 |
| B | 6 | 159 | 1491091 | 12360.64 | 619 | 602 | 120.6 |
| B | 5 | 172 | 179595 | 1484.39 | 619 | 602 | 120.6 |
| B | 4 | 80 | 45802 | 374.84 | 619 | 602 | 120.6 |
| C | 3 | 233 | 131847 | 927.75 | 598 | 602 | 141.5 |
| C | 14 | 238 | 96497 | 677.86 | 598 | 602 | 141.5 |
| C | 12 | 249 | 15881 | 108.0 | 598 | 602 | 141.5 |
| D | 8 | 195 | 368528 | 2550.78 | 600 | 583 | 144.2 |
| D | 12 | 79 | 320859 | 2220.32 | 600 | 583 | 144.2 |
| D | 13 | 249 | 174951 | 1208.81 | 600 | 583 | 144.2 |
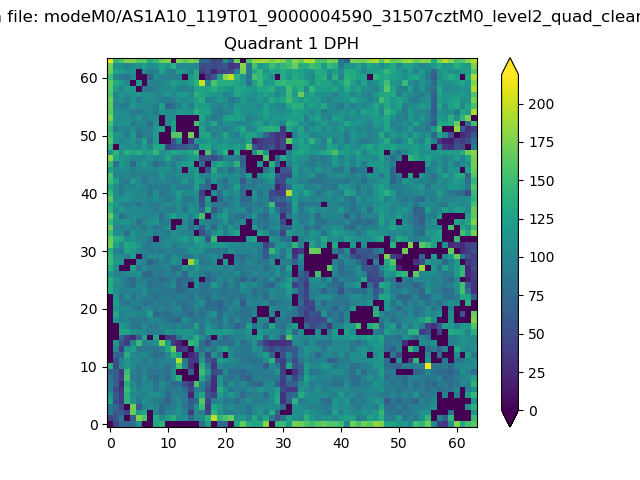
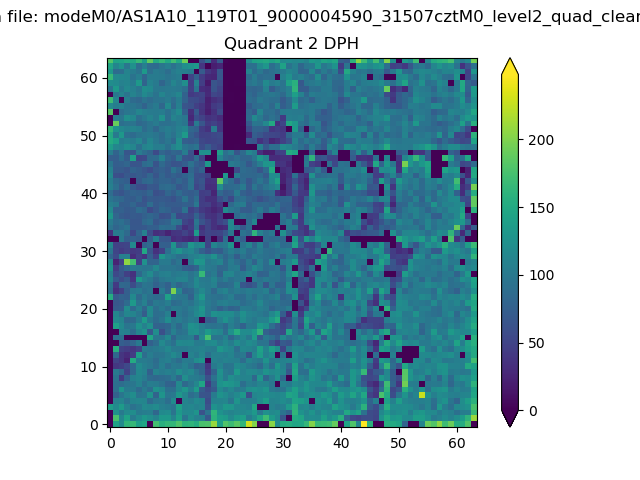
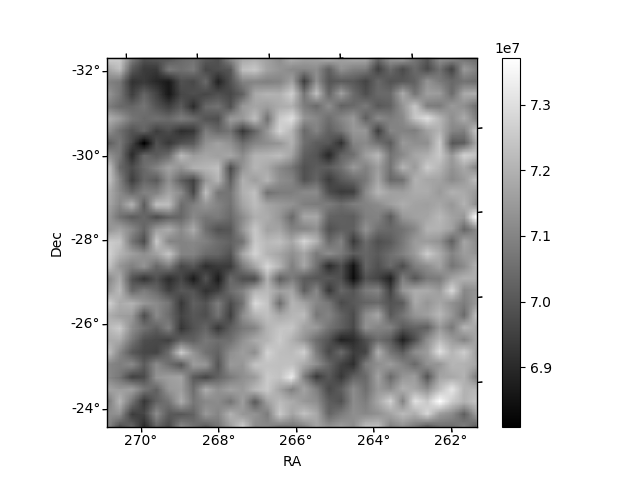
Histogram calculated using DETX and DETY for each event in the final _common_clean file
| Quadrant A | 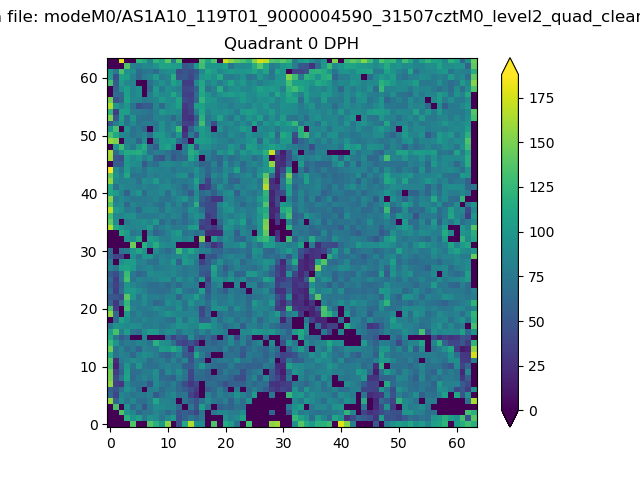 |
 |
Quadrant B |
|---|---|---|---|
| Quadrant D | 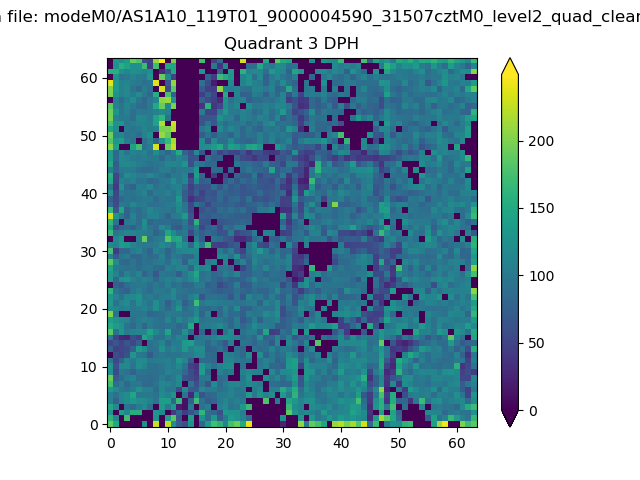 |
 |
Quadrant C |
| Plot type | Count rate plots | Images |
|---|---|---|
| Comparison with Poisson distribution Blue bars denote a histogram of data divided into 1 sec bins. Red curve is a Poisson curve with rate = median count rate of data. |
 |
 |
| Quadrant-wise count rates Data is divided into 100 sec bins |
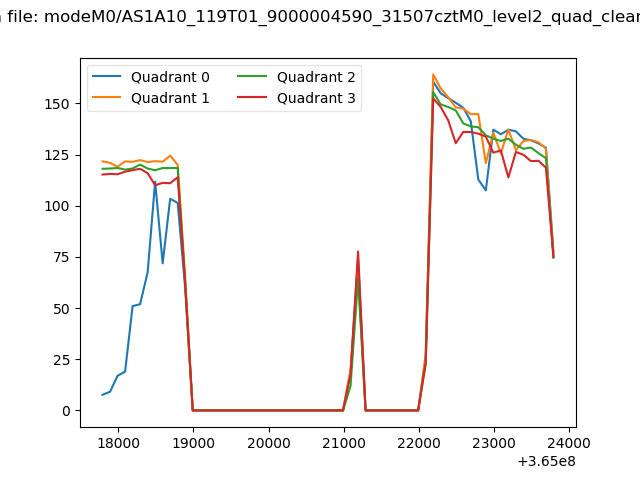 |
|
| Module-wise count rates for Quadrant A Data is divided into 100 sec bins |
 |
 |
| Module-wise count rates for Quadrant B Data is divided into 100 sec bins |
 |
 |
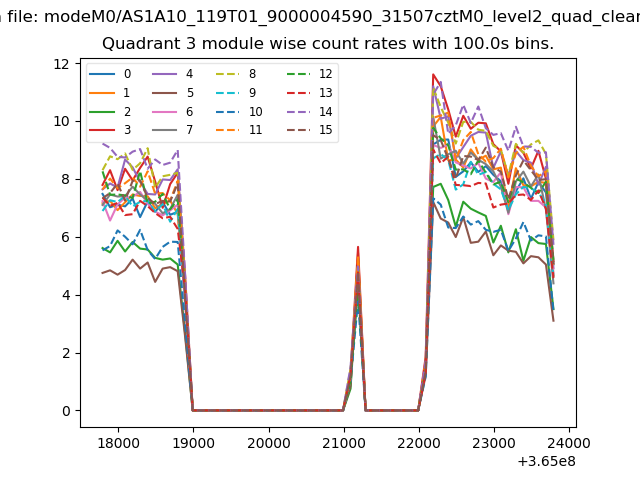
| Module-wise count rates for Quadrant C Data is divided into 100 sec bins |
 |
 |
| Module-wise count rates for Quadrant D Data is divided into 100 sec bins |
 |
 |
| Parameter | Plot |
|---|---|
| CZT HV Monitor |  |
| D_VDD | 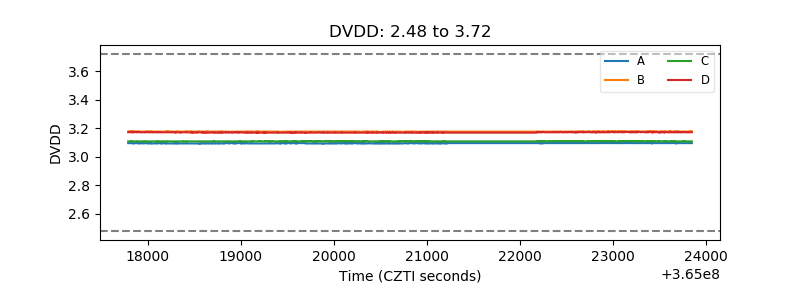 |
| Temperature 1 | 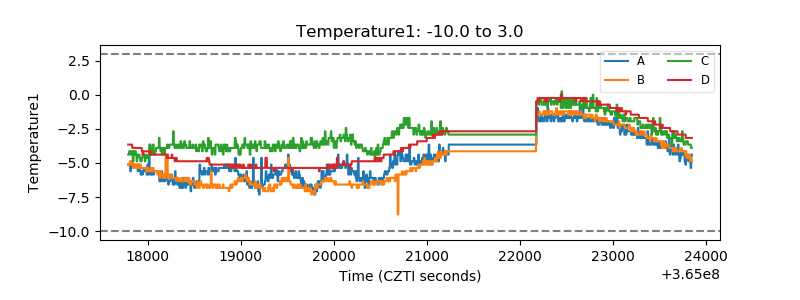 |
| Veto HV Monitor | 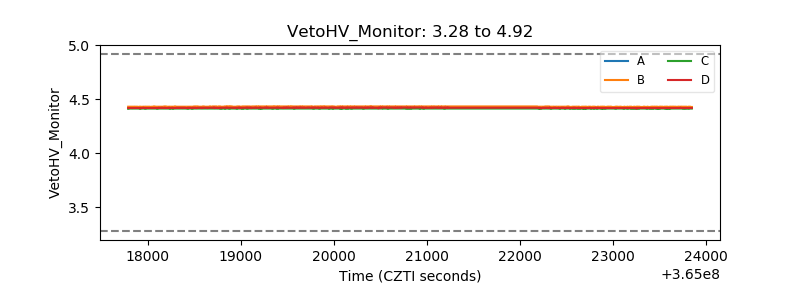 |
| Veto LLD | 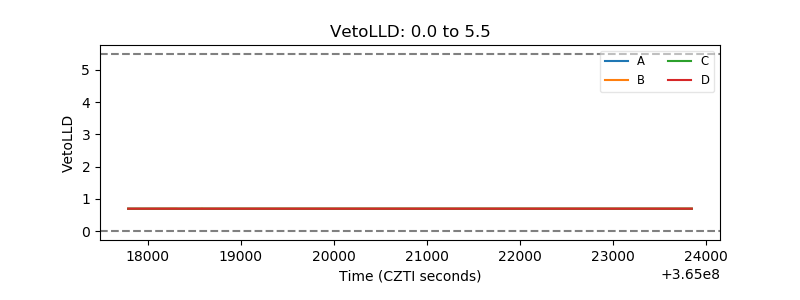 |
| Alpha Counter | 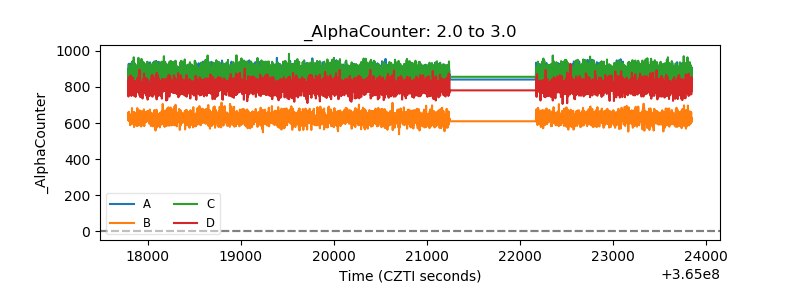 |
| _CPM_Rate | 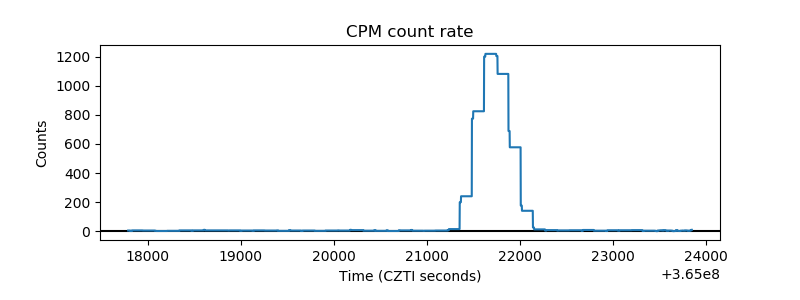 |
| CZT Counter | 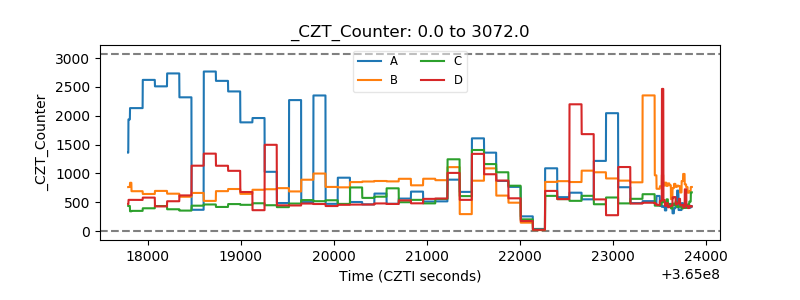 |
| +2.5 Volts monitor |  |
| +5 Volts monitor |  |
| _ROLL_ROT | 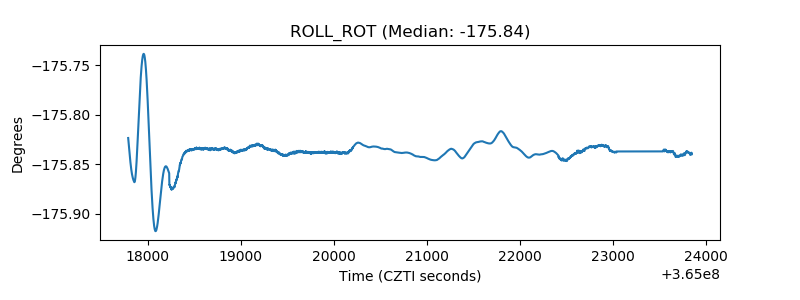 |
| _Roll_DEC | 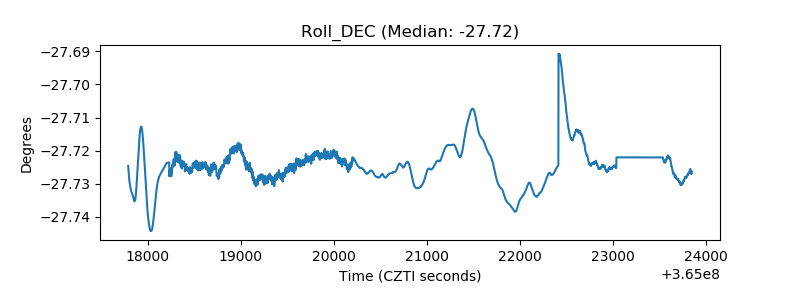 |
| _Roll_RA | 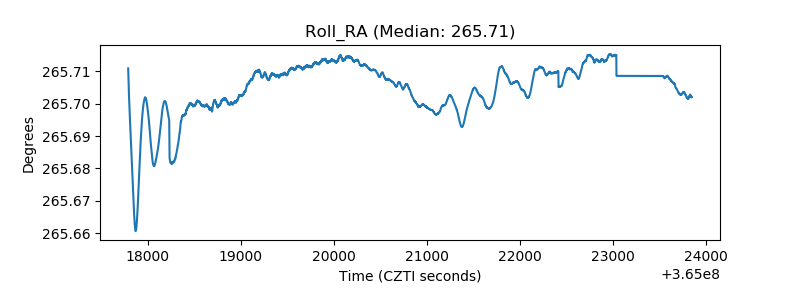 |
| Veto Counter |  |