| Param | Original file | Final file |
|---|---|---|
| Filename | modeM0/AS1A10_119T01_9000004590_31509cztM0_level2.evt | modeM0/AS1A10_119T01_9000004590_31509cztM0_level2_quad_clean.evt |
| Size (bytes) | 562,135,680 | 92,344,320 |
| Size | 536.1 MB | 88.1 MB |
| Events in quadrant A | 3,716,917 | 600,328 |
| Events in quadrant B | 5,453,527 | 601,515 |
| Events in quadrant C | 3,480,737 | 582,492 |
| Events in quadrant D | 3,932,409 | 557,970 |
| Mode M9 | |||
|---|---|---|---|
| Quadrant | BADHDUFLAG | Total packets | Discarded packets |
| A | 0 | 13 | 0 |
| B | 0 | 14 | 0 |
| C | 0 | 14 | 0 |
| D | 0 | 14 | 0 |
| Mode M0 | |||
|---|---|---|---|
| Quadrant | BADHDUFLAG | Total packets | Discarded packets |
| A | 0 | 15267 | 2 |
| B | 0 | 20825 | 2 |
| C | 0 | 14612 | 2 |
| D | 0 | 16022 | 2 |
| Mode SS | |||
|---|---|---|---|
| Quadrant | BADHDUFLAG | Total packets | Discarded packets |
| A | 0 | 132 | 0 |
| B | 0 | 132 | 0 |
| C | 0 | 132 | 0 |
| D | 0 | 132 | 0 |
| Quadrant | Total seconds | Saturated seconds | Saturation percentage |
|---|---|---|---|
| A | 6509 | 158 | 2.427408% |
| B | 6509 | 171 | 2.627132% |
| C | 6509 | 83 | 1.275157% |
| D | 6509 | 154 | 2.365955% |
Noise dominated data is calculated using 1-second bins in cleaned event files. If a bin has >2000 counts, and if more than 50% of those come from <1% of pixels, then it is considered to be noise-dominated and hence unusable.
| Quadrant | # 1 sec bins | Bins with >0 counts | Bins with >2000 counts | High rate bins dominated by noise | Noise dominated (total time) | Noise dominated (detector-on time) | Marked lightcurve |
|---|---|---|---|---|---|---|---|
| A | 7599 | 6509 | 117 | 117 | 1.54% | 1.80% | 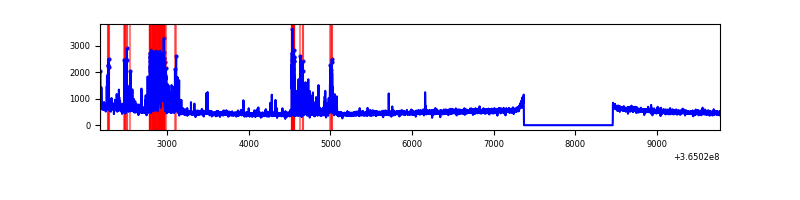 |
| B | 7599 | 6510 | 74 | 74 | 0.97% | 1.14% | 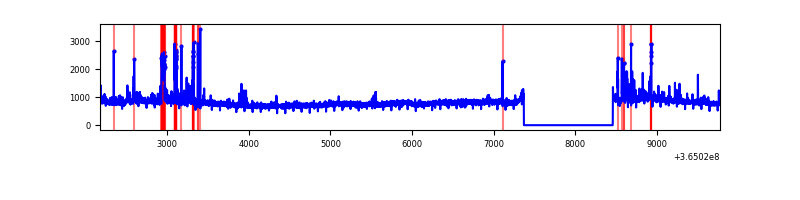 |
| C | 7599 | 6510 | 3 | 3 | 0.04% | 0.05% | 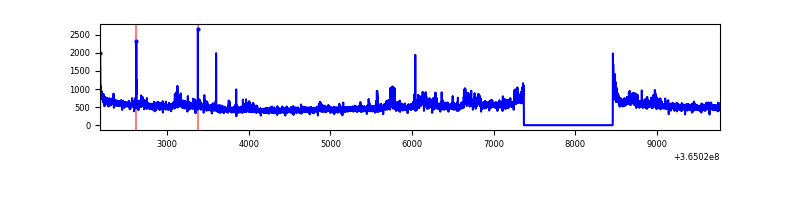 |
| D | 7599 | 6510 | 121 | 121 | 1.59% | 1.86% | 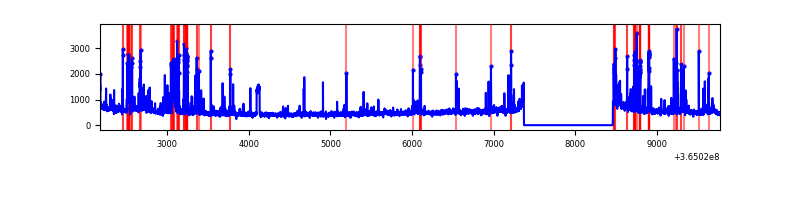 |
Top three noisy pixels from each quadrant. If the there are fewer than three noisy pixels in the level2.evt file, extra rows are filled as -1
| Pixel properties | Quadrant properties | ||||||
|---|---|---|---|---|---|---|---|
| Quadrant | DetID | PixID | Counts | Sigma | Mean | Median | Sigma |
| A | 0 | 13 | 581723 | 3585.09 | 810 | 795 | 162.0 |
| A | 13 | 254 | 12212 | 70.46 | 810 | 795 | 162.0 |
| A | 3 | 137 | 7999 | 44.46 | 810 | 795 | 162.0 |
| B | 6 | 159 | 1880059 | 12186.73 | 807 | 789 | 154.2 |
| B | 5 | 172 | 274129 | 1772.56 | 807 | 789 | 154.2 |
| B | 0 | 245 | 41845 | 266.24 | 807 | 789 | 154.2 |
| C | 3 | 233 | 210371 | 1151.66 | 776 | 782 | 182.0 |
| C | 14 | 238 | 124731 | 681.08 | 776 | 782 | 182.0 |
| C | 12 | 249 | 28569 | 152.68 | 776 | 782 | 182.0 |
| D | 13 | 249 | 355696 | 1921.6 | 774 | 756 | 184.7 |
| D | 8 | 195 | 286798 | 1548.59 | 774 | 756 | 184.7 |
| D | 12 | 233 | 172129 | 927.79 | 774 | 756 | 184.7 |
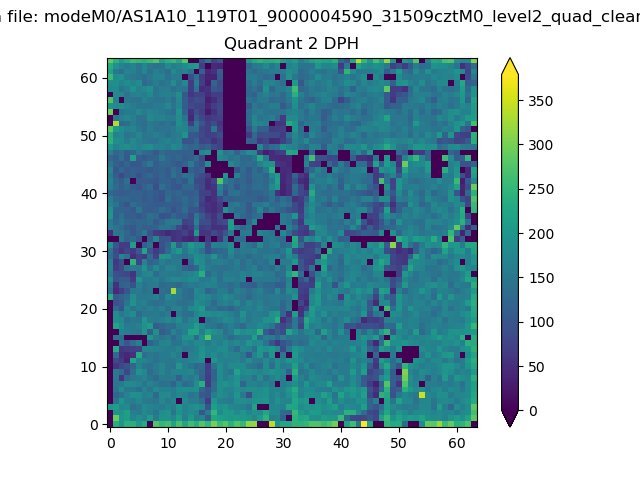
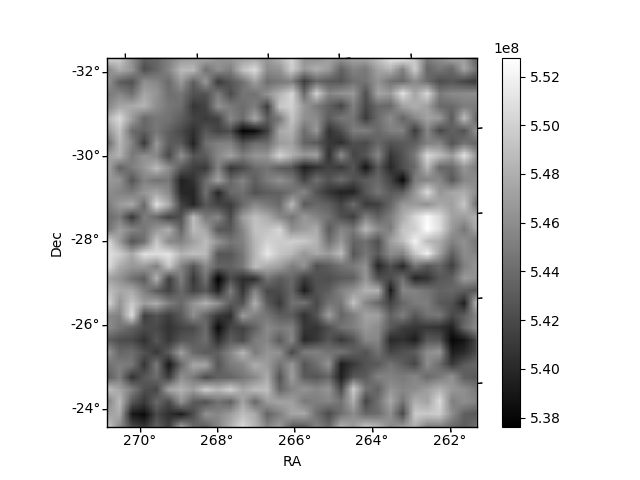
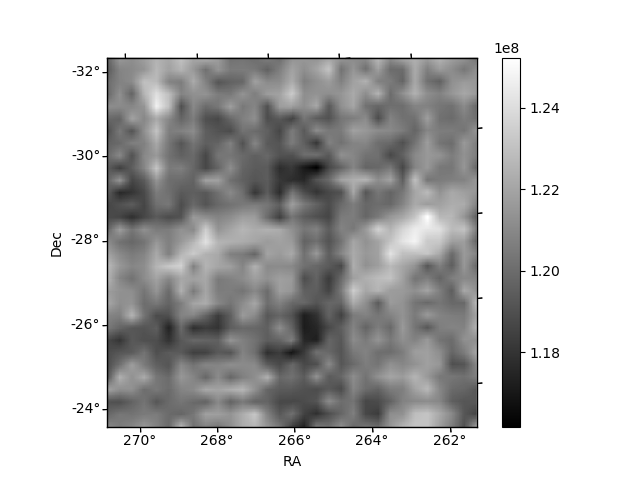
Histogram calculated using DETX and DETY for each event in the final _common_clean file
| Quadrant A | 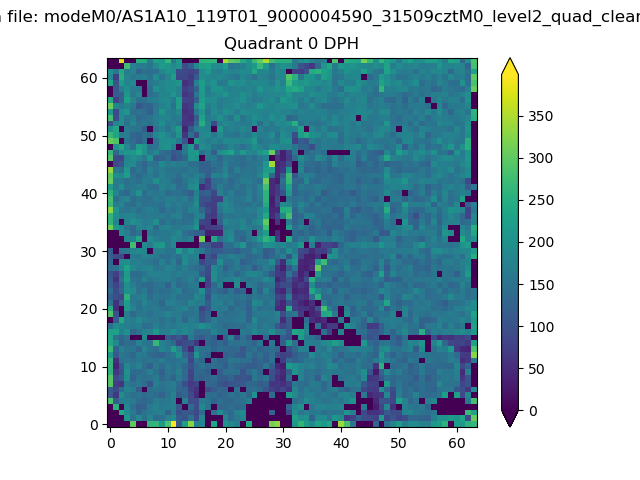 |
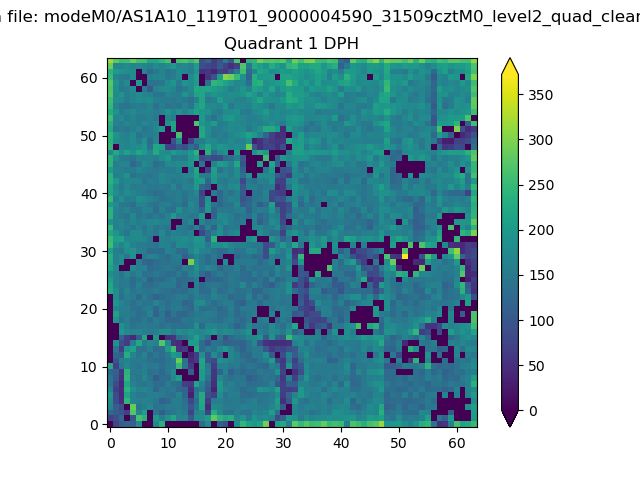 |
Quadrant B |
|---|---|---|---|
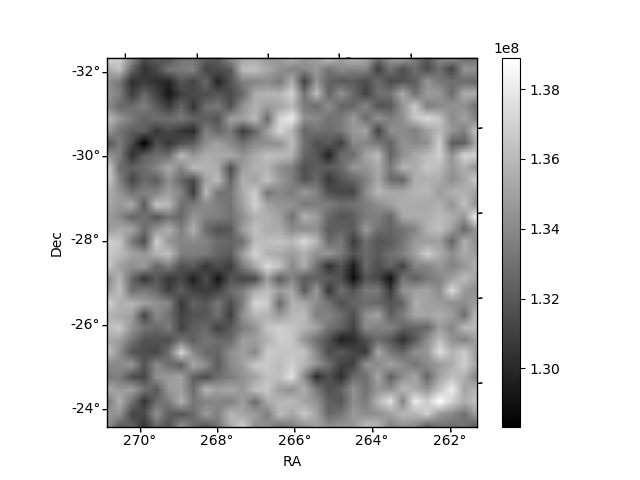
| Quadrant D | 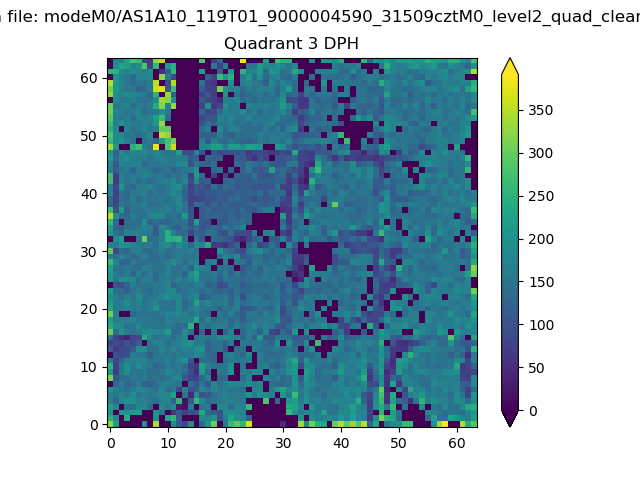 |
 |
Quadrant C |
| Plot type | Count rate plots | Images |
|---|---|---|
| Comparison with Poisson distribution Blue bars denote a histogram of data divided into 1 sec bins. Red curve is a Poisson curve with rate = median count rate of data. |
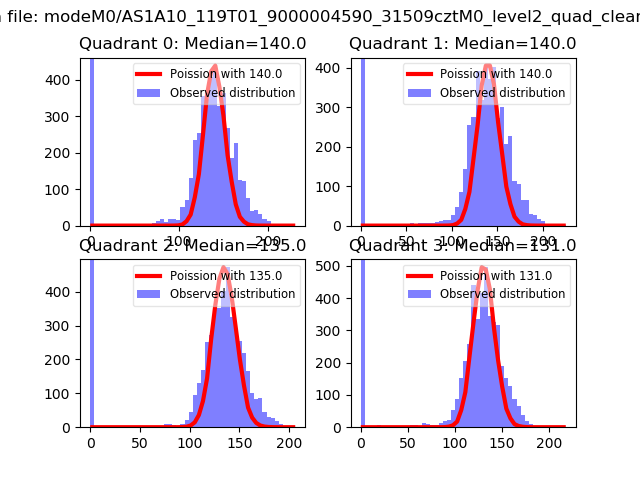 |
 |
| Quadrant-wise count rates Data is divided into 100 sec bins |
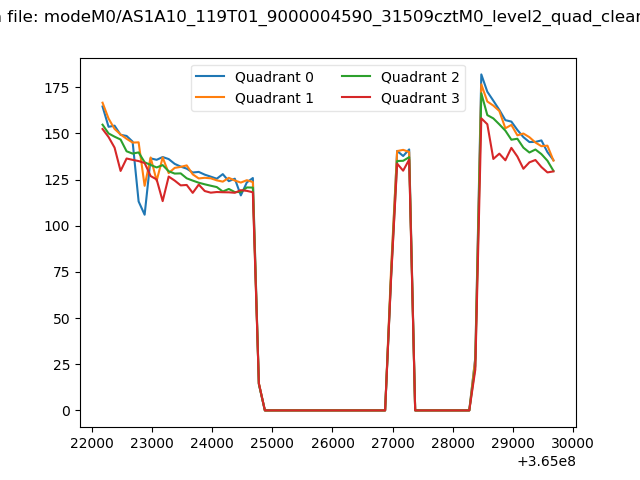 |
|
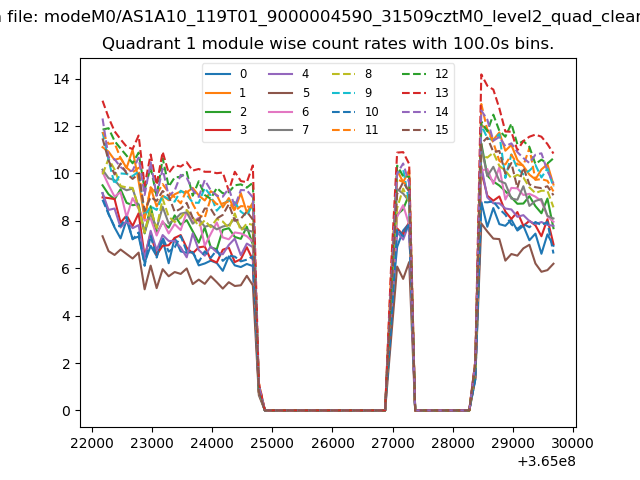
| Module-wise count rates for Quadrant A Data is divided into 100 sec bins |
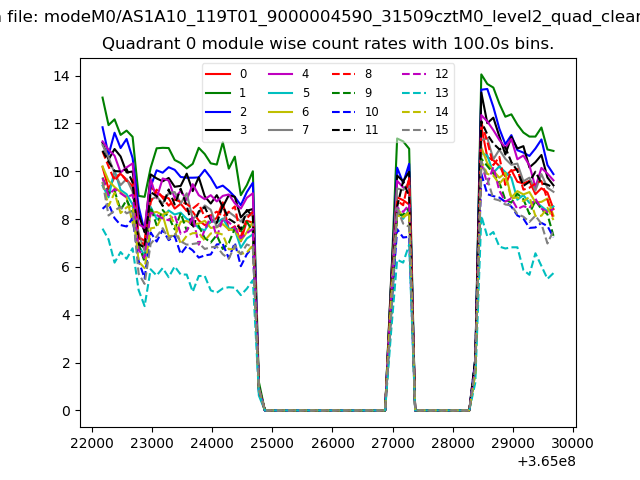 |
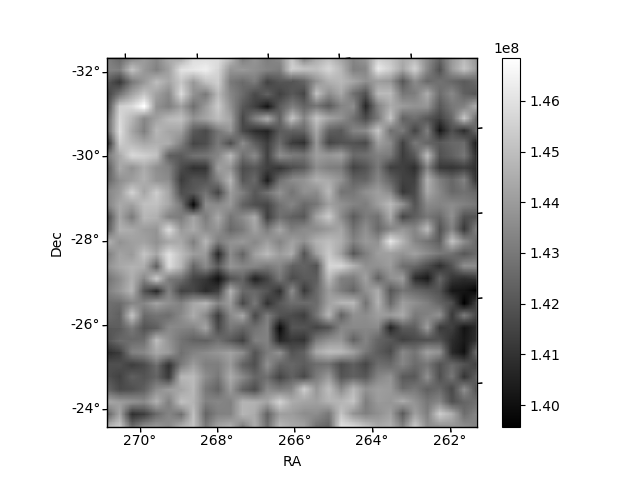 |
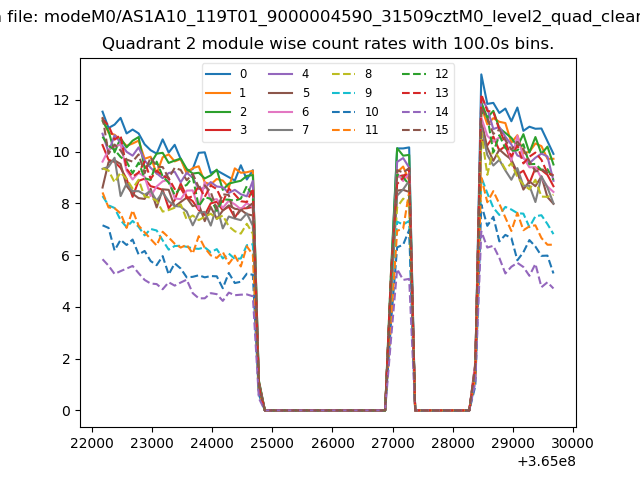
| Module-wise count rates for Quadrant B Data is divided into 100 sec bins |
 |
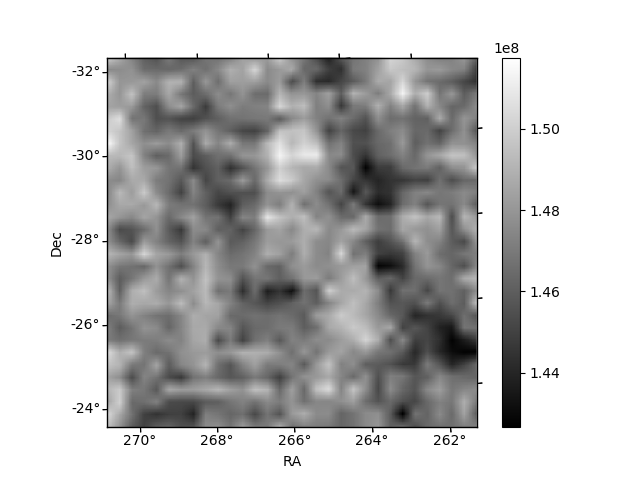 |
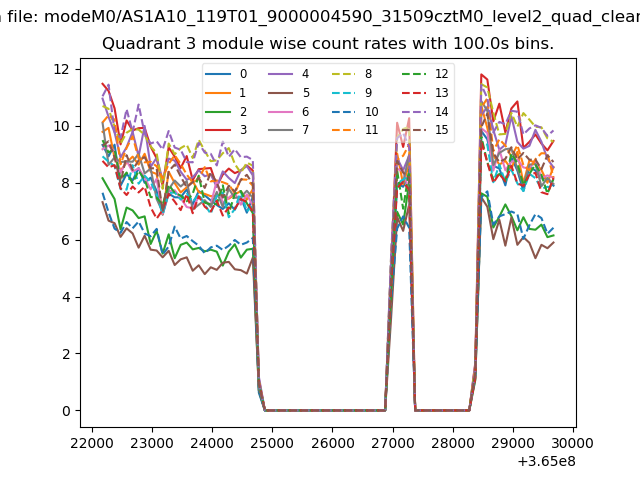
| Module-wise count rates for Quadrant C Data is divided into 100 sec bins |
 |
 |
| Module-wise count rates for Quadrant D Data is divided into 100 sec bins |
 |
 |
| Parameter | Plot |
|---|---|
| CZT HV Monitor | 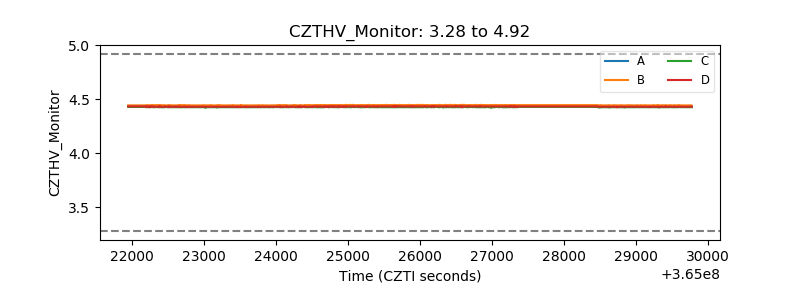 |
| D_VDD |  |
| Temperature 1 | 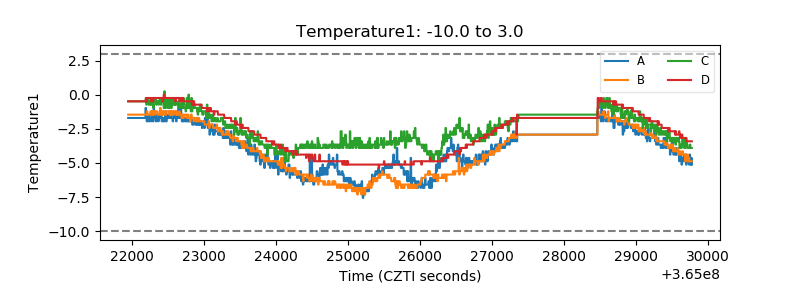 |
| Veto HV Monitor | 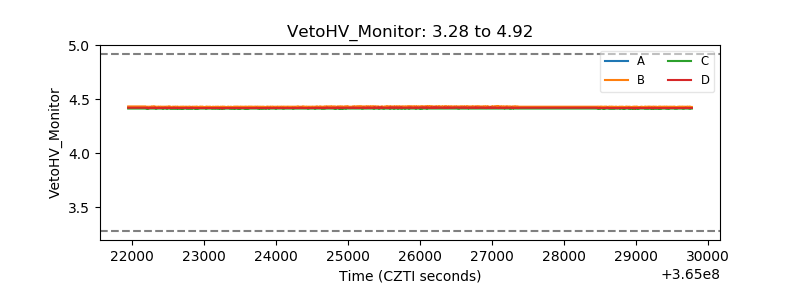 |
| Veto LLD | 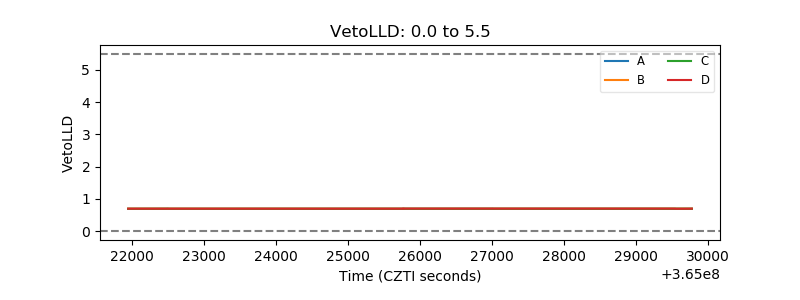 |
| Alpha Counter | 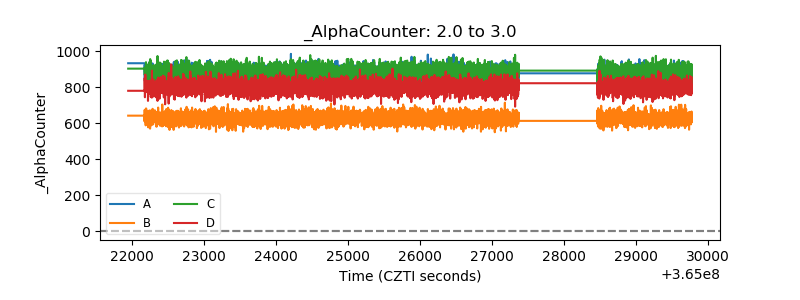 |
| _CPM_Rate | 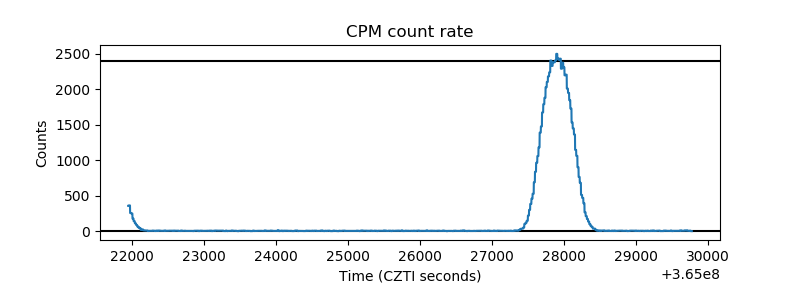 |
| CZT Counter | 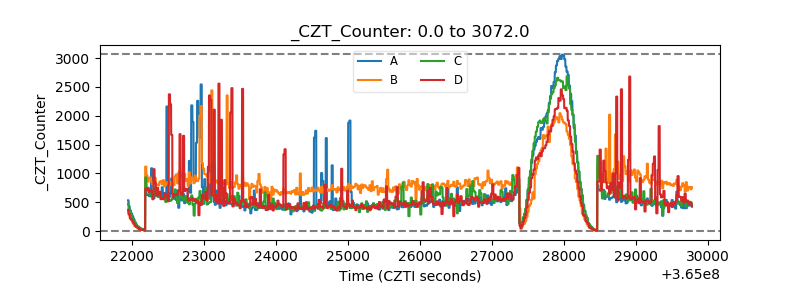 |
| +2.5 Volts monitor | 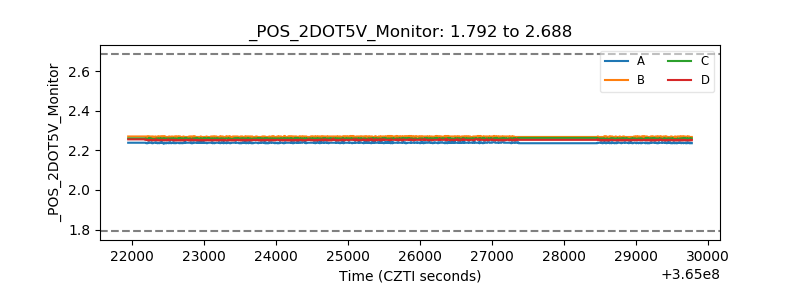 |
| +5 Volts monitor |  |
| _ROLL_ROT | 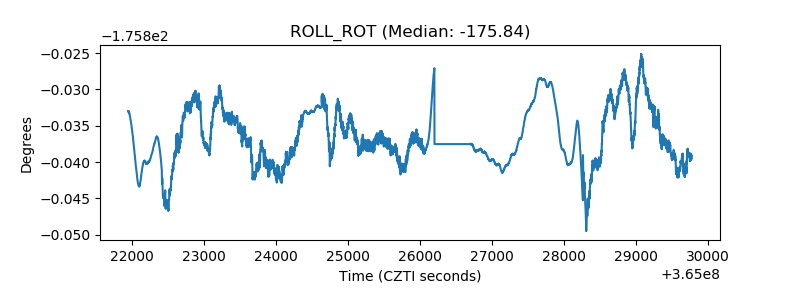 |
| _Roll_DEC | 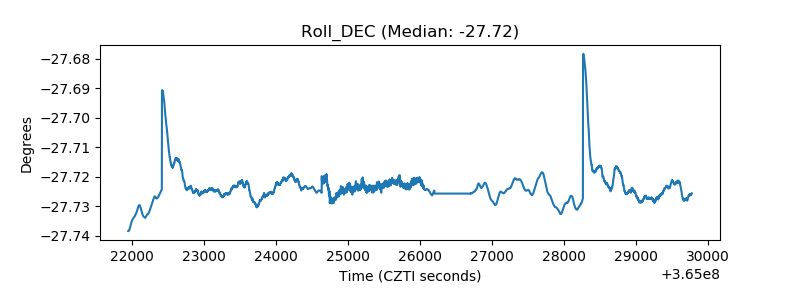 |
| _Roll_RA | 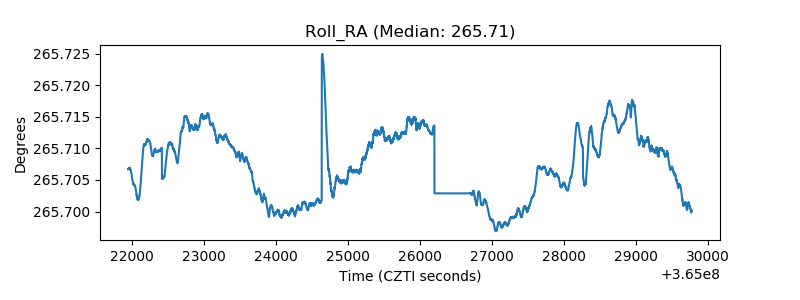 |
| Veto Counter | 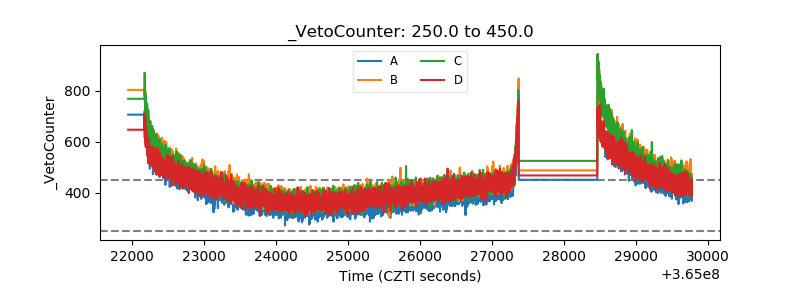 |