| Param | Original file | Final file |
|---|---|---|
| Filename | modeM0/AS1A10_119T01_9000004590_31510cztM0_level2.evt | modeM0/AS1A10_119T01_9000004590_31510cztM0_level2_quad_clean.evt |
| Size (bytes) | 598,452,480 | 92,174,400 |
| Size | 570.7 MB | 87.9 MB |
| Events in quadrant A | 4,657,765 | 592,048 |
| Events in quadrant B | 5,282,717 | 616,723 |
| Events in quadrant C | 3,630,697 | 587,711 |
| Events in quadrant D | 4,128,309 | 556,666 |
| Mode M9 | |||
|---|---|---|---|
| Quadrant | BADHDUFLAG | Total packets | Discarded packets |
| A | 0 | 15 | 0 |
| B | 0 | 16 | 0 |
| C | 0 | 16 | 0 |
| D | 0 | 16 | 0 |
| Mode M0 | |||
|---|---|---|---|
| Quadrant | BADHDUFLAG | Total packets | Discarded packets |
| A | 0 | 17829 | 2 |
| B | 0 | 20035 | 2 |
| C | 0 | 14795 | 2 |
| D | 0 | 16292 | 3 |
| Mode SS | |||
|---|---|---|---|
| Quadrant | BADHDUFLAG | Total packets | Discarded packets |
| A | 0 | 128 | 0 |
| B | 0 | 128 | 0 |
| C | 0 | 128 | 0 |
| D | 0 | 128 | 0 |
| Quadrant | Total seconds | Saturated seconds | Saturation percentage |
|---|---|---|---|
| A | 6276 | 519 | 8.269598% |
| B | 6276 | 120 | 1.912046% |
| C | 6276 | 131 | 2.087317% |
| D | 6275 | 149 | 2.374502% |
Noise dominated data is calculated using 1-second bins in cleaned event files. If a bin has >2000 counts, and if more than 50% of those come from <1% of pixels, then it is considered to be noise-dominated and hence unusable.
| Quadrant | # 1 sec bins | Bins with >0 counts | Bins with >2000 counts | High rate bins dominated by noise | Noise dominated (total time) | Noise dominated (detector-on time) | Marked lightcurve |
|---|---|---|---|---|---|---|---|
| A | 7490 | 6275 | 405 | 405 | 5.41% | 6.45% | 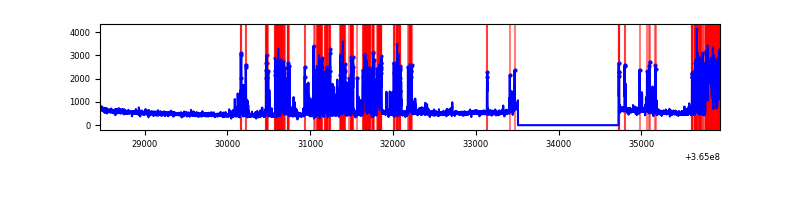 |
| B | 7491 | 6276 | 24 | 24 | 0.32% | 0.38% | 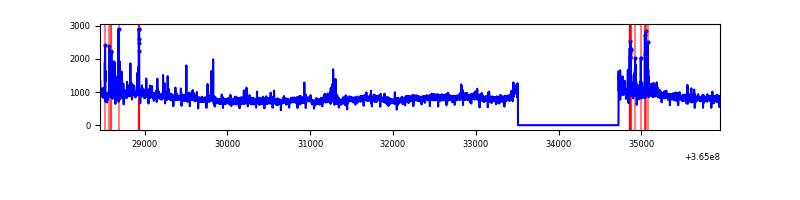 |
| C | 7491 | 6277 | 46 | 46 | 0.61% | 0.73% | 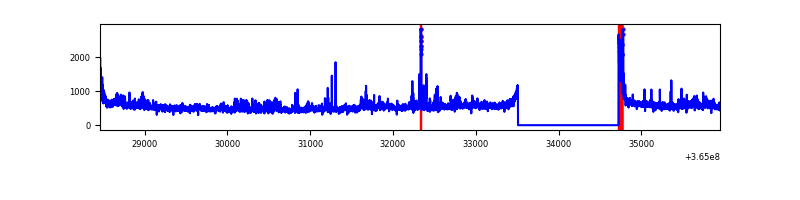 |
| D | 7490 | 6276 | 117 | 117 | 1.56% | 1.86% | 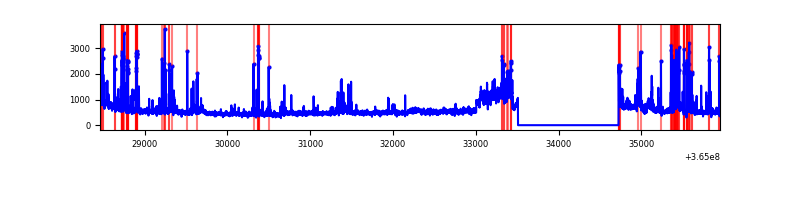 |
Top three noisy pixels from each quadrant. If the there are fewer than three noisy pixels in the level2.evt file, extra rows are filled as -1
| Pixel properties | Quadrant properties | ||||||
|---|---|---|---|---|---|---|---|
| Quadrant | DetID | PixID | Counts | Sigma | Mean | Median | Sigma |
| A | 0 | 13 | 1656186 | 10687.54 | 777 | 763 | 154.9 |
| A | 13 | 254 | 11813 | 71.34 | 777 | 763 | 154.9 |
| A | 3 | 137 | 7679 | 44.65 | 777 | 763 | 154.9 |
| B | 6 | 159 | 1824095 | 12013.5 | 801 | 785 | 151.8 |
| B | 5 | 172 | 146281 | 958.65 | 801 | 785 | 151.8 |
| B | 4 | 80 | 42462 | 274.6 | 801 | 785 | 151.8 |
| C | 3 | 233 | 267816 | 1501.24 | 764 | 769 | 177.9 |
| C | 14 | 238 | 124464 | 695.37 | 764 | 769 | 177.9 |
| C | 0 | 10 | 115808 | 646.71 | 764 | 769 | 177.9 |
| D | 13 | 249 | 366235 | 2004.6 | 759 | 738 | 182.3 |
| D | 8 | 195 | 297919 | 1629.92 | 759 | 738 | 182.3 |
| D | 12 | 79 | 270010 | 1476.85 | 759 | 738 | 182.3 |
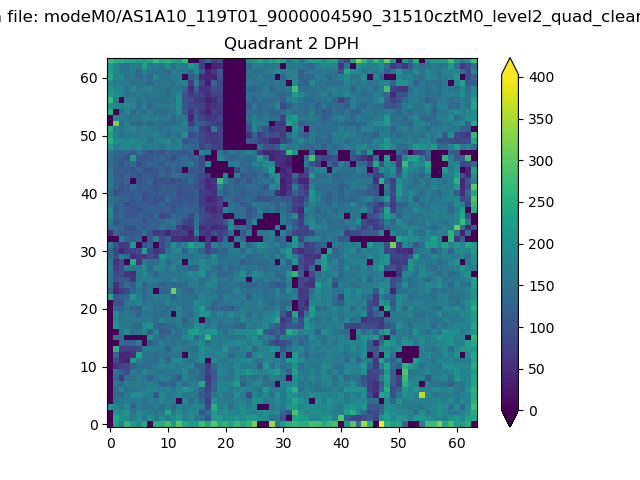
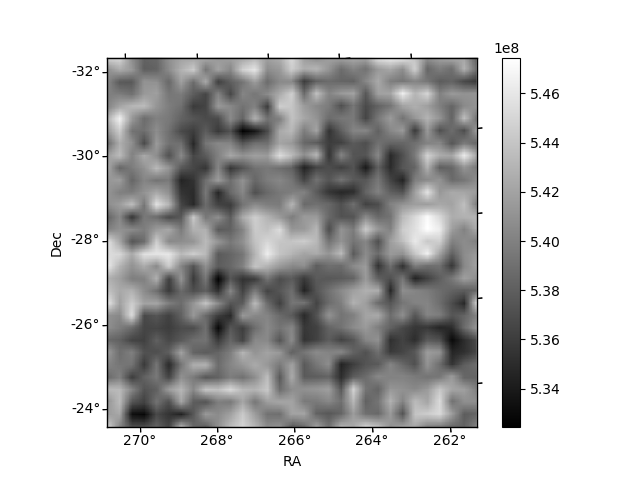
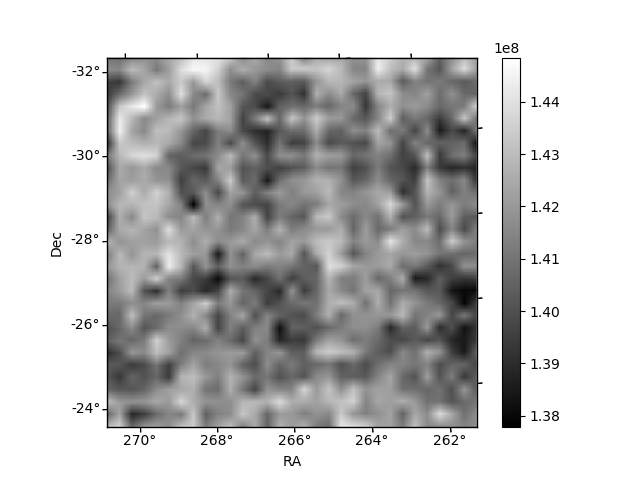
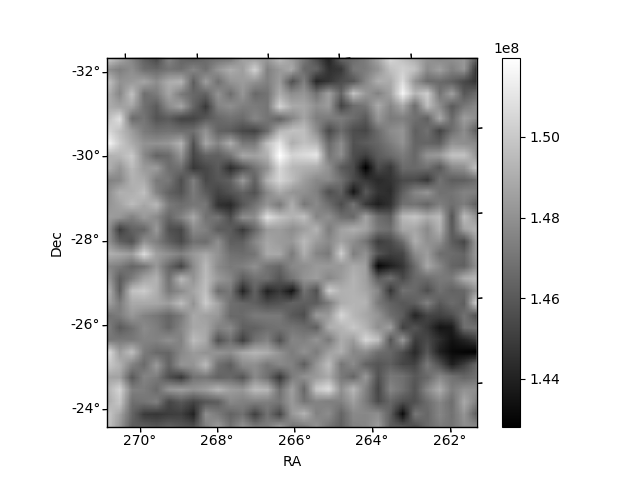
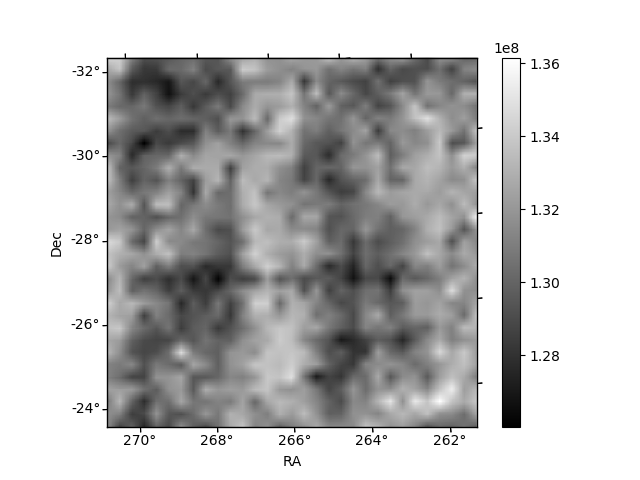
Histogram calculated using DETX and DETY for each event in the final _common_clean file
| Quadrant A | 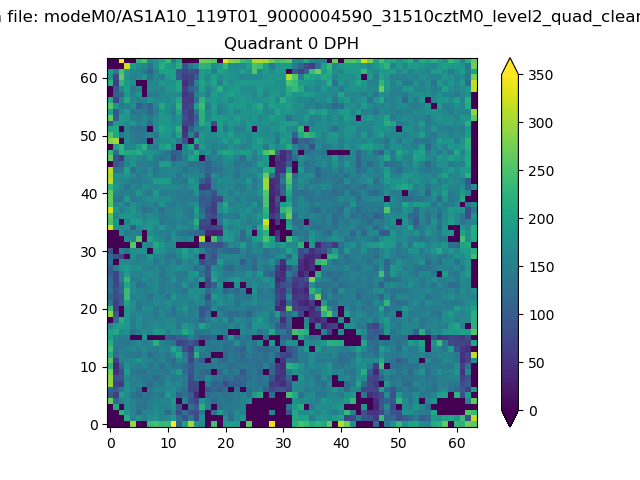 |
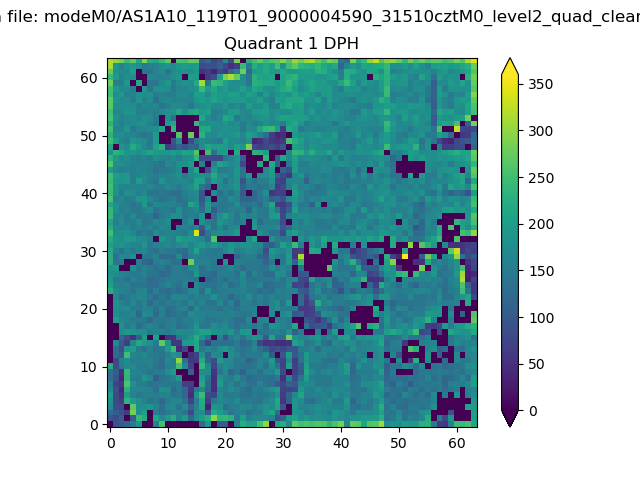 |
Quadrant B |
|---|---|---|---|
| Quadrant D | 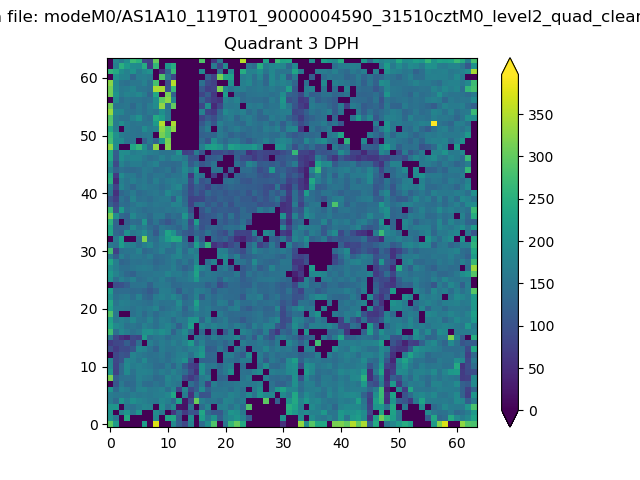 |
 |
Quadrant C |
| Plot type | Count rate plots | Images |
|---|---|---|
| Comparison with Poisson distribution Blue bars denote a histogram of data divided into 1 sec bins. Red curve is a Poisson curve with rate = median count rate of data. |
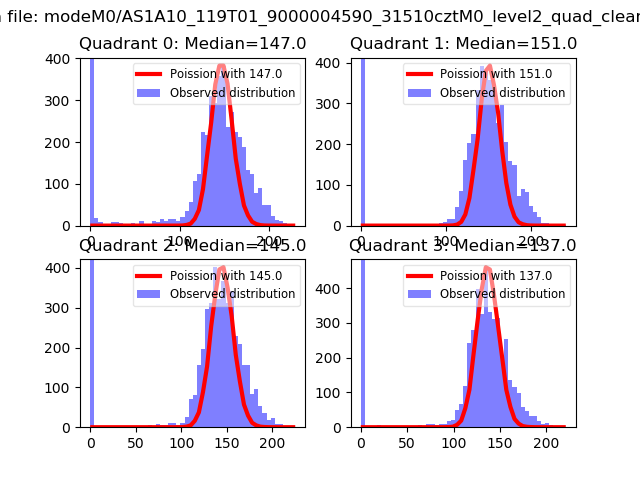 |
 |
| Quadrant-wise count rates Data is divided into 100 sec bins |
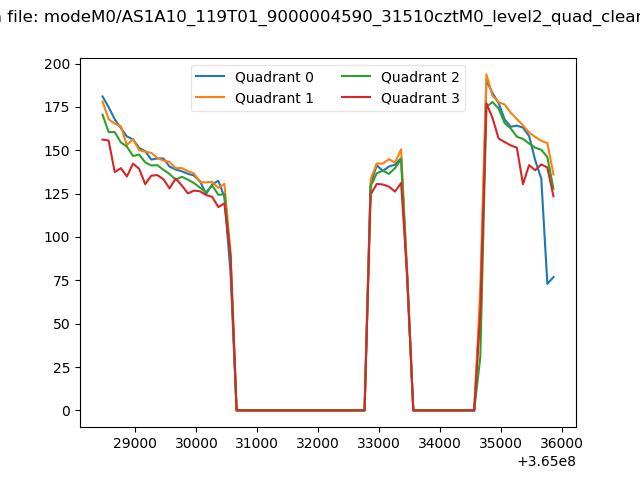 |
|
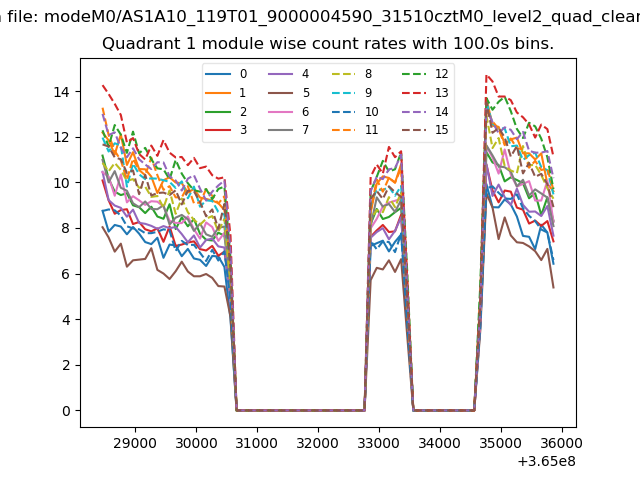
| Module-wise count rates for Quadrant A Data is divided into 100 sec bins |
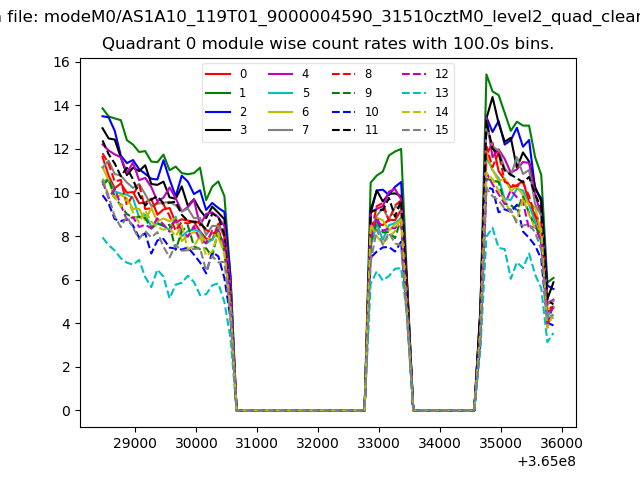 |
 |
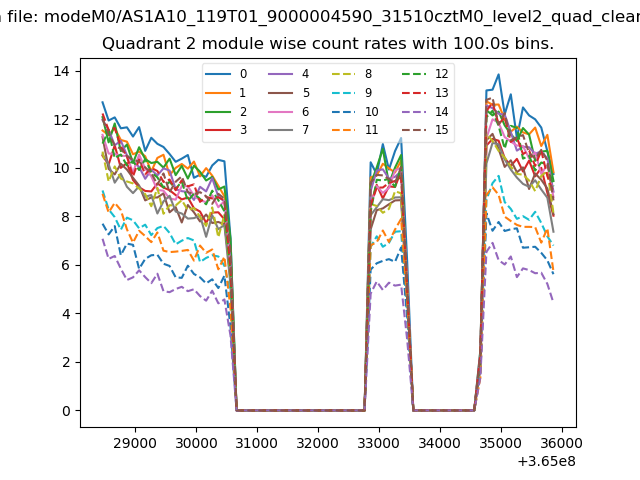
| Module-wise count rates for Quadrant B Data is divided into 100 sec bins |
 |
 |
| Module-wise count rates for Quadrant C Data is divided into 100 sec bins |
 |
 |
| Module-wise count rates for Quadrant D Data is divided into 100 sec bins |
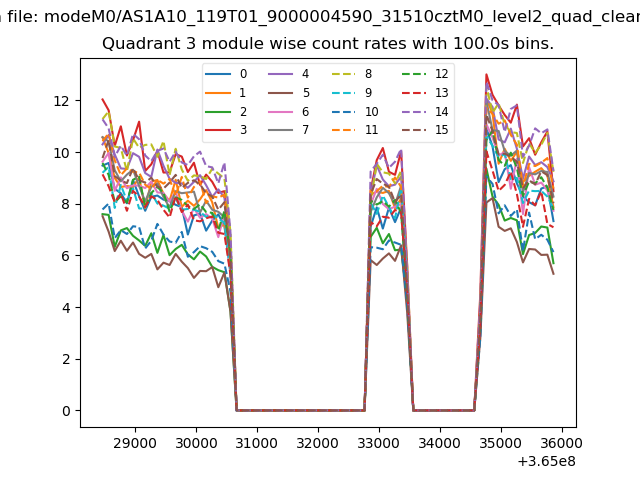 |
 |
| Parameter | Plot |
|---|---|
| CZT HV Monitor | 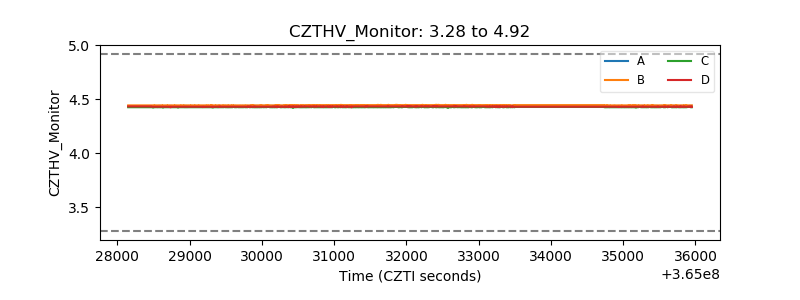 |
| D_VDD | 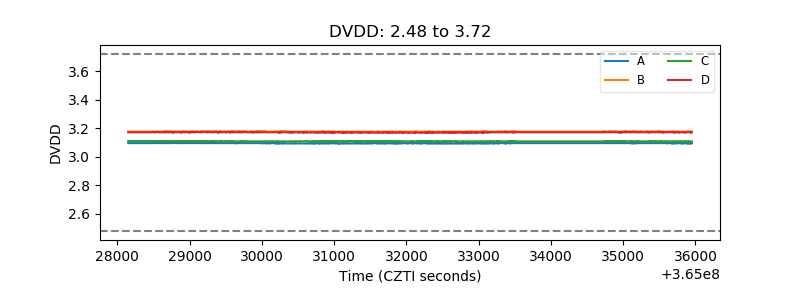 |
| Temperature 1 | 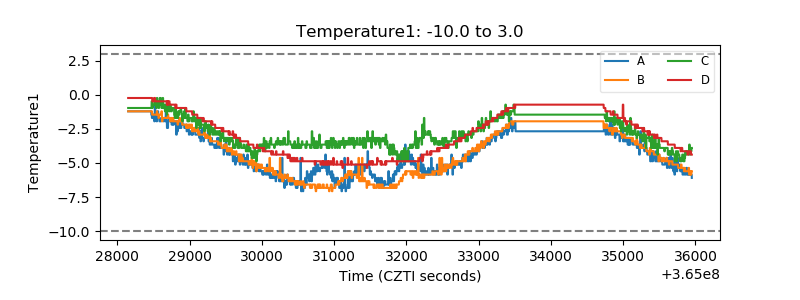 |
| Veto HV Monitor | 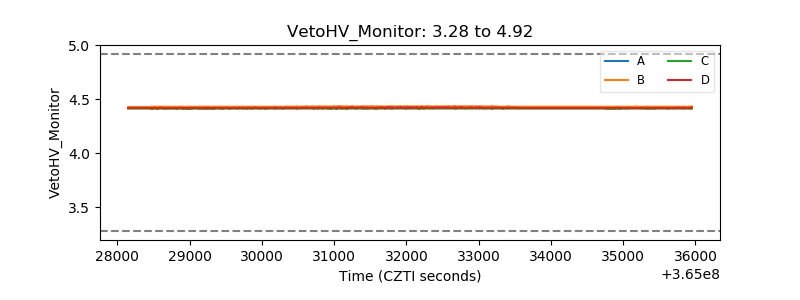 |
| Veto LLD | 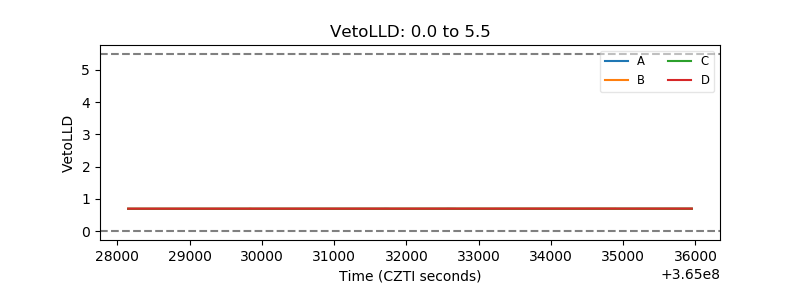 |
| Alpha Counter | 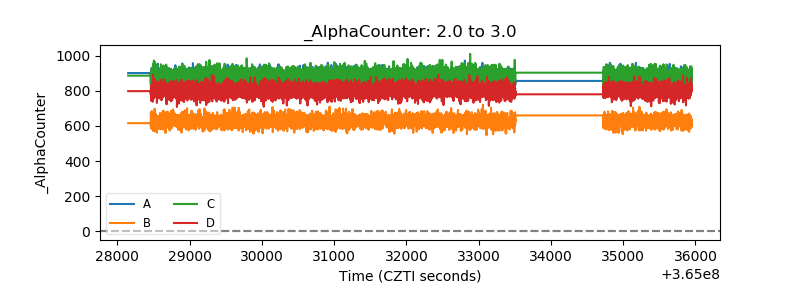 |
| _CPM_Rate | 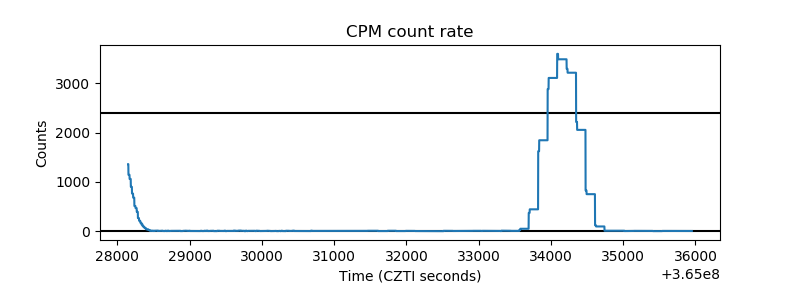 |
| CZT Counter | 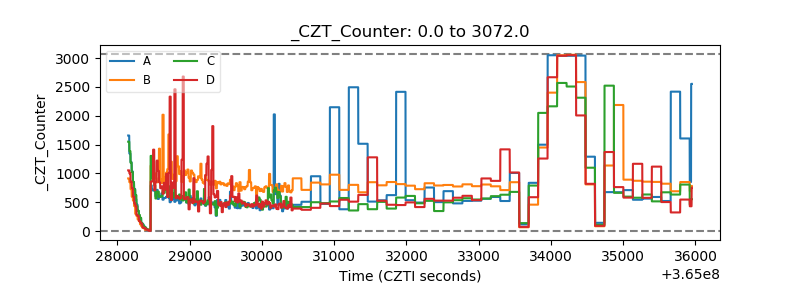 |
| +2.5 Volts monitor |  |
| +5 Volts monitor |  |
| _ROLL_ROT | 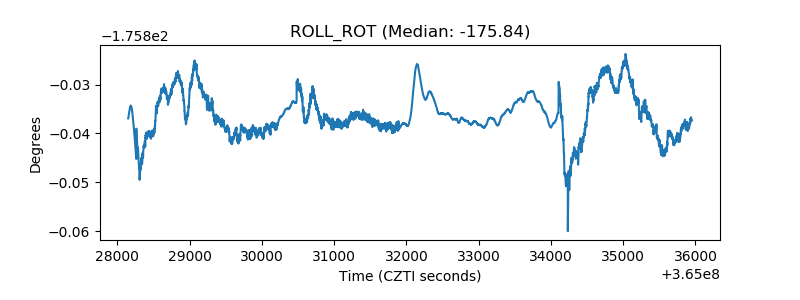 |
| _Roll_DEC | 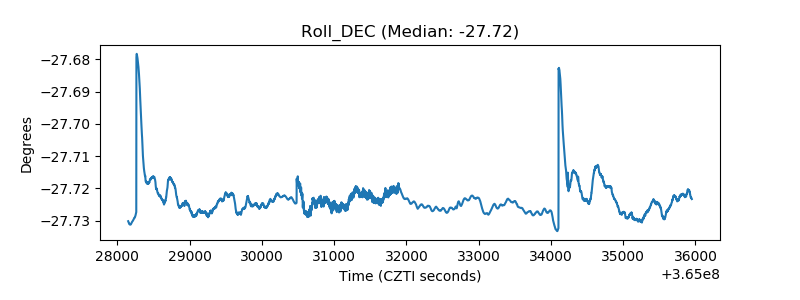 |
| _Roll_RA | 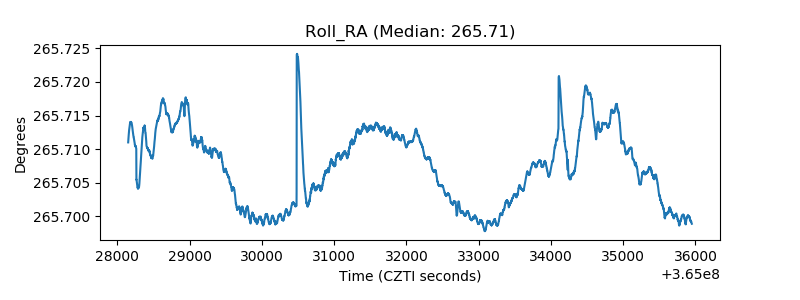 |
| Veto Counter | 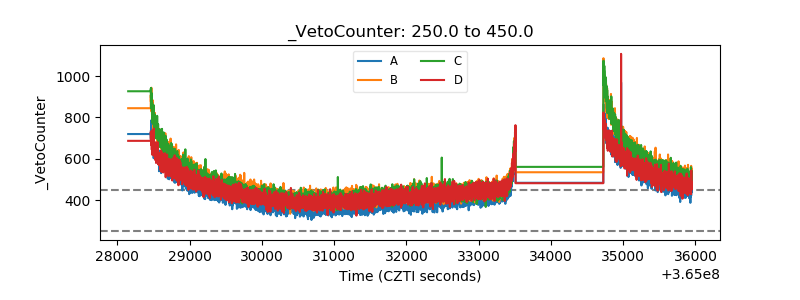 |