| Param | Original file | Final file |
|---|---|---|
| Filename | modeM0/AS1A10_119T01_9000004590_31511cztM0_level2.evt | modeM0/AS1A10_119T01_9000004590_31511cztM0_level2_quad_clean.evt |
| Size (bytes) | 744,243,840 | 89,714,880 |
| Size | 709.8 MB | 85.6 MB |
| Events in quadrant A | 8,105,662 | 456,949 |
| Events in quadrant B | 5,287,676 | 641,455 |
| Events in quadrant C | 3,595,095 | 614,786 |
| Events in quadrant D | 5,130,378 | 567,649 |
| Mode M9 | |||
|---|---|---|---|
| Quadrant | BADHDUFLAG | Total packets | Discarded packets |
| A | 0 | 17 | 0 |
| B | 0 | 18 | 0 |
| C | 0 | 18 | 0 |
| D | 0 | 18 | 0 |
| Mode M0 | |||
|---|---|---|---|
| Quadrant | BADHDUFLAG | Total packets | Discarded packets |
| A | 0 | 28358 | 2 |
| B | 0 | 19860 | 2 |
| C | 0 | 14441 | 2 |
| D | 0 | 19528 | 4 |
| Mode SS | |||
|---|---|---|---|
| Quadrant | BADHDUFLAG | Total packets | Discarded packets |
| A | 0 | 128 | 0 |
| B | 0 | 128 | 0 |
| C | 0 | 128 | 0 |
| D | 0 | 128 | 0 |
| Quadrant | Total seconds | Saturated seconds | Saturation percentage |
|---|---|---|---|
| A | 6225 | 2373 | 38.120482% |
| B | 6225 | 160 | 2.570281% |
| C | 6225 | 144 | 2.313253% |
| D | 6224 | 495 | 7.953085% |
Noise dominated data is calculated using 1-second bins in cleaned event files. If a bin has >2000 counts, and if more than 50% of those come from <1% of pixels, then it is considered to be noise-dominated and hence unusable.
| Quadrant | # 1 sec bins | Bins with >0 counts | Bins with >2000 counts | High rate bins dominated by noise | Noise dominated (total time) | Noise dominated (detector-on time) | Marked lightcurve |
|---|---|---|---|---|---|---|---|
| A | 7534 | 6224 | 1736 | 1736 | 23.04% | 27.89% | 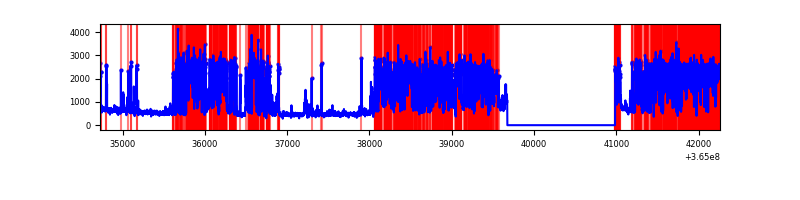 |
| B | 7535 | 6226 | 52 | 52 | 0.69% | 0.84% | 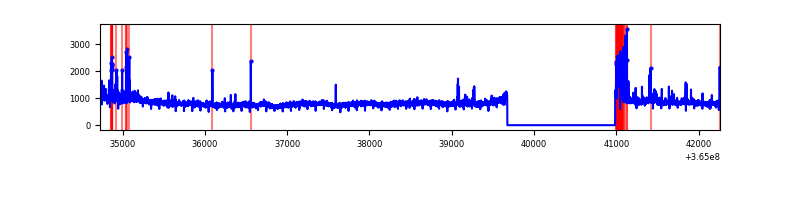 |
| C | 7535 | 6226 | 63 | 63 | 0.84% | 1.01% | 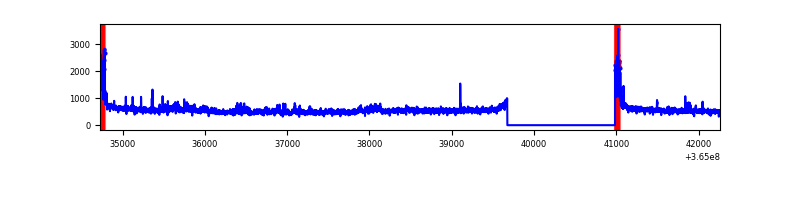 |
| D | 7534 | 6224 | 476 | 476 | 6.32% | 7.65% | 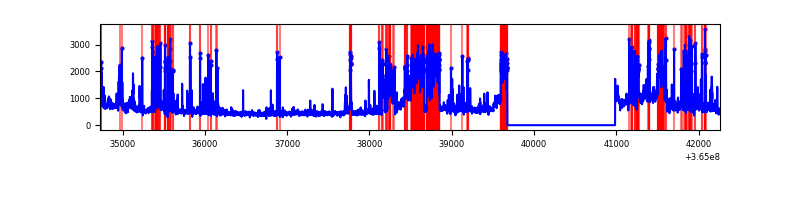 |
Top three noisy pixels from each quadrant. If the there are fewer than three noisy pixels in the level2.evt file, extra rows are filled as -1
| Pixel properties | Quadrant properties | ||||||
|---|---|---|---|---|---|---|---|
| Quadrant | DetID | PixID | Counts | Sigma | Mean | Median | Sigma |
| A | 0 | 13 | 5593661 | 43137.1 | 650 | 638 | 129.7 |
| A | 13 | 254 | 9535 | 68.62 | 650 | 638 | 129.7 |
| A | 3 | 137 | 6187 | 42.8 | 650 | 638 | 129.7 |
| B | 6 | 159 | 1747052 | 11308.69 | 817 | 800 | 154.4 |
| B | 5 | 172 | 176985 | 1140.97 | 817 | 800 | 154.4 |
| B | 4 | 80 | 53961 | 344.27 | 817 | 800 | 154.4 |
| C | 0 | 10 | 196034 | 1068.74 | 783 | 791 | 182.7 |
| C | 3 | 233 | 177065 | 964.9 | 783 | 791 | 182.7 |
| C | 14 | 238 | 128693 | 700.12 | 783 | 791 | 182.7 |
| D | 12 | 79 | 1151809 | 6306.65 | 761 | 741 | 182.5 |
| D | 8 | 195 | 479122 | 2621.03 | 761 | 741 | 182.5 |
| D | 13 | 249 | 289430 | 1581.71 | 761 | 741 | 182.5 |
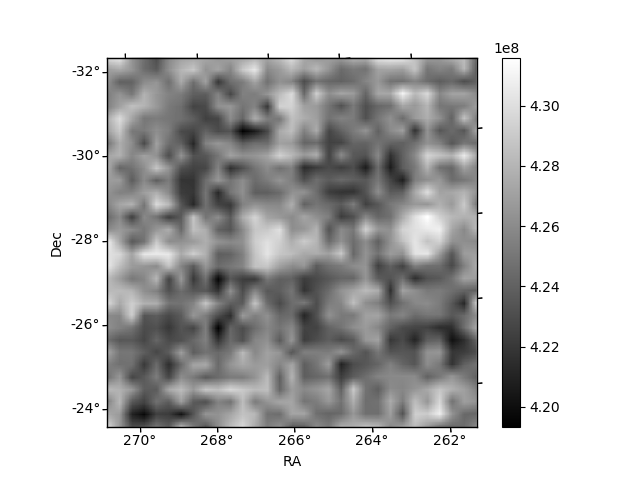
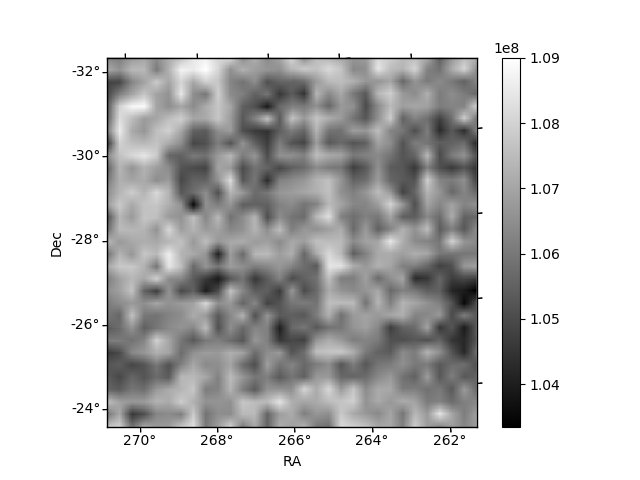
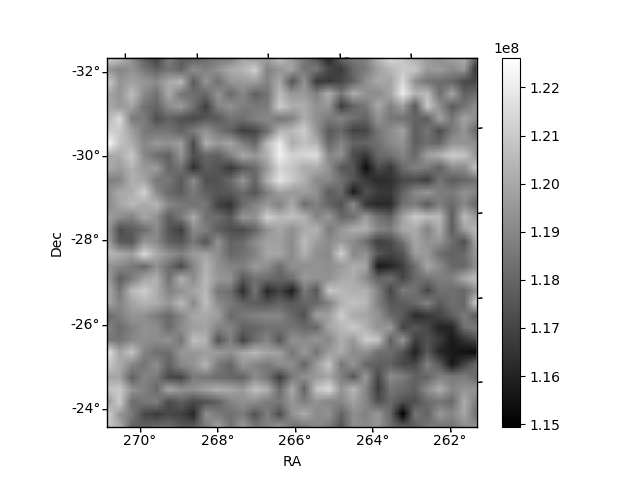
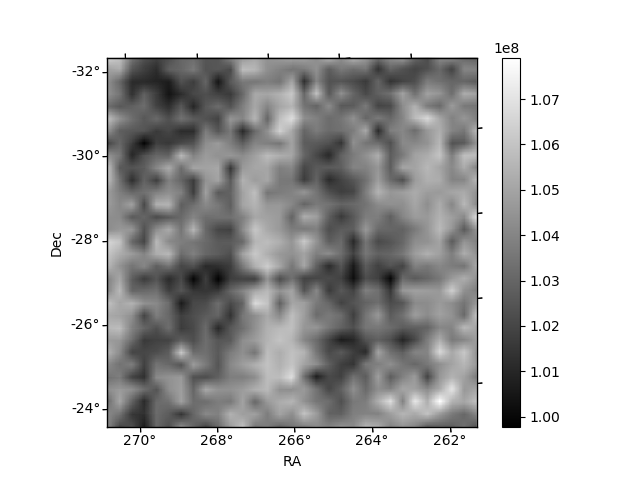
Histogram calculated using DETX and DETY for each event in the final _common_clean file
| Quadrant A | 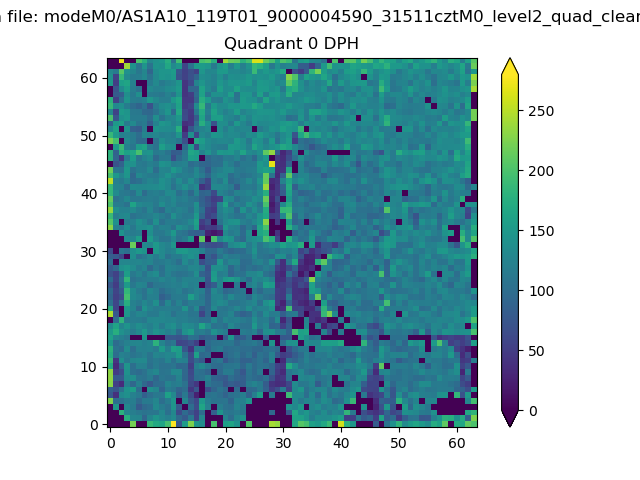 |
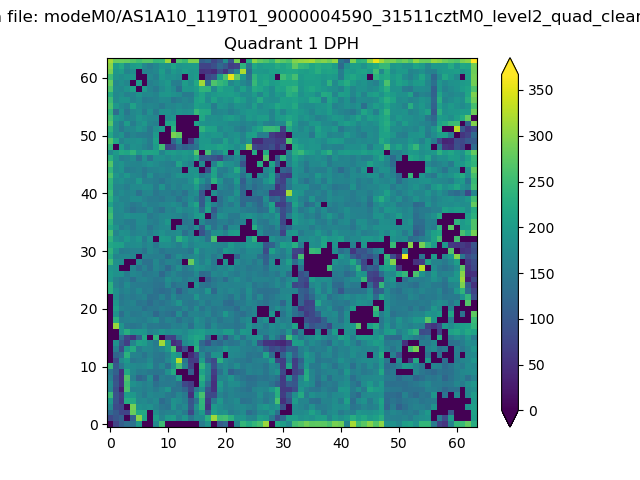 |
Quadrant B |
|---|---|---|---|
| Quadrant D | 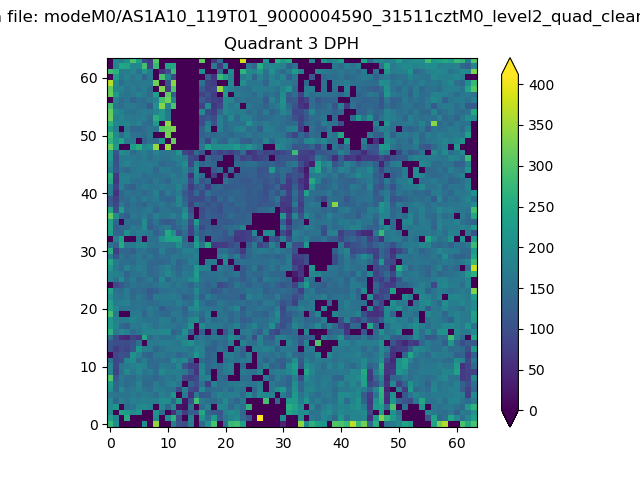 |
 |
Quadrant C |
| Plot type | Count rate plots | Images |
|---|---|---|
| Comparison with Poisson distribution Blue bars denote a histogram of data divided into 1 sec bins. Red curve is a Poisson curve with rate = median count rate of data. |
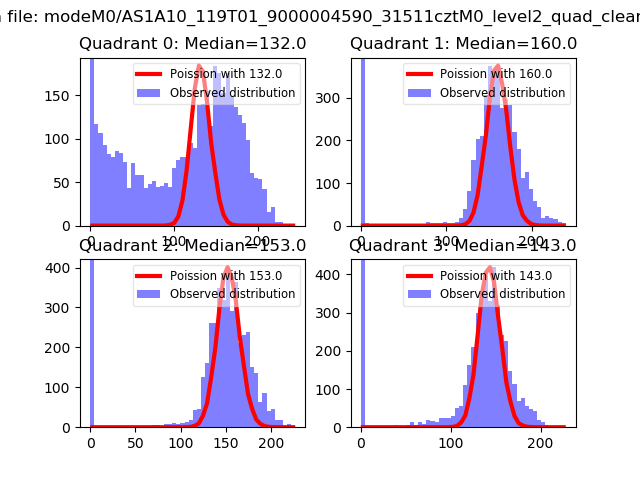 |
 |
| Quadrant-wise count rates Data is divided into 100 sec bins |
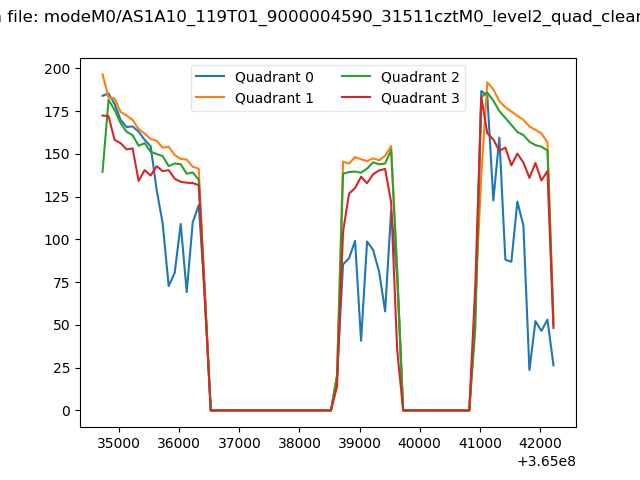 |
|
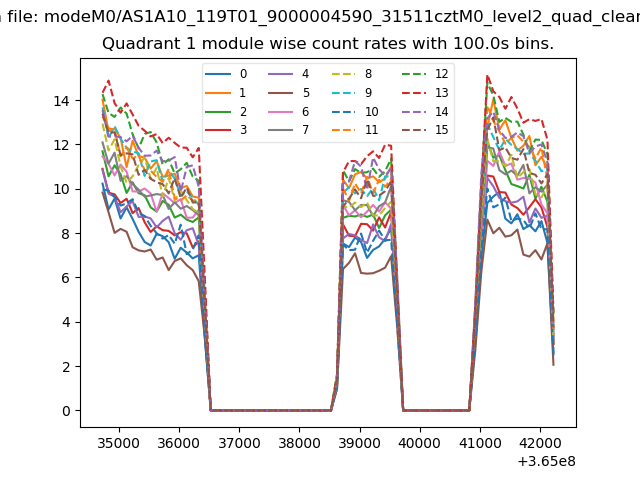
| Module-wise count rates for Quadrant A Data is divided into 100 sec bins |
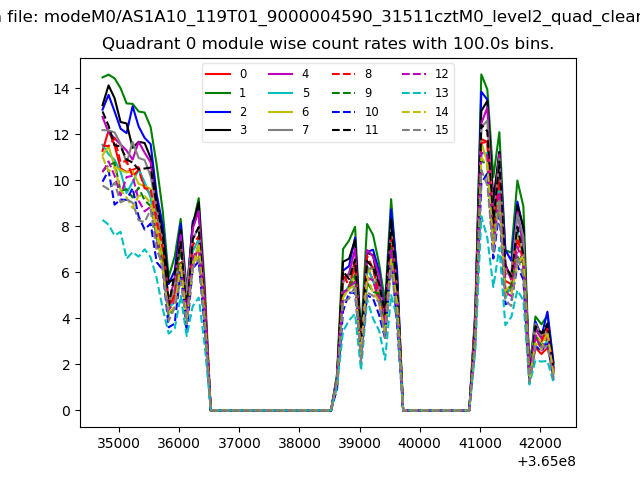 |
 |
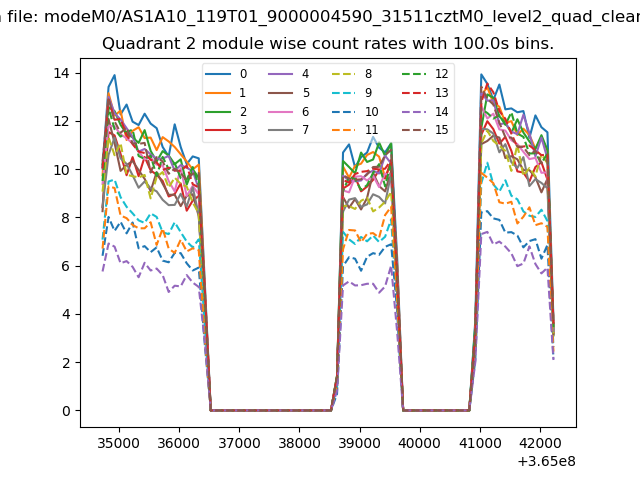
| Module-wise count rates for Quadrant B Data is divided into 100 sec bins |
 |
 |
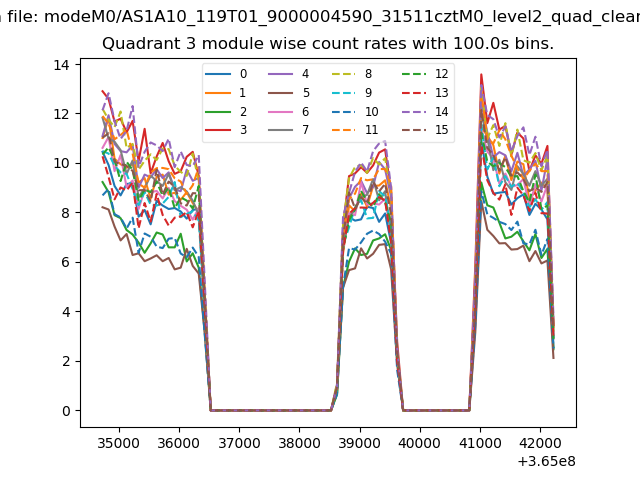
| Module-wise count rates for Quadrant C Data is divided into 100 sec bins |
 |
 |
| Module-wise count rates for Quadrant D Data is divided into 100 sec bins |
 |
 |
| Parameter | Plot |
|---|---|
| CZT HV Monitor | 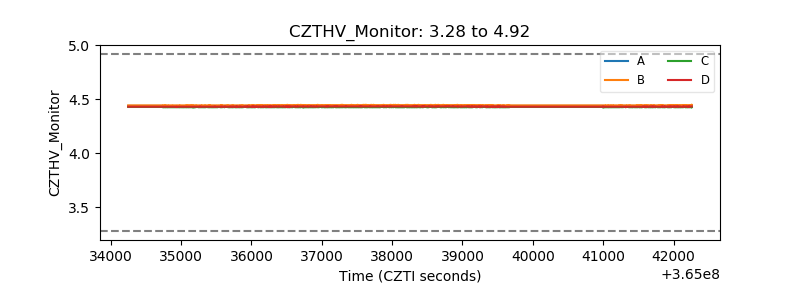 |
| D_VDD |  |
| Temperature 1 | 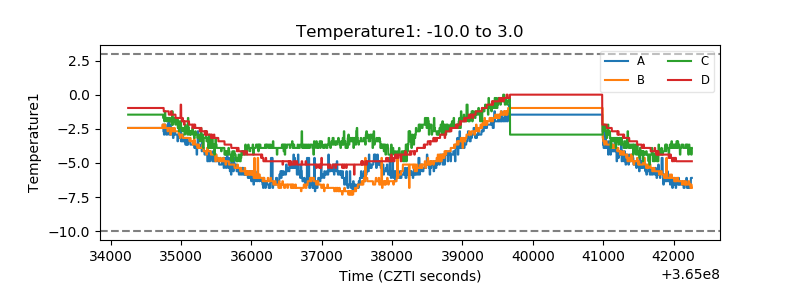 |
| Veto HV Monitor | 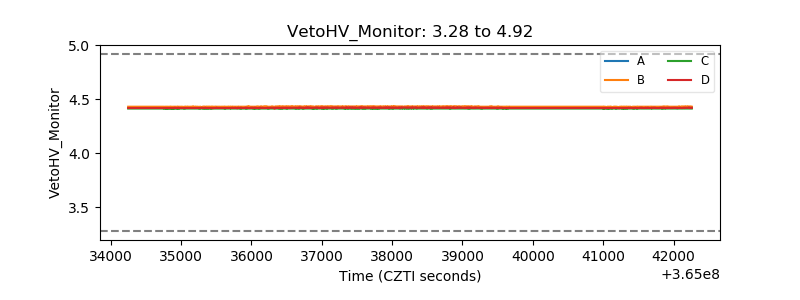 |
| Veto LLD | 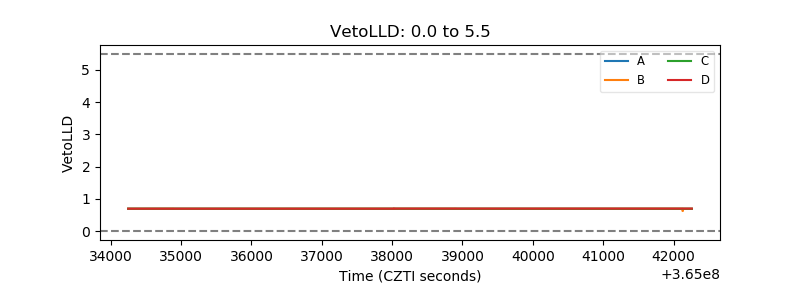 |
| Alpha Counter | 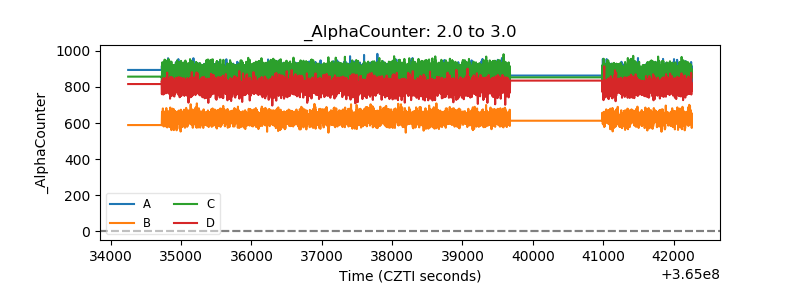 |
| _CPM_Rate | 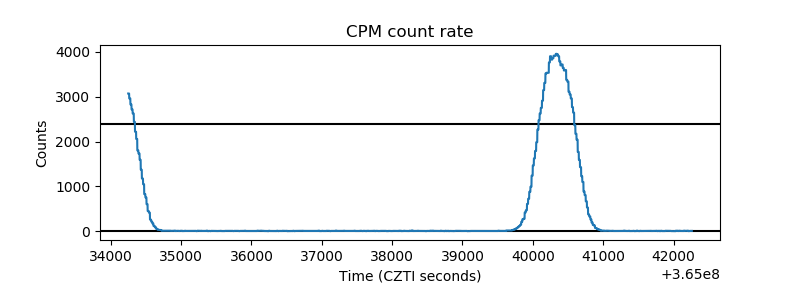 |
| CZT Counter |  |
| +2.5 Volts monitor |  |
| +5 Volts monitor |  |
| _ROLL_ROT | 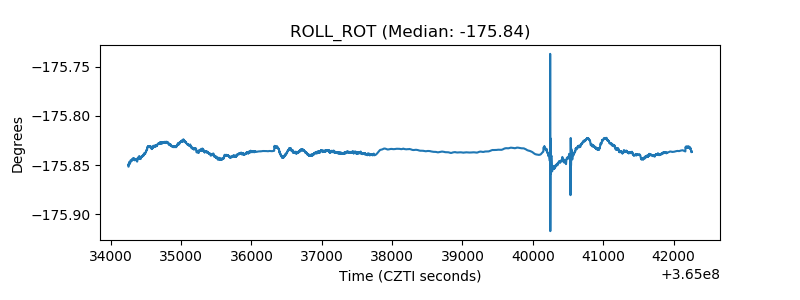 |
| _Roll_DEC | 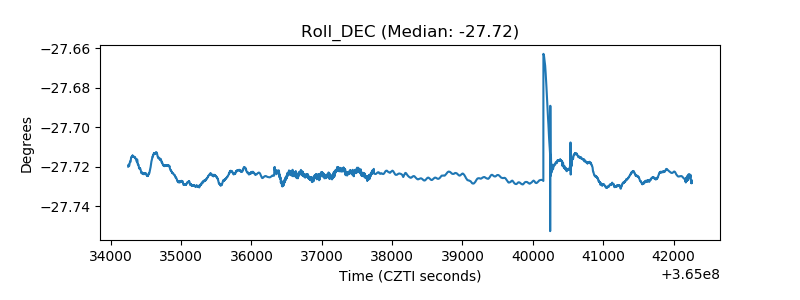 |
| _Roll_RA | 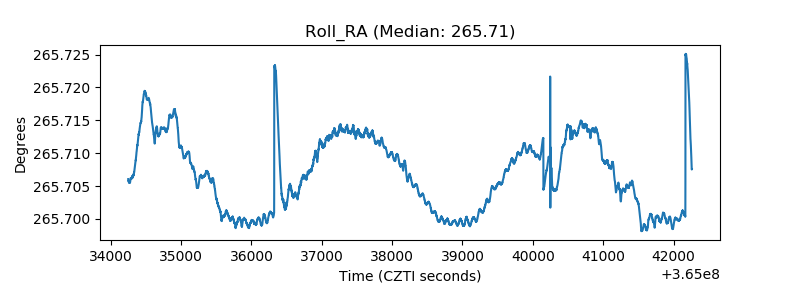 |
| Veto Counter | 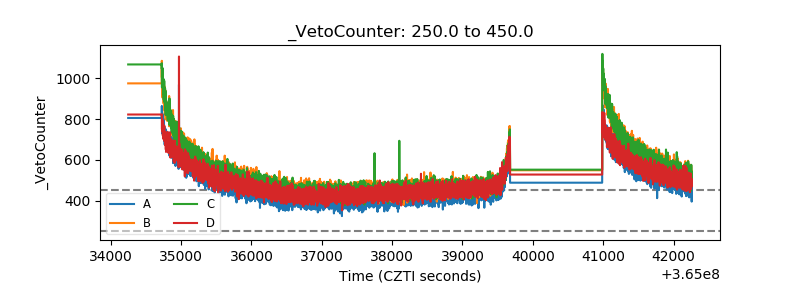 |