| Param | Original file | Final file |
|---|---|---|
| Filename | modeM0/AS1A10_119T01_9000004590_31512cztM0_level2.evt | modeM0/AS1A10_119T01_9000004590_31512cztM0_level2_quad_clean.evt |
| Size (bytes) | 753,753,600 | 85,538,880 |
| Size | 718.8 MB | 81.6 MB |
| Events in quadrant A | 8,885,201 | 478,739 |
| Events in quadrant B | 5,266,427 | 588,916 |
| Events in quadrant C | 3,435,717 | 566,028 |
| Events in quadrant D | 4,825,317 | 527,282 |
| Mode M9 | |||
|---|---|---|---|
| Quadrant | BADHDUFLAG | Total packets | Discarded packets |
| A | 0 | 13 | 0 |
| B | 0 | 13 | 0 |
| C | 0 | 13 | 0 |
| D | 0 | 13 | 0 |
| Mode M0 | |||
|---|---|---|---|
| Quadrant | BADHDUFLAG | Total packets | Discarded packets |
| A | 0 | 30404 | 2 |
| B | 0 | 19502 | 2 |
| C | 0 | 13671 | 2 |
| D | 0 | 18509 | 2 |
| Mode SS | |||
|---|---|---|---|
| Quadrant | BADHDUFLAG | Total packets | Discarded packets |
| A | 0 | 126 | 0 |
| B | 0 | 126 | 0 |
| C | 0 | 126 | 0 |
| D | 0 | 126 | 0 |
| Quadrant | Total seconds | Saturated seconds | Saturation percentage |
|---|---|---|---|
| A | 6138 | 2917 | 47.523623% |
| B | 6139 | 153 | 2.492263% |
| C | 6139 | 119 | 1.938426% |
| D | 6139 | 172 | 2.801759% |
Noise dominated data is calculated using 1-second bins in cleaned event files. If a bin has >2000 counts, and if more than 50% of those come from <1% of pixels, then it is considered to be noise-dominated and hence unusable.
| Quadrant | # 1 sec bins | Bins with >0 counts | Bins with >2000 counts | High rate bins dominated by noise | Noise dominated (total time) | Noise dominated (detector-on time) | Marked lightcurve |
|---|---|---|---|---|---|---|---|
| A | 7493 | 6139 | 2208 | 2208 | 29.47% | 35.97% |  |
| B | 7494 | 6140 | 41 | 41 | 0.55% | 0.67% |  |
| C | 7494 | 6140 | 50 | 50 | 0.67% | 0.81% | 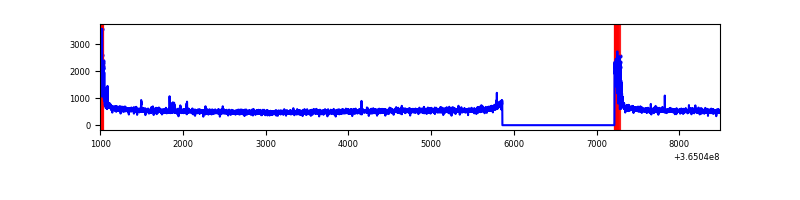 |
| D | 7494 | 6140 | 199 | 199 | 2.66% | 3.24% | 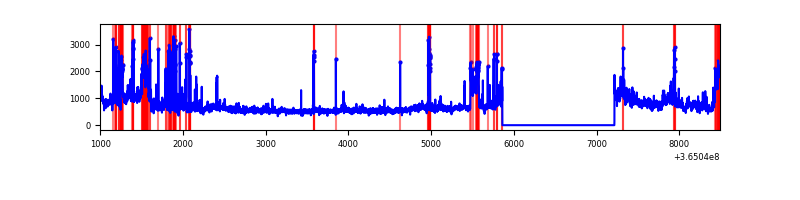 |
Top three noisy pixels from each quadrant. If the there are fewer than three noisy pixels in the level2.evt file, extra rows are filled as -1
| Pixel properties | Quadrant properties | ||||||
|---|---|---|---|---|---|---|---|
| Quadrant | DetID | PixID | Counts | Sigma | Mean | Median | Sigma |
| A | 0 | 13 | 6470949 | 52396.47 | 626 | 619 | 123.5 |
| A | 13 | 254 | 8564 | 64.34 | 626 | 619 | 123.5 |
| A | 3 | 137 | 5858 | 42.43 | 626 | 619 | 123.5 |
| B | 6 | 159 | 1707607 | 11078.31 | 822 | 803 | 154.1 |
| B | 5 | 172 | 142065 | 916.89 | 822 | 803 | 154.1 |
| B | 4 | 80 | 59495 | 380.95 | 822 | 803 | 154.1 |
| C | 0 | 10 | 192037 | 1037.33 | 790 | 800 | 184.4 |
| C | 14 | 238 | 129360 | 697.35 | 790 | 800 | 184.4 |
| C | 2 | 114 | 13931 | 71.23 | 790 | 800 | 184.4 |
| D | 8 | 195 | 1099420 | 5870.82 | 781 | 761 | 187.1 |
| D | 12 | 79 | 384371 | 2049.87 | 781 | 761 | 187.1 |
| D | 2 | 250 | 149496 | 794.78 | 781 | 761 | 187.1 |
Histogram calculated using DETX and DETY for each event in the final _common_clean file
| Quadrant A | 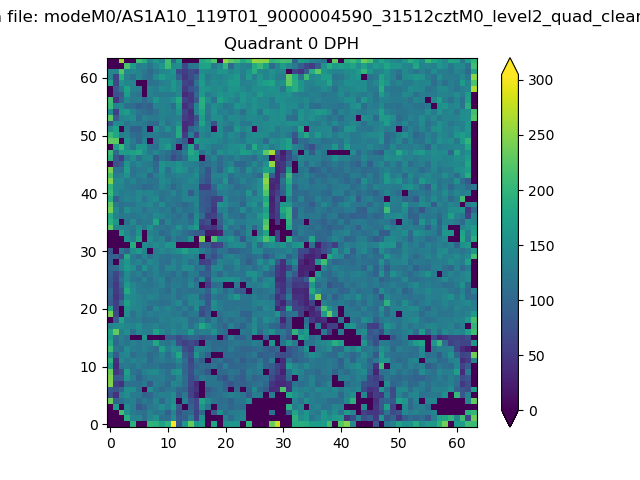 |
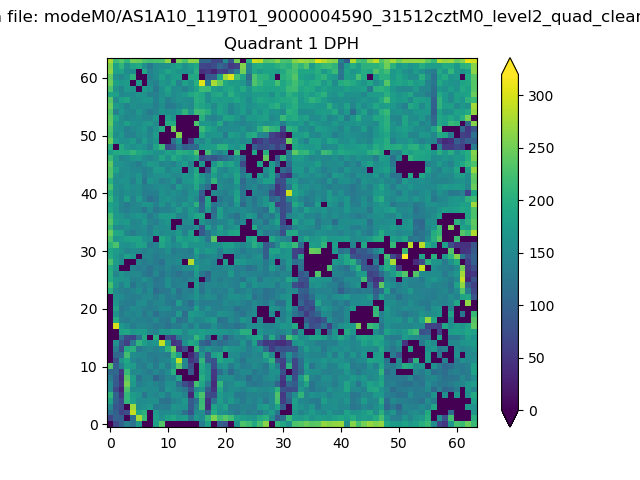 |
Quadrant B |
|---|---|---|---|
| Quadrant D | 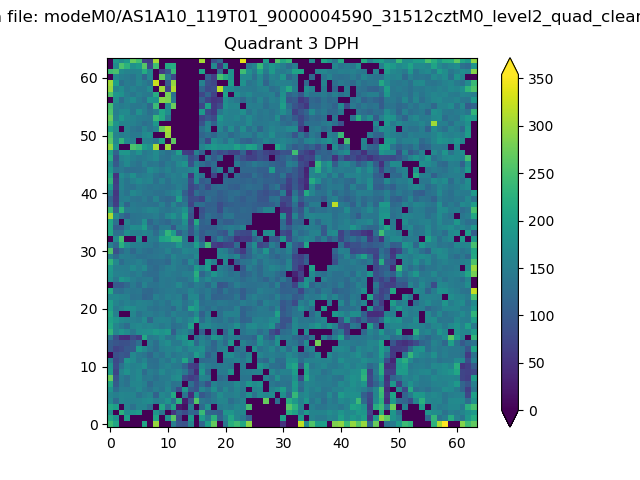 |
 |
Quadrant C |
| Plot type | Count rate plots | Images |
|---|---|---|
| Comparison with Poisson distribution Blue bars denote a histogram of data divided into 1 sec bins. Red curve is a Poisson curve with rate = median count rate of data. |
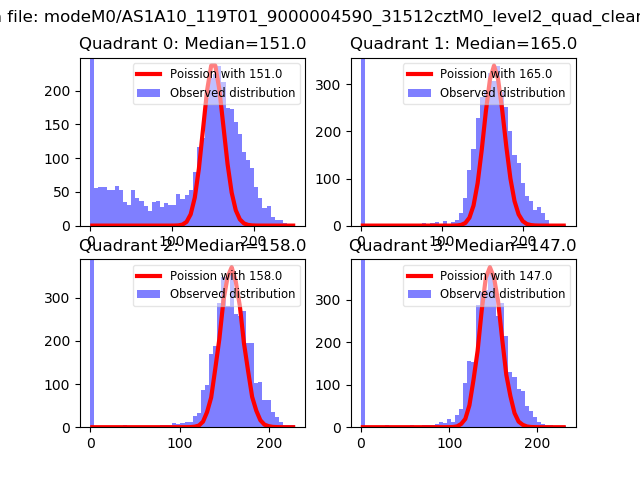 |
 |
| Quadrant-wise count rates Data is divided into 100 sec bins |
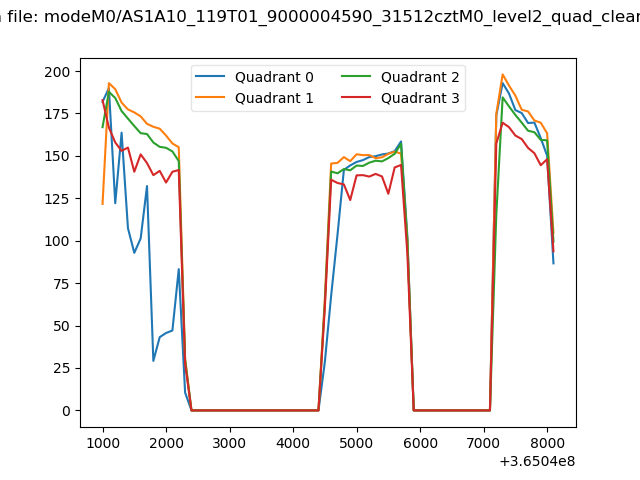 |
|
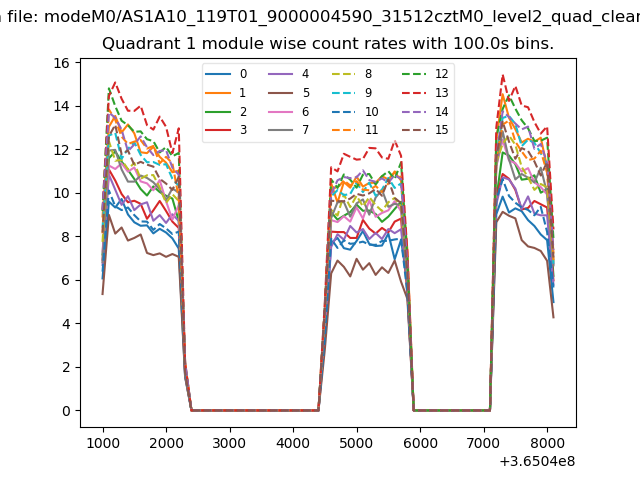
| Module-wise count rates for Quadrant A Data is divided into 100 sec bins |
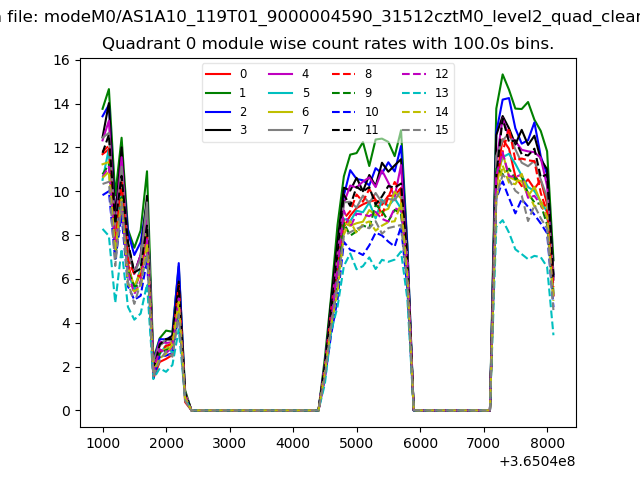 |
 |
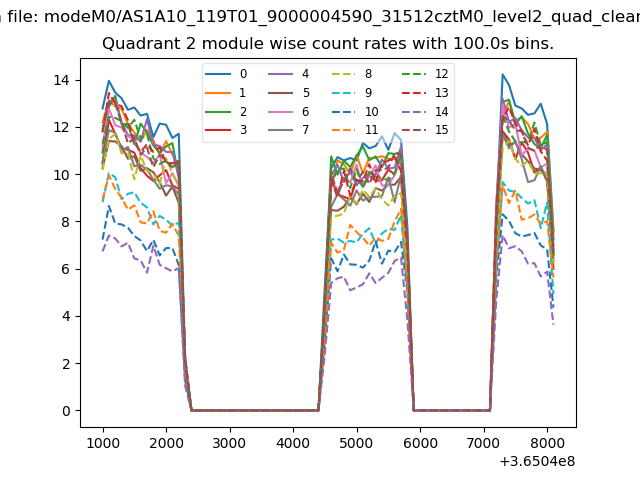
| Module-wise count rates for Quadrant B Data is divided into 100 sec bins |
 |
 |
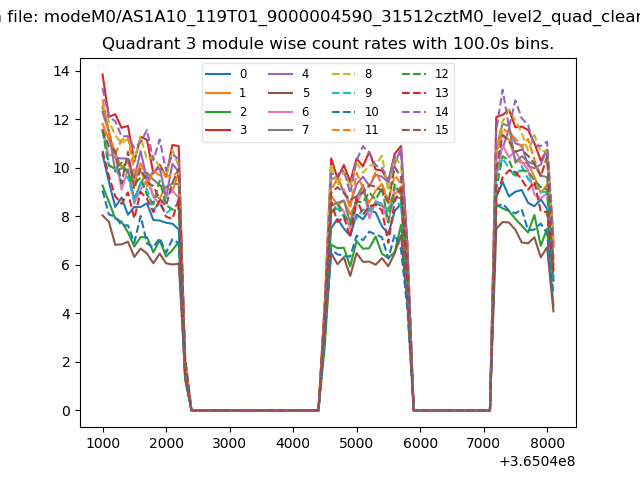
| Module-wise count rates for Quadrant C Data is divided into 100 sec bins |
 |
 |
| Module-wise count rates for Quadrant D Data is divided into 100 sec bins |
 |
 |
| Parameter | Plot |
|---|---|
| CZT HV Monitor | 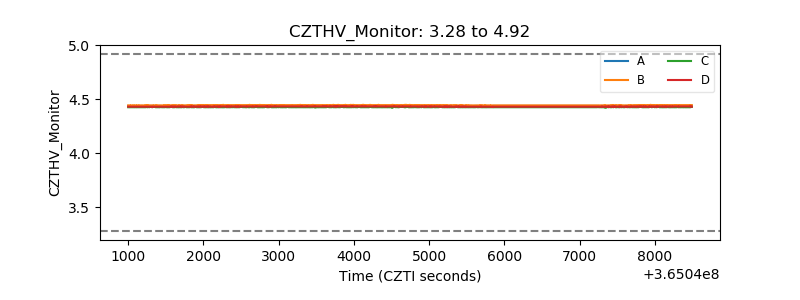 |
| D_VDD | 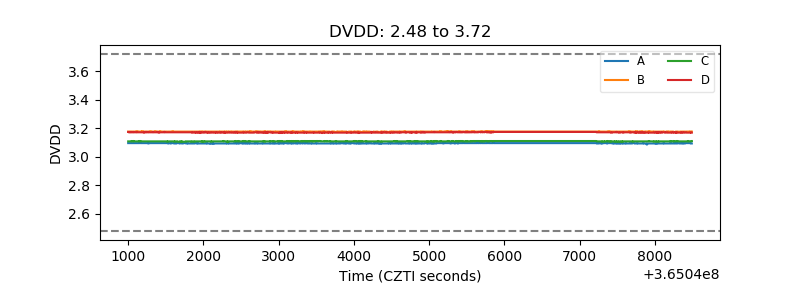 |
| Temperature 1 | 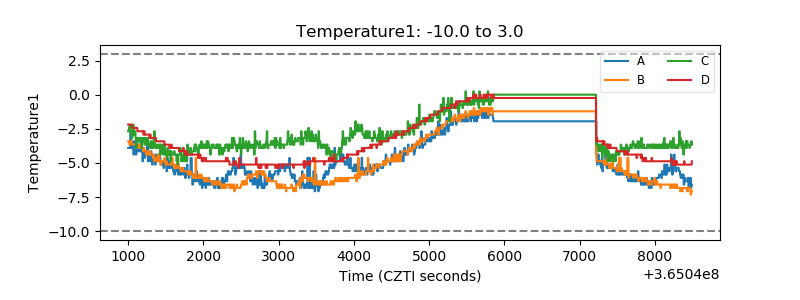 |
| Veto HV Monitor | 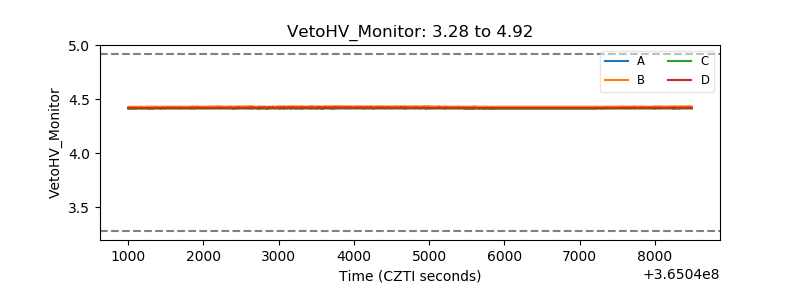 |
| Veto LLD | 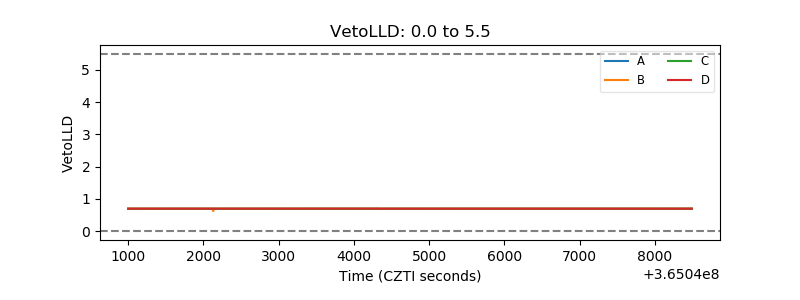 |
| Alpha Counter | 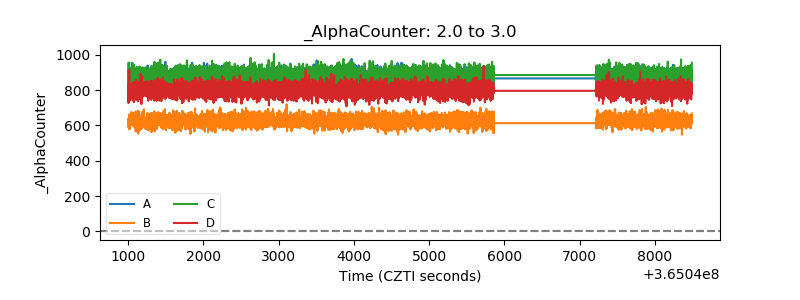 |
| _CPM_Rate | 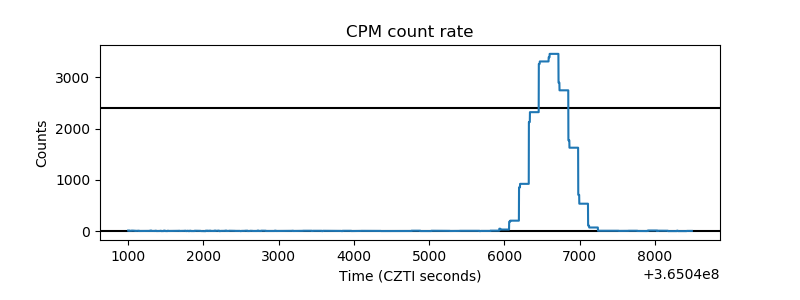 |
| CZT Counter | 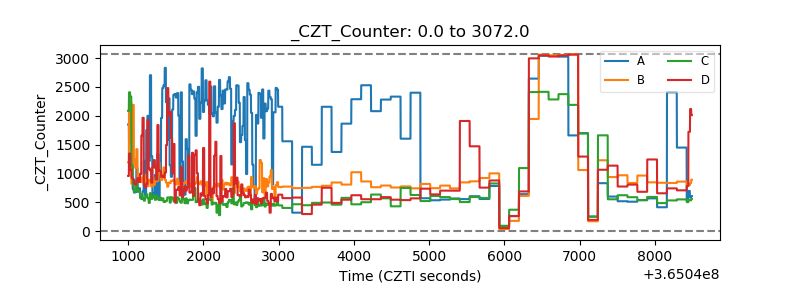 |
| +2.5 Volts monitor |  |
| +5 Volts monitor |  |
| _ROLL_ROT | 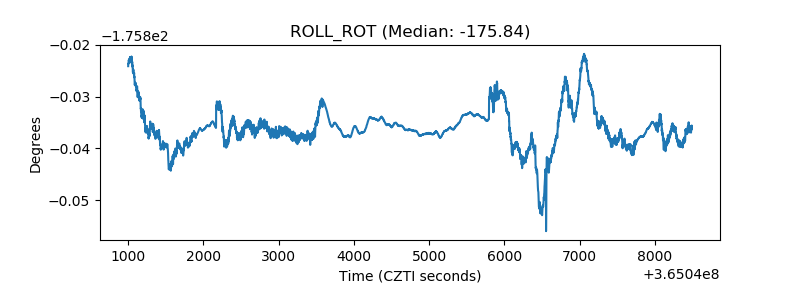 |
| _Roll_DEC | 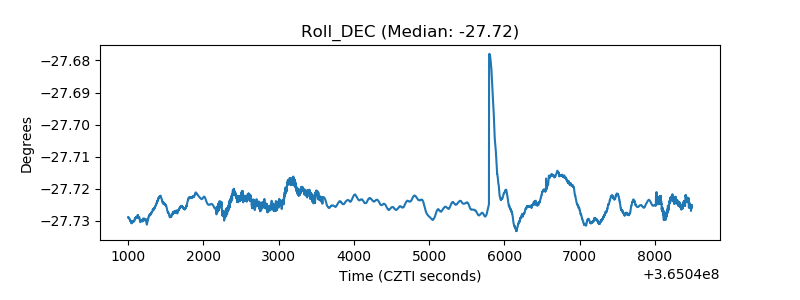 |
| _Roll_RA |  |
| Veto Counter | 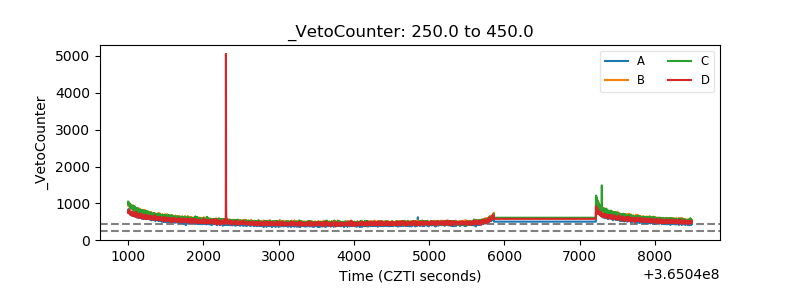 |