| Param | Original file | Final file |
|---|---|---|
| Filename | modeM0/AS1A10_119T01_9000004590_31514cztM0_level2.evt | modeM0/AS1A10_119T01_9000004590_31514cztM0_level2_quad_clean.evt |
| Size (bytes) | 613,811,520 | 71,527,680 |
| Size | 585.4 MB | 68.2 MB |
| Events in quadrant A | 4,362,101 | 435,552 |
| Events in quadrant B | 5,888,502 | 429,728 |
| Events in quadrant C | 3,810,075 | 427,505 |
| Events in quadrant D | 4,079,843 | 410,224 |
| Mode M9 | |||
|---|---|---|---|
| Quadrant | BADHDUFLAG | Total packets | Discarded packets |
| A | 0 | 14 | 0 |
| B | 0 | 15 | 0 |
| C | 0 | 15 | 0 |
| D | 0 | 15 | 0 |
| Mode M0 | |||
|---|---|---|---|
| Quadrant | BADHDUFLAG | Total packets | Discarded packets |
| A | 0 | 17179 | 2 |
| B | 0 | 21994 | 2 |
| C | 0 | 15107 | 2 |
| D | 0 | 16231 | 2 |
| Mode SS | |||
|---|---|---|---|
| Quadrant | BADHDUFLAG | Total packets | Discarded packets |
| A | 0 | 134 | 0 |
| B | 0 | 134 | 0 |
| C | 0 | 134 | 0 |
| D | 0 | 134 | 0 |
| Quadrant | Total seconds | Saturated seconds | Saturation percentage |
|---|---|---|---|
| A | 6637 | 213 | 3.209281% |
| B | 6637 | 342 | 5.152931% |
| C | 6637 | 164 | 2.470996% |
| D | 6637 | 120 | 1.808046% |
Noise dominated data is calculated using 1-second bins in cleaned event files. If a bin has >2000 counts, and if more than 50% of those come from <1% of pixels, then it is considered to be noise-dominated and hence unusable.
| Quadrant | # 1 sec bins | Bins with >0 counts | Bins with >2000 counts | High rate bins dominated by noise | Noise dominated (total time) | Noise dominated (detector-on time) | Marked lightcurve |
|---|---|---|---|---|---|---|---|
| A | 7837 | 6638 | 121 | 121 | 1.54% | 1.82% |  |
| B | 7837 | 6638 | 130 | 130 | 1.66% | 1.96% | 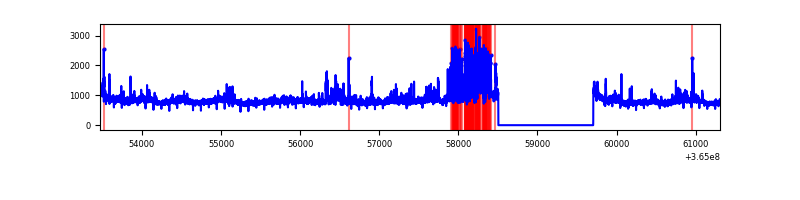 |
| C | 7837 | 6637 | 23 | 23 | 0.29% | 0.35% | 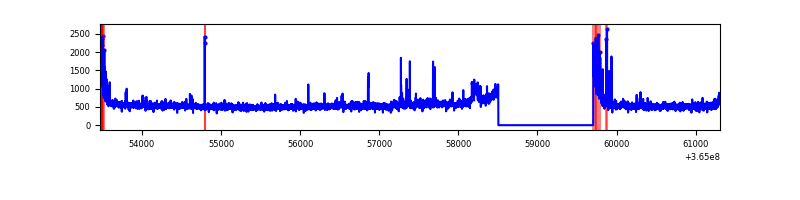 |
| D | 7837 | 6638 | 100 | 100 | 1.28% | 1.51% | 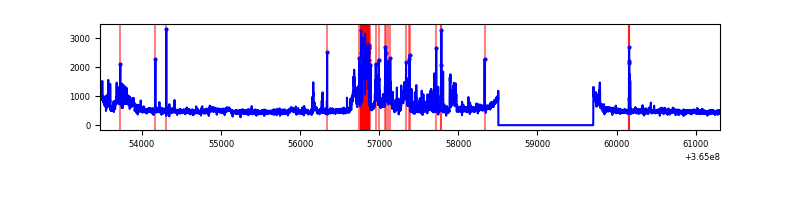 |
Top three noisy pixels from each quadrant. If the there are fewer than three noisy pixels in the level2.evt file, extra rows are filled as -1
| Pixel properties | Quadrant properties | ||||||
|---|---|---|---|---|---|---|---|
| Quadrant | DetID | PixID | Counts | Sigma | Mean | Median | Sigma |
| A | 0 | 13 | 1053902 | 6136.44 | 857 | 842 | 171.6 |
| A | 13 | 254 | 11697 | 63.25 | 857 | 842 | 171.6 |
| A | 3 | 137 | 8180 | 42.76 | 857 | 842 | 171.6 |
| B | 6 | 159 | 1808478 | 11211.08 | 849 | 829 | 161.2 |
| B | 5 | 172 | 450736 | 2790.33 | 849 | 829 | 161.2 |
| B | 4 | 80 | 200847 | 1240.52 | 849 | 829 | 161.2 |
| C | 0 | 10 | 177484 | 915.79 | 831 | 838 | 192.9 |
| C | 3 | 233 | 145012 | 747.45 | 831 | 838 | 192.9 |
| C | 14 | 238 | 134498 | 692.94 | 831 | 838 | 192.9 |
| D | 8 | 195 | 288493 | 1451.55 | 830 | 808 | 198.2 |
| D | 12 | 79 | 241658 | 1215.24 | 830 | 808 | 198.2 |
| D | 12 | 233 | 238066 | 1197.11 | 830 | 808 | 198.2 |
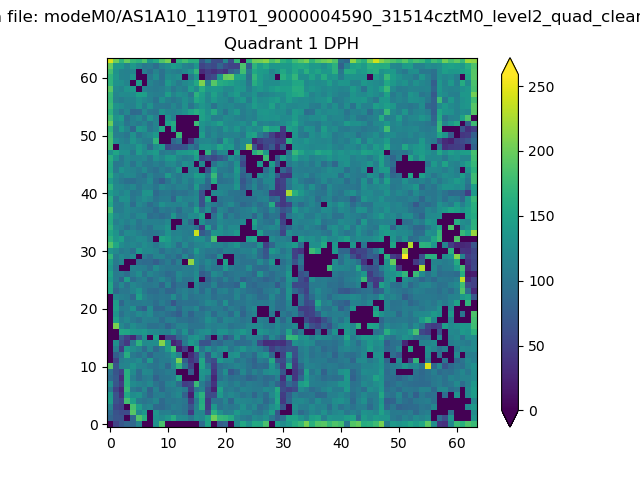
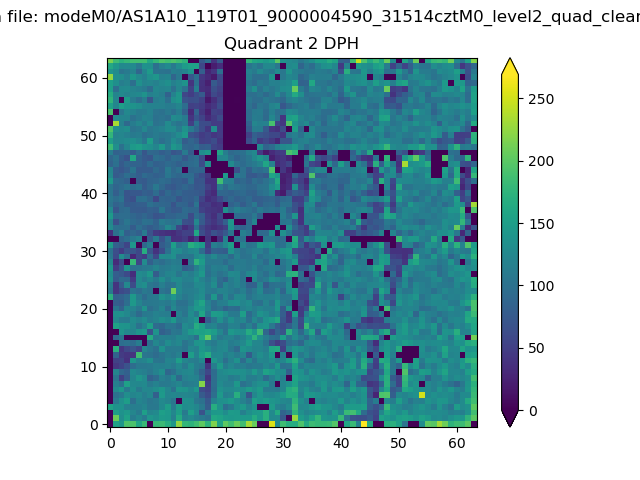
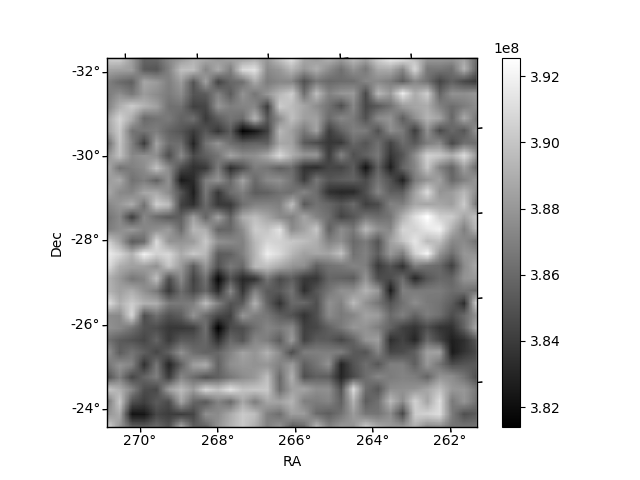
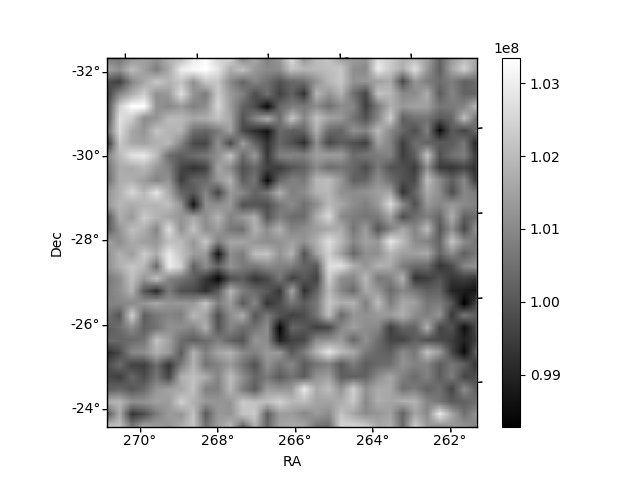
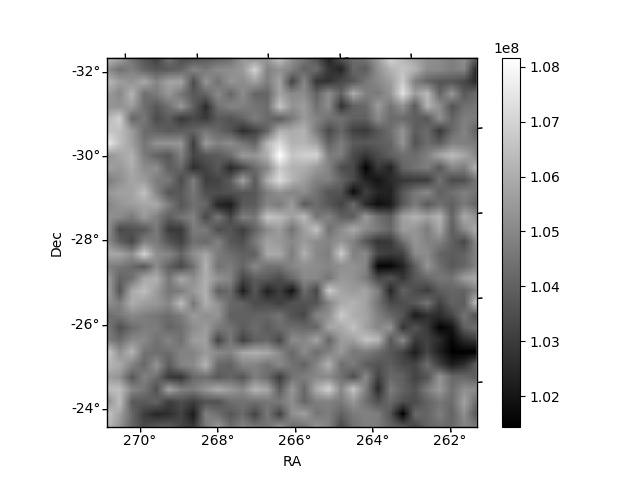
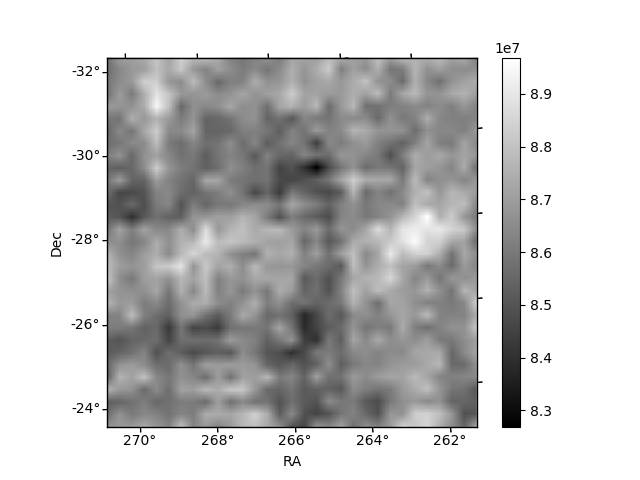
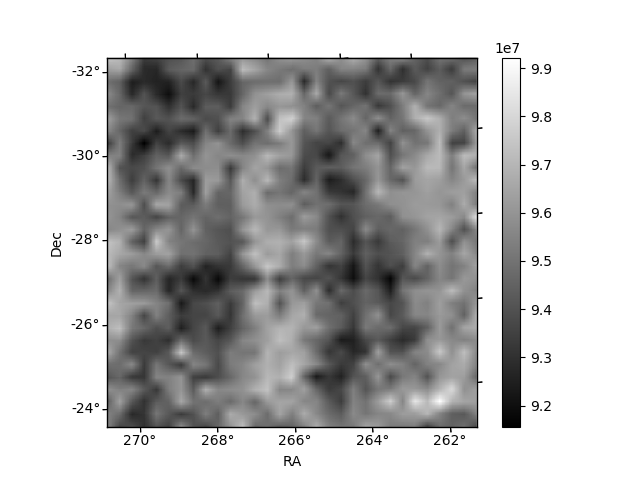
Histogram calculated using DETX and DETY for each event in the final _common_clean file
| Quadrant A | 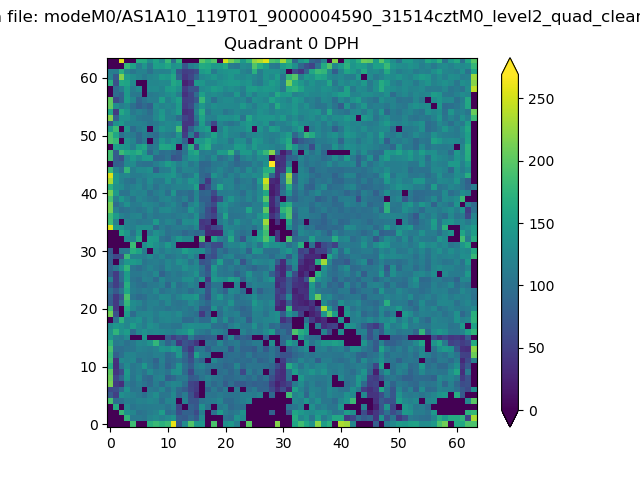 |
 |
Quadrant B |
|---|---|---|---|
| Quadrant D | 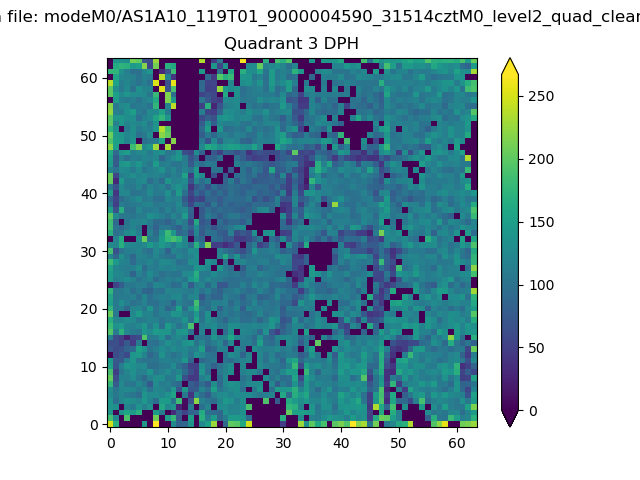 |
 |
Quadrant C |
| Plot type | Count rate plots | Images |
|---|---|---|
| Comparison with Poisson distribution Blue bars denote a histogram of data divided into 1 sec bins. Red curve is a Poisson curve with rate = median count rate of data. |
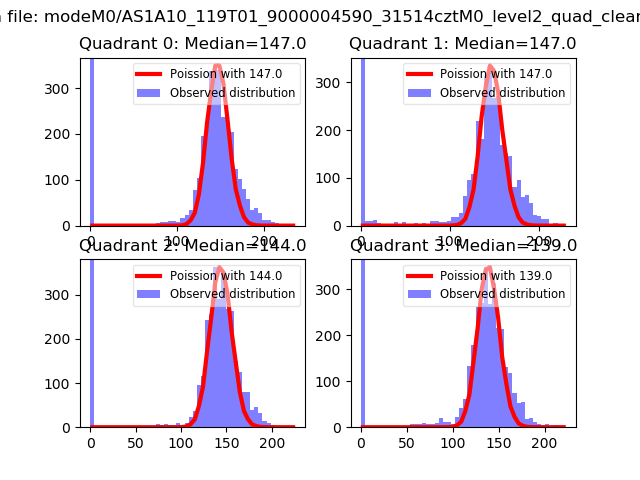 |
 |
| Quadrant-wise count rates Data is divided into 100 sec bins |
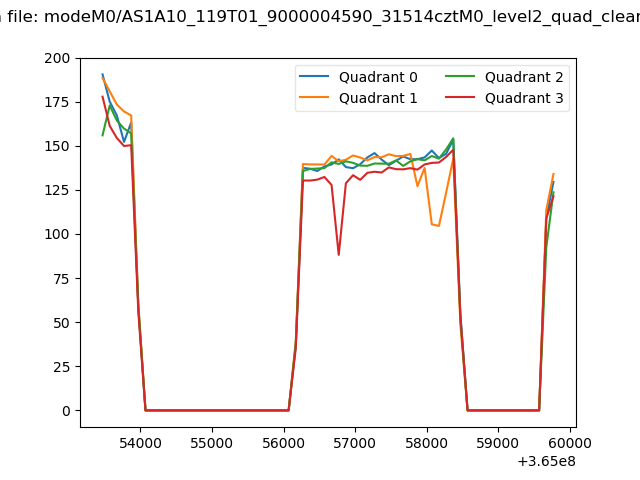 |
|
| Module-wise count rates for Quadrant A Data is divided into 100 sec bins |
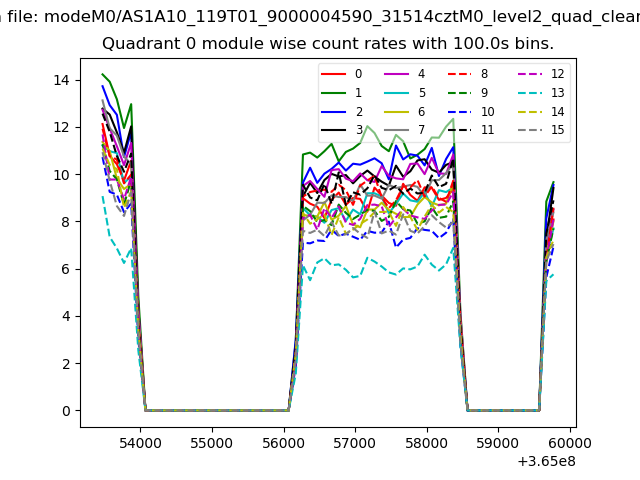 |
 |
| Module-wise count rates for Quadrant B Data is divided into 100 sec bins |
 |
 |
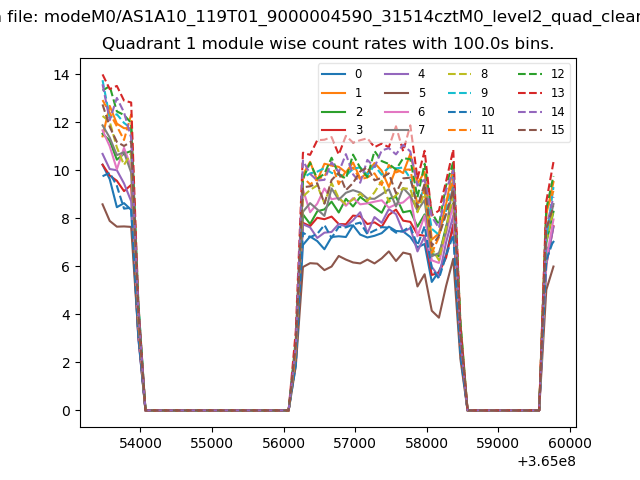
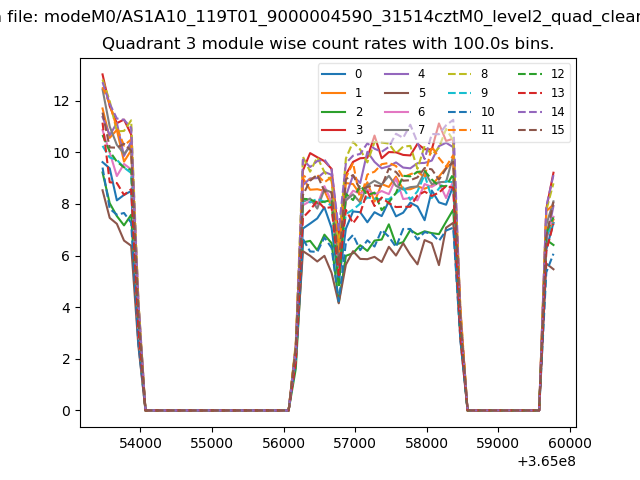
| Module-wise count rates for Quadrant C Data is divided into 100 sec bins |
 |
 |
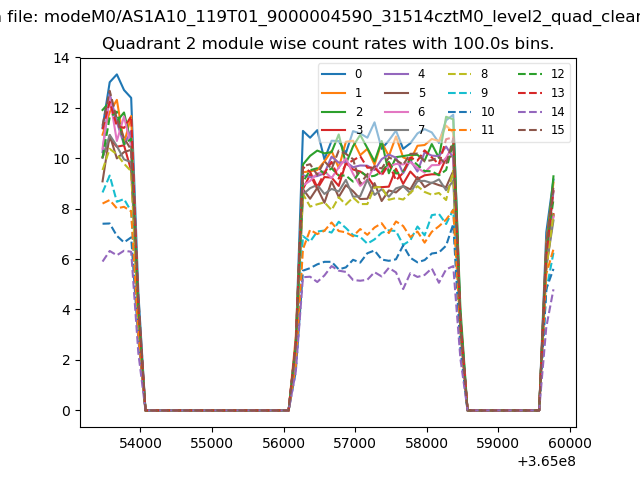
| Module-wise count rates for Quadrant D Data is divided into 100 sec bins |
 |
 |
| Parameter | Plot |
|---|---|
| CZT HV Monitor | 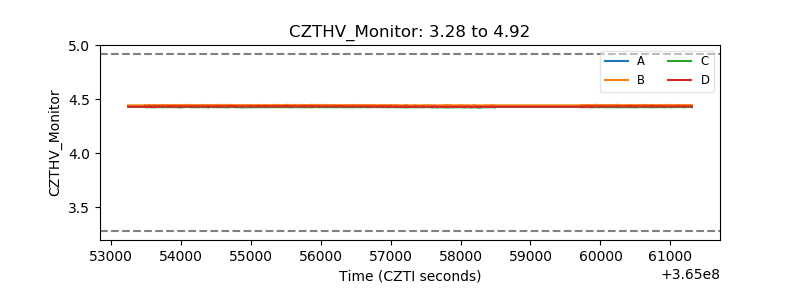 |
| D_VDD | 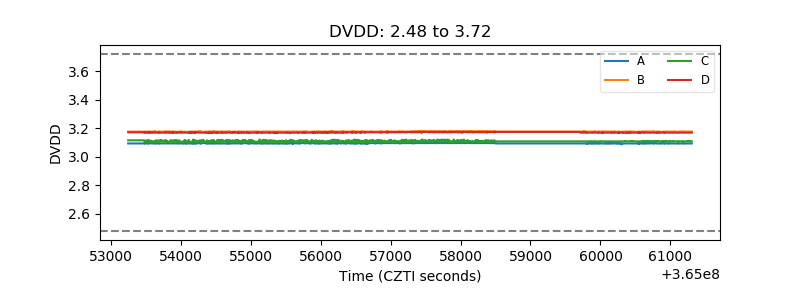 |
| Temperature 1 | 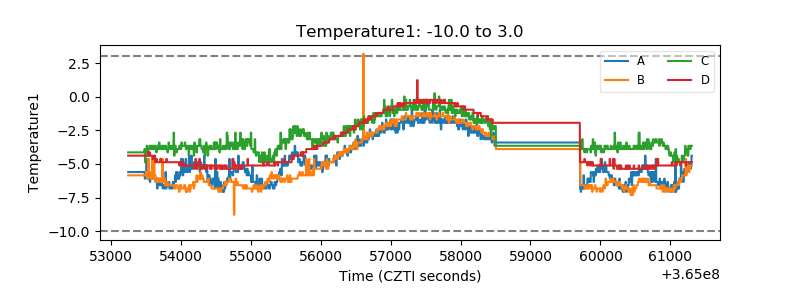 |
| Veto HV Monitor |  |
| Veto LLD | 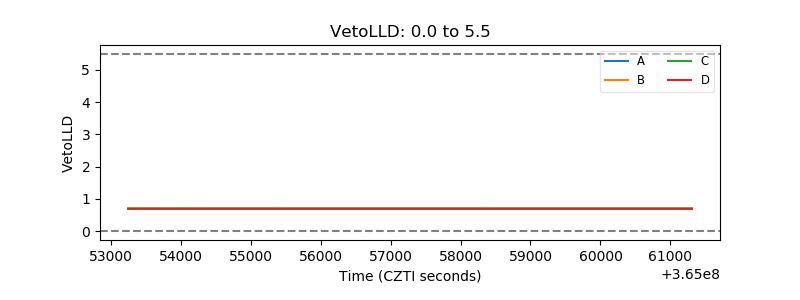 |
| Alpha Counter | 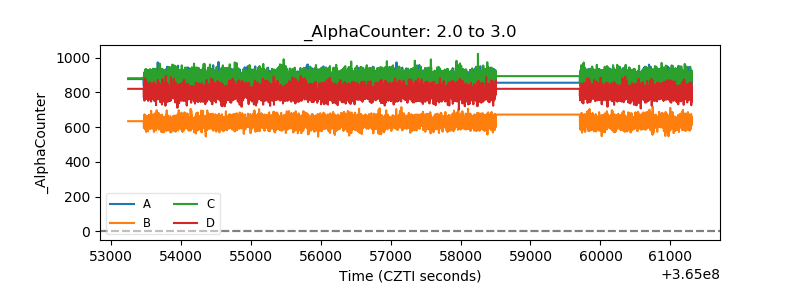 |
| _CPM_Rate | 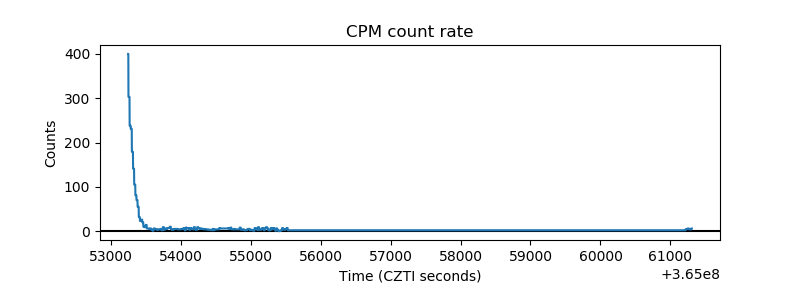 |
| CZT Counter | 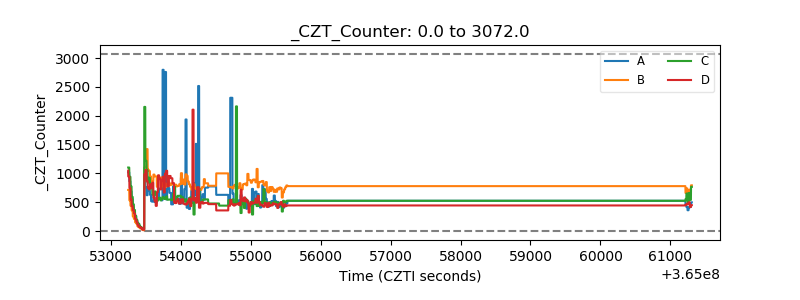 |
| +2.5 Volts monitor |  |
| +5 Volts monitor |  |
| _ROLL_ROT | 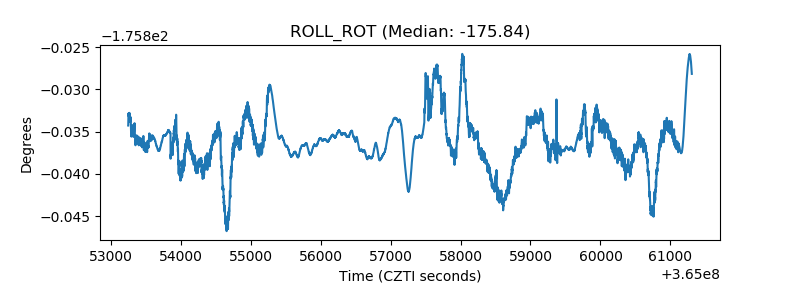 |
| _Roll_DEC |  |
| _Roll_RA | 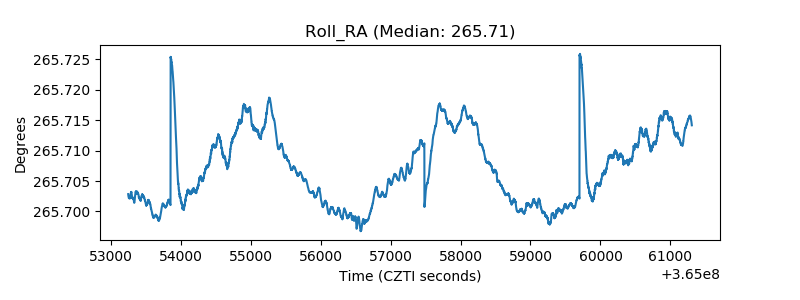 |
| Veto Counter | 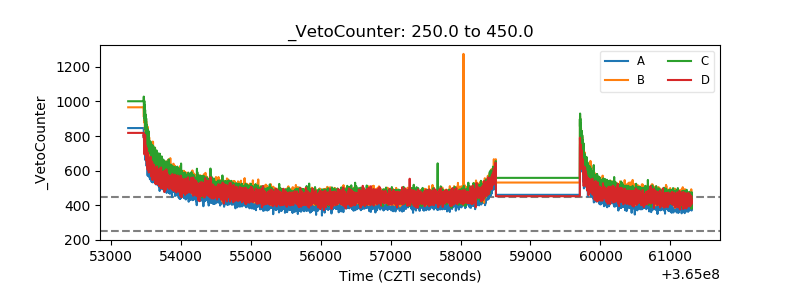 |