| Param | Original file | Final file |
|---|---|---|
| Filename | modeM0/AS1A10_119T01_9000004590_31515cztM0_level2.evt | modeM0/AS1A10_119T01_9000004590_31515cztM0_level2_quad_clean.evt |
| Size (bytes) | 674,775,360 | 71,173,440 |
| Size | 643.5 MB | 67.9 MB |
| Events in quadrant A | 5,748,648 | 415,427 |
| Events in quadrant B | 5,641,752 | 436,300 |
| Events in quadrant C | 4,202,574 | 421,284 |
| Events in quadrant D | 4,376,350 | 400,750 |
| Mode M9 | |||
|---|---|---|---|
| Quadrant | BADHDUFLAG | Total packets | Discarded packets |
| A | 0 | 10 | 0 |
| B | 0 | 11 | 0 |
| C | 0 | 11 | 0 |
| D | 0 | 11 | 0 |
| Mode M0 | |||
|---|---|---|---|
| Quadrant | BADHDUFLAG | Total packets | Discarded packets |
| A | 0 | 21535 | 3 |
| B | 0 | 21713 | 2 |
| C | 0 | 16716 | 2 |
| D | 0 | 17360 | 2 |
| Mode SS | |||
|---|---|---|---|
| Quadrant | BADHDUFLAG | Total packets | Discarded packets |
| A | 0 | 142 | 0 |
| B | 0 | 142 | 0 |
| C | 0 | 142 | 0 |
| D | 0 | 142 | 0 |
| Quadrant | Total seconds | Saturated seconds | Saturation percentage |
|---|---|---|---|
| A | 6896 | 744 | 10.788863% |
| B | 6896 | 155 | 2.247680% |
| C | 6896 | 187 | 2.711717% |
| D | 6896 | 242 | 3.509281% |
Noise dominated data is calculated using 1-second bins in cleaned event files. If a bin has >2000 counts, and if more than 50% of those come from <1% of pixels, then it is considered to be noise-dominated and hence unusable.
| Quadrant | # 1 sec bins | Bins with >0 counts | Bins with >2000 counts | High rate bins dominated by noise | Noise dominated (total time) | Noise dominated (detector-on time) | Marked lightcurve |
|---|---|---|---|---|---|---|---|
| A | 7761 | 6896 | 565 | 565 | 7.28% | 8.19% | 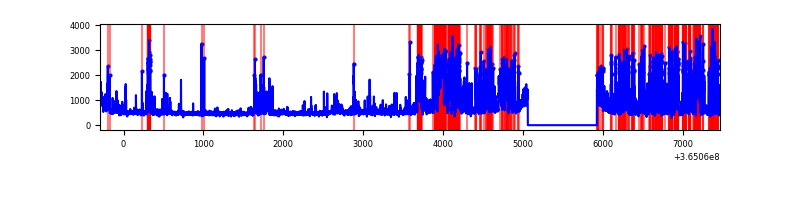 |
| B | 7761 | 6896 | 7 | 7 | 0.09% | 0.10% |  |
| C | 7761 | 6896 | 15 | 15 | 0.19% | 0.22% | 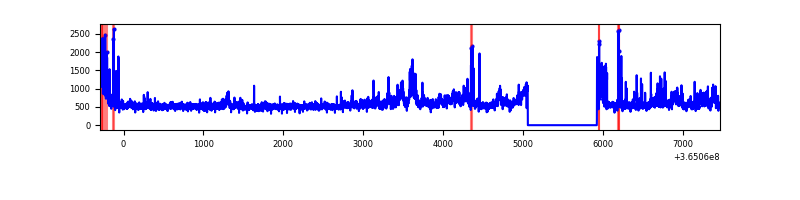 |
| D | 7761 | 6897 | 200 | 200 | 2.58% | 2.90% | 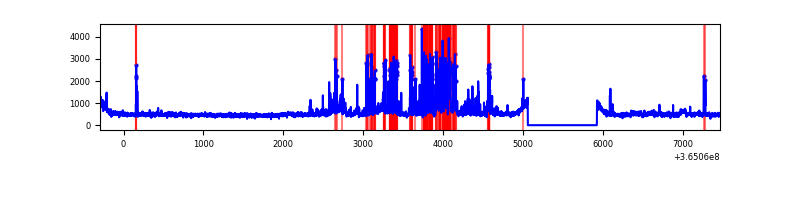 |
Top three noisy pixels from each quadrant. If the there are fewer than three noisy pixels in the level2.evt file, extra rows are filled as -1
| Pixel properties | Quadrant properties | ||||||
|---|---|---|---|---|---|---|---|
| Quadrant | DetID | PixID | Counts | Sigma | Mean | Median | Sigma |
| A | 0 | 13 | 2505702 | 14787.57 | 840 | 824 | 169.4 |
| A | 13 | 254 | 12587 | 69.44 | 840 | 824 | 169.4 |
| A | 3 | 137 | 8481 | 45.2 | 840 | 824 | 169.4 |
| B | 6 | 159 | 1847694 | 10955.09 | 871 | 851 | 168.6 |
| B | 4 | 80 | 183264 | 1082.03 | 871 | 851 | 168.6 |
| B | 0 | 190 | 94237 | 553.94 | 871 | 851 | 168.6 |
| C | 3 | 233 | 508388 | 2577.1 | 838 | 843 | 196.9 |
| C | 0 | 10 | 245541 | 1242.47 | 838 | 843 | 196.9 |
| C | 14 | 238 | 135479 | 683.63 | 838 | 843 | 196.9 |
| D | 12 | 233 | 684575 | 3431.64 | 834 | 814 | 199.3 |
| D | 8 | 195 | 296442 | 1483.69 | 834 | 814 | 199.3 |
| D | 12 | 79 | 84500 | 420.0 | 834 | 814 | 199.3 |
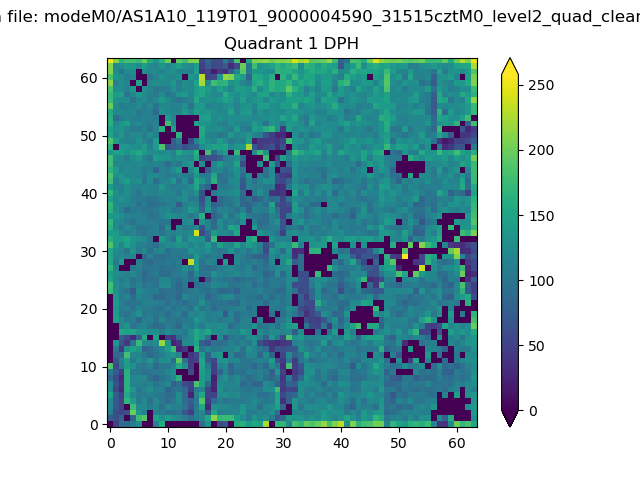
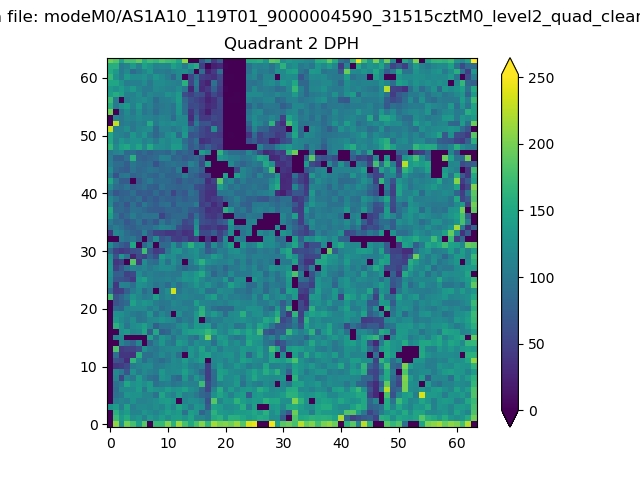
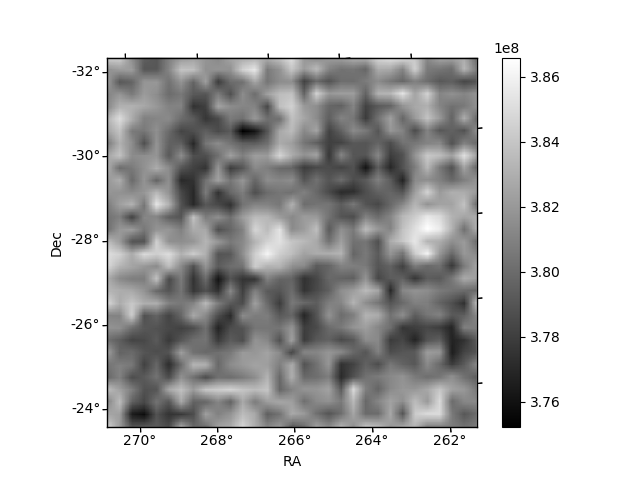
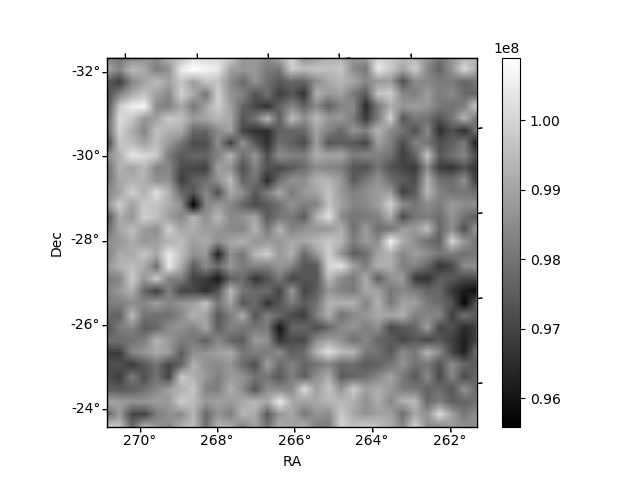
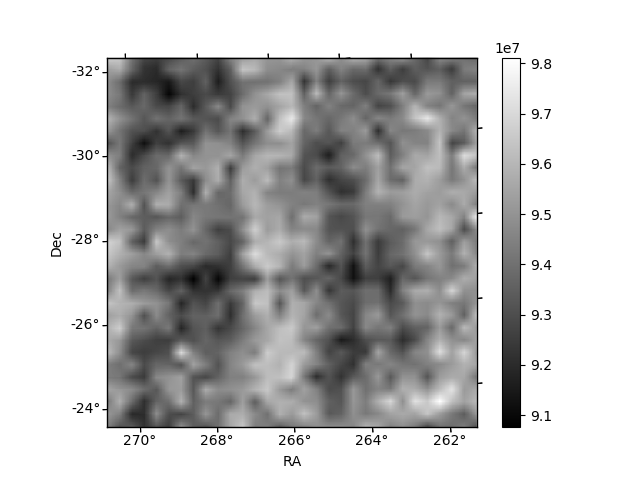
Histogram calculated using DETX and DETY for each event in the final _common_clean file
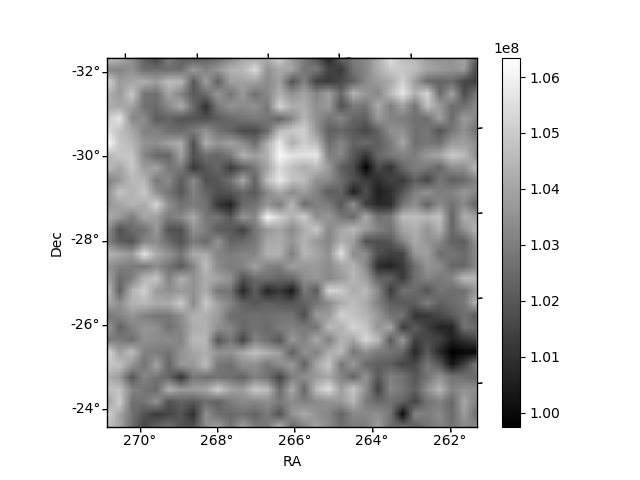
| Quadrant A | 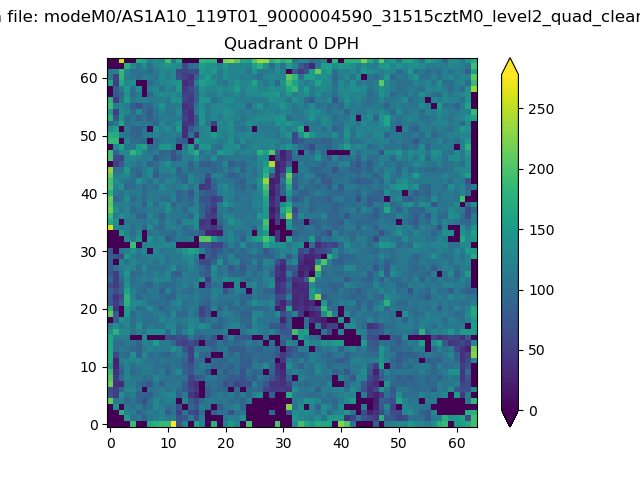 |
 |
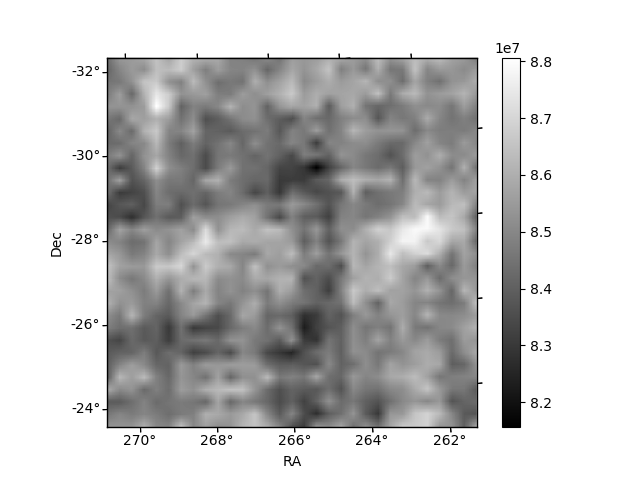
Quadrant B |
|---|---|---|---|
| Quadrant D | 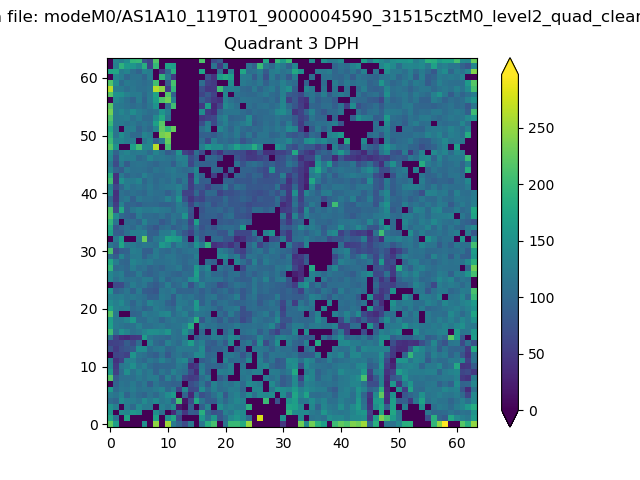 |
 |
Quadrant C |
| Plot type | Count rate plots | Images |
|---|---|---|
| Comparison with Poisson distribution Blue bars denote a histogram of data divided into 1 sec bins. Red curve is a Poisson curve with rate = median count rate of data. |
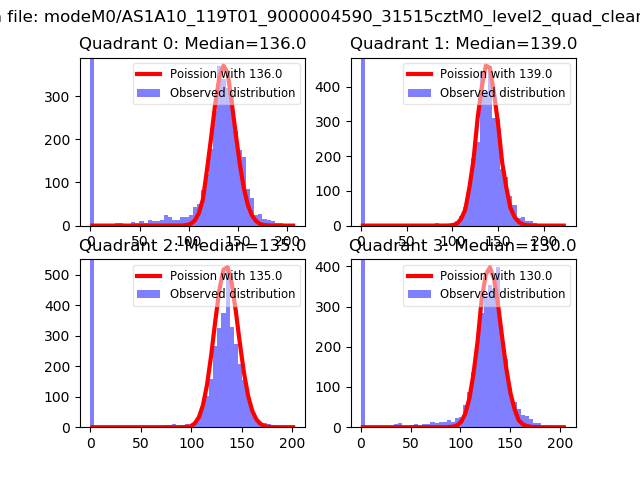 |
 |
| Quadrant-wise count rates Data is divided into 100 sec bins |
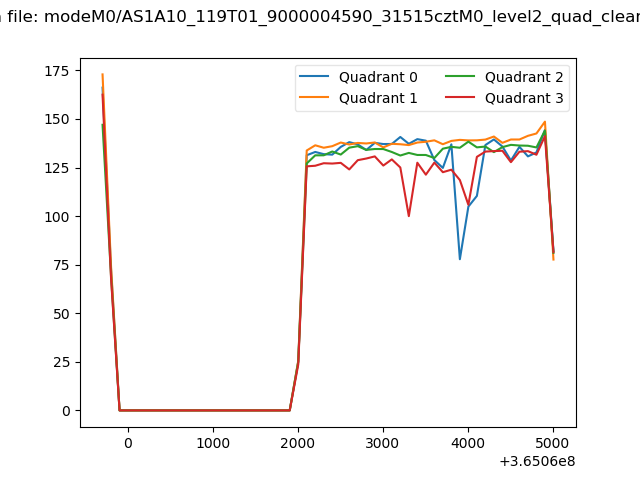 |
|
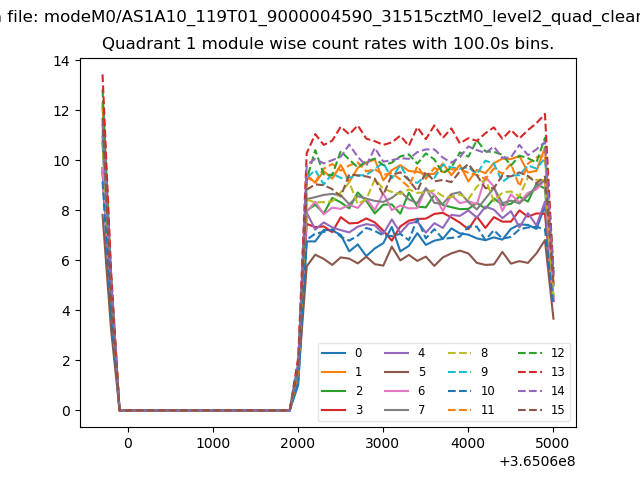
| Module-wise count rates for Quadrant A Data is divided into 100 sec bins |
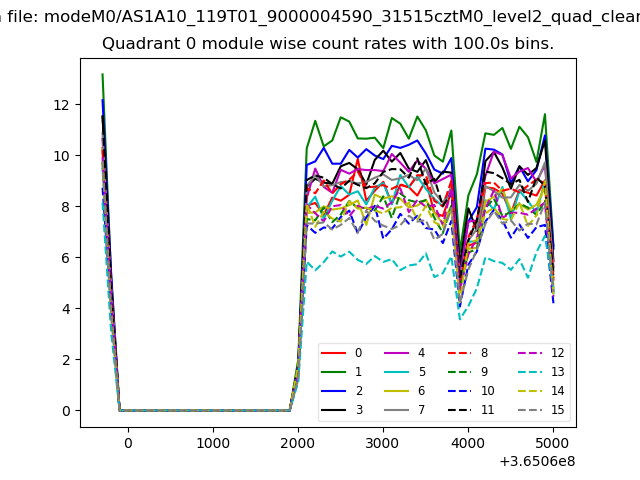 |
 |
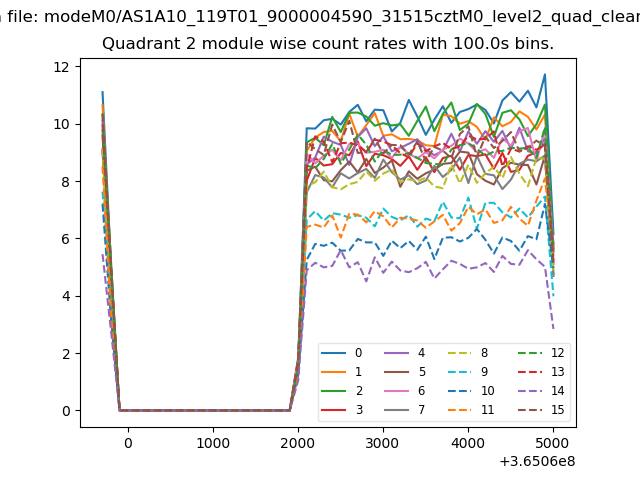
| Module-wise count rates for Quadrant B Data is divided into 100 sec bins |
 |
 |
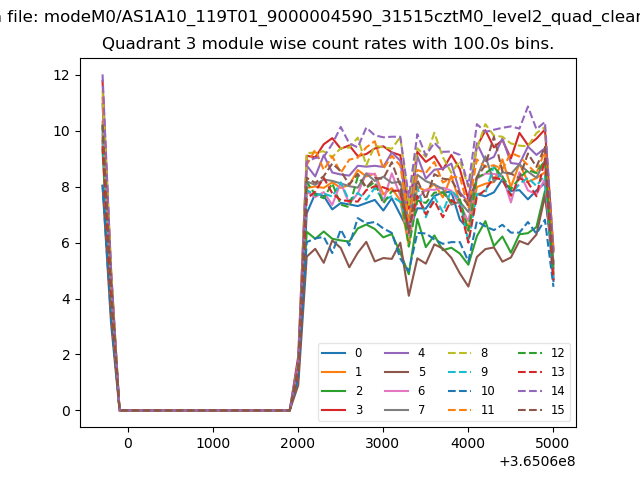
| Module-wise count rates for Quadrant C Data is divided into 100 sec bins |
 |
 |
| Module-wise count rates for Quadrant D Data is divided into 100 sec bins |
 |
 |
| Parameter | Plot |
|---|---|
| CZT HV Monitor | 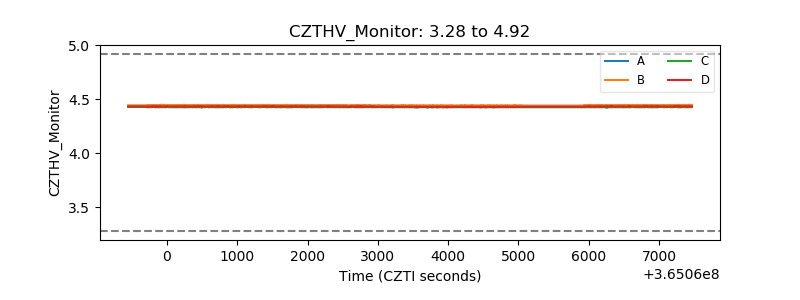 |
| D_VDD | 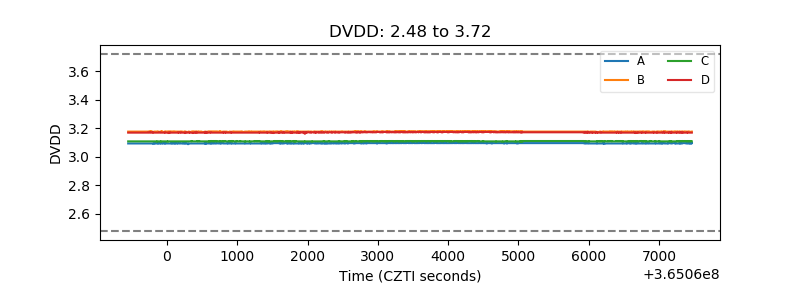 |
| Temperature 1 | 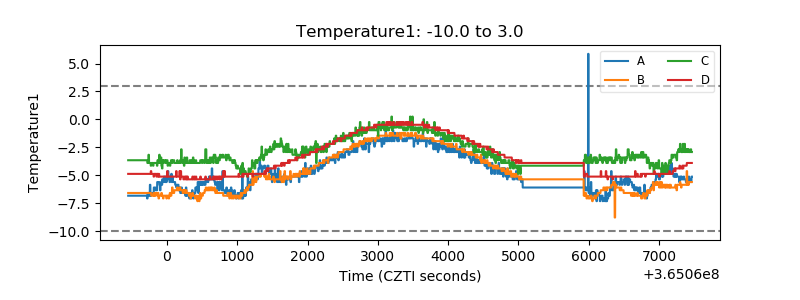 |
| Veto HV Monitor | 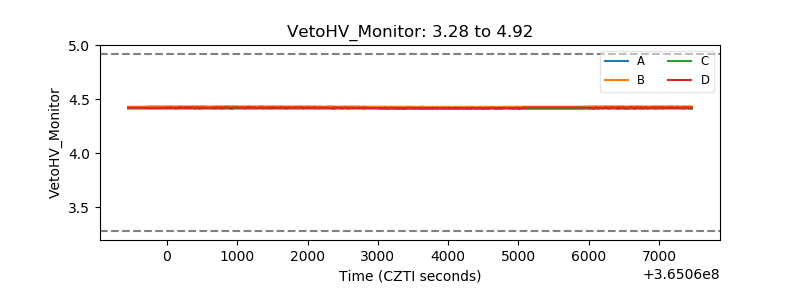 |
| Veto LLD | 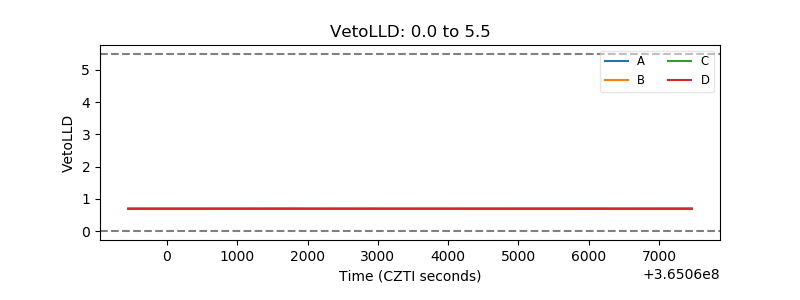 |
| Alpha Counter | 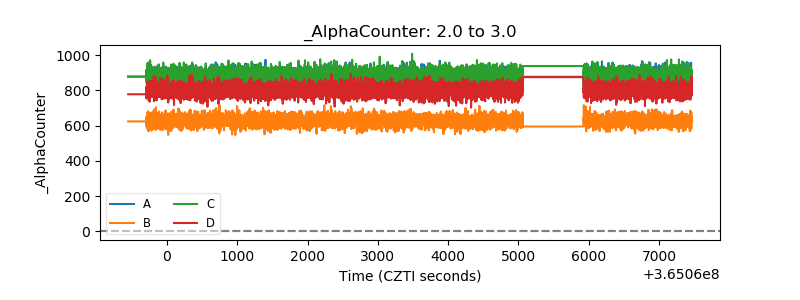 |
| _CPM_Rate | 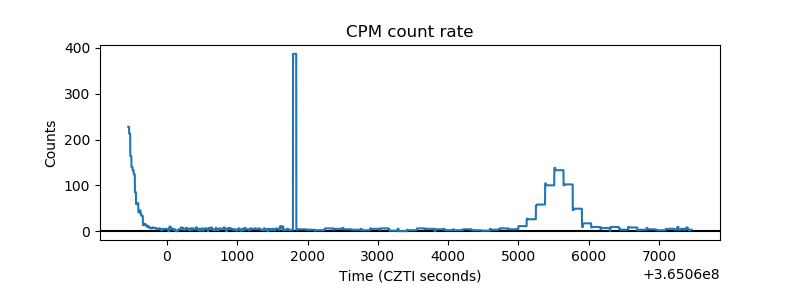 |
| CZT Counter | 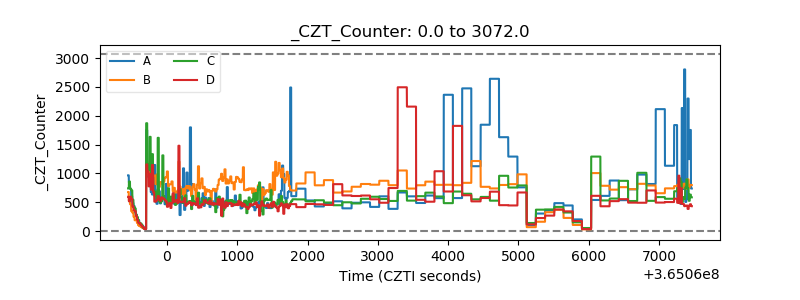 |
| +2.5 Volts monitor |  |
| +5 Volts monitor |  |
| _ROLL_ROT | 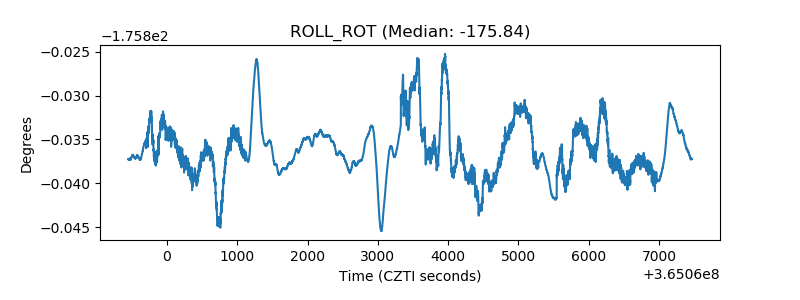 |
| _Roll_DEC | 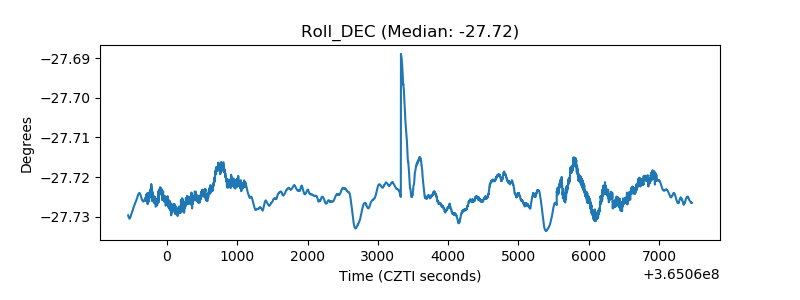 |
| _Roll_RA | 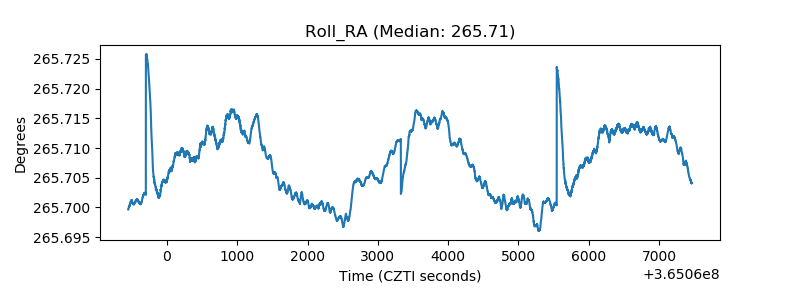 |
| Veto Counter | 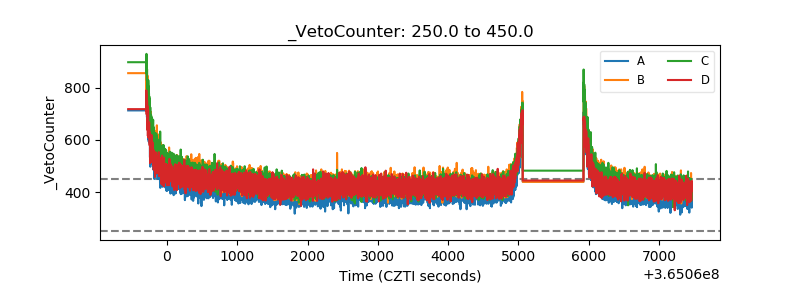 |