| Param | Original file | Final file |
|---|---|---|
| Filename | modeM0/AS1A10_119T01_9000004590_31524cztM0_level2.evt | modeM0/AS1A10_119T01_9000004590_31524cztM0_level2_quad_clean.evt |
| Size (bytes) | 1,421,988,480 | 208,362,240 |
| Size | 1.3 GB | 198.7 MB |
| Events in quadrant A | 11,352,322 | 1,302,299 |
| Events in quadrant B | 12,138,551 | 1,353,321 |
| Events in quadrant C | 8,944,615 | 1,318,137 |
| Events in quadrant D | 9,593,848 | 1,275,982 |
| Mode M9 | |||
|---|---|---|---|
| Quadrant | BADHDUFLAG | Total packets | Discarded packets |
| A | 0 | 6 | 0 |
| B | 0 | 6 | 0 |
| C | 0 | 6 | 0 |
| D | 0 | 6 | 0 |
| Mode M0 | |||
|---|---|---|---|
| Quadrant | BADHDUFLAG | Total packets | Discarded packets |
| A | 0 | 43673 | 2 |
| B | 0 | 47624 | 2 |
| C | 0 | 36115 | 2 |
| D | 0 | 38112 | 2 |
| Mode SS | |||
|---|---|---|---|
| Quadrant | BADHDUFLAG | Total packets | Discarded packets |
| A | 0 | 310 | 0 |
| B | 0 | 310 | 0 |
| C | 0 | 310 | 0 |
| D | 0 | 310 | 0 |
| Quadrant | Total seconds | Saturated seconds | Saturation percentage |
|---|---|---|---|
| A | 15379 | 1728 | 11.236101% |
| B | 15379 | 635 | 4.129007% |
| C | 15380 | 545 | 3.543563% |
| D | 15380 | 559 | 3.634590% |
Noise dominated data is calculated using 1-second bins in cleaned event files. If a bin has >2000 counts, and if more than 50% of those come from <1% of pixels, then it is considered to be noise-dominated and hence unusable.
| Quadrant | # 1 sec bins | Bins with >0 counts | Bins with >2000 counts | High rate bins dominated by noise | Noise dominated (total time) | Noise dominated (detector-on time) | Marked lightcurve |
|---|---|---|---|---|---|---|---|
| A | 15915 | 15380 | 1052 | 1052 | 6.61% | 6.84% | 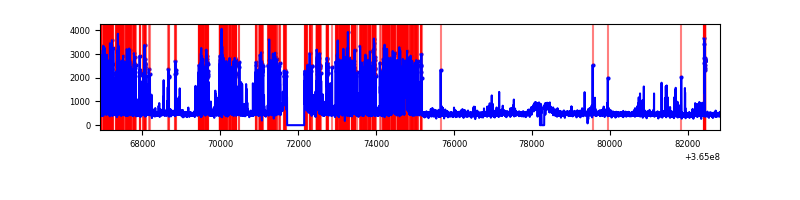 |
| B | 15915 | 15380 | 46 | 46 | 0.29% | 0.30% | 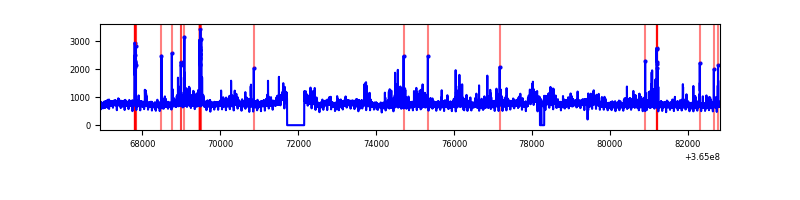 |
| C | 15916 | 15381 | 50 | 50 | 0.31% | 0.33% | 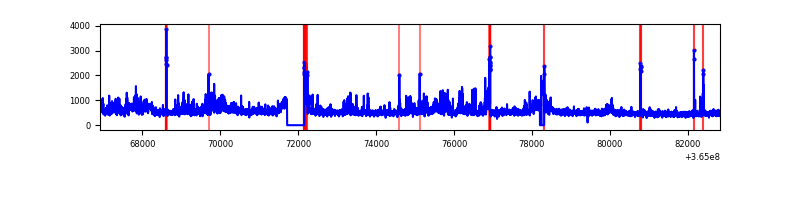 |
| D | 15916 | 15381 | 246 | 246 | 1.55% | 1.60% | 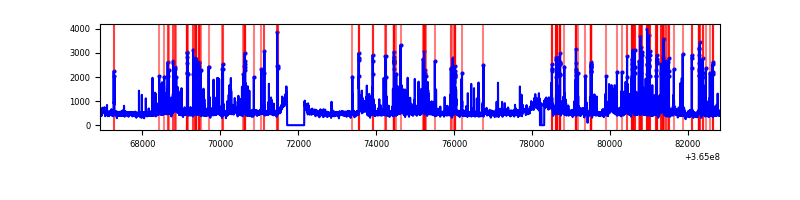 |
Top three noisy pixels from each quadrant. If the there are fewer than three noisy pixels in the level2.evt file, extra rows are filled as -1
| Pixel properties | Quadrant properties | ||||||
|---|---|---|---|---|---|---|---|
| Quadrant | DetID | PixID | Counts | Sigma | Mean | Median | Sigma |
| A | 0 | 13 | 4295957 | 11713.81 | 1815 | 1776 | 366.6 |
| A | 13 | 170 | 54865 | 144.82 | 1815 | 1776 | 366.6 |
| A | 13 | 254 | 28351 | 72.49 | 1815 | 1776 | 366.6 |
| B | 6 | 159 | 4102107 | 11489.35 | 1860 | 1815 | 356.9 |
| B | 4 | 80 | 353378 | 985.11 | 1860 | 1815 | 356.9 |
| B | 0 | 190 | 115145 | 317.56 | 1860 | 1815 | 356.9 |
| C | 3 | 233 | 873534 | 2062.96 | 1801 | 1812 | 422.6 |
| C | 0 | 10 | 686065 | 1619.31 | 1801 | 1812 | 422.6 |
| C | 14 | 238 | 284752 | 669.59 | 1801 | 1812 | 422.6 |
| D | 8 | 195 | 915091 | 2120.11 | 1820 | 1775 | 430.8 |
| D | 12 | 79 | 762891 | 1766.81 | 1820 | 1775 | 430.8 |
| D | 12 | 233 | 463142 | 1070.99 | 1820 | 1775 | 430.8 |
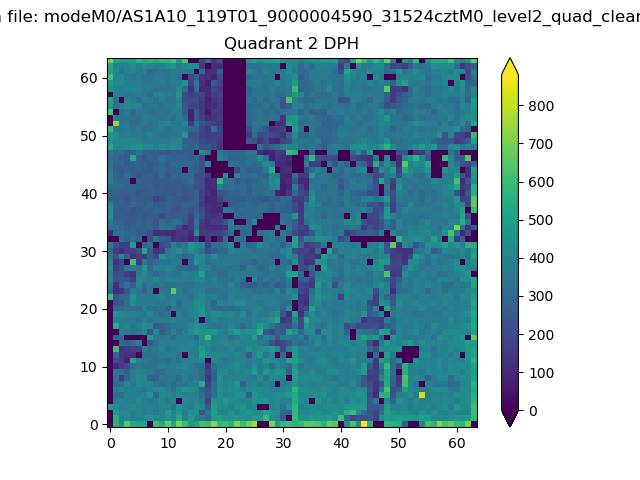
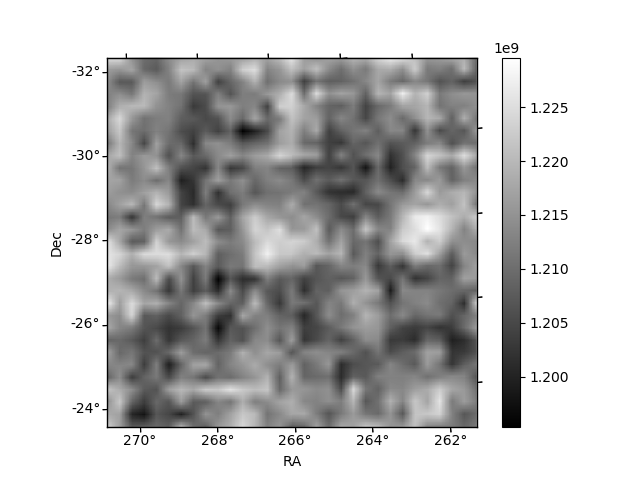
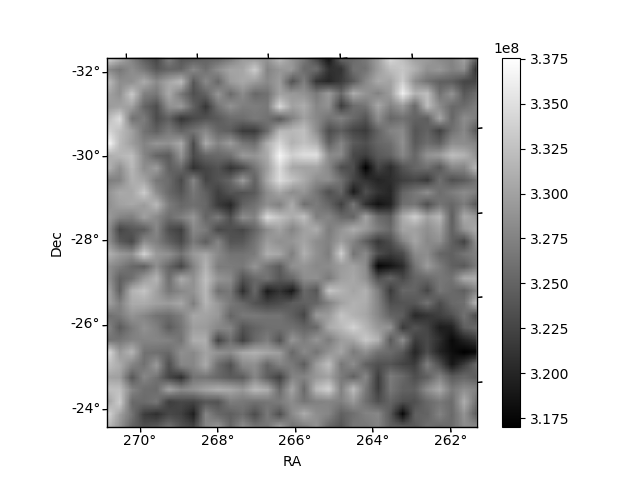
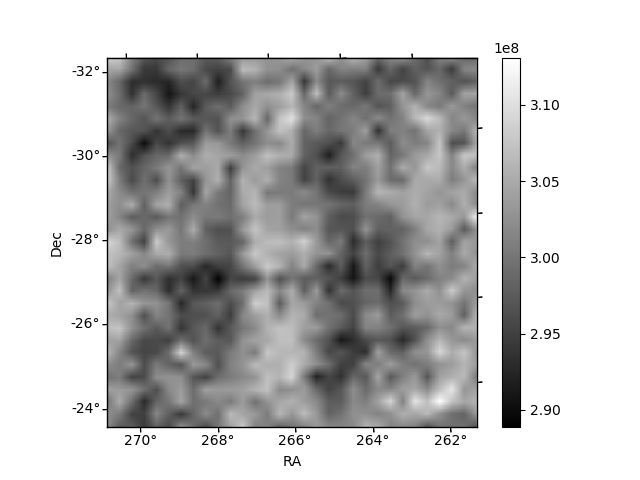
Histogram calculated using DETX and DETY for each event in the final _common_clean file
| Quadrant A | 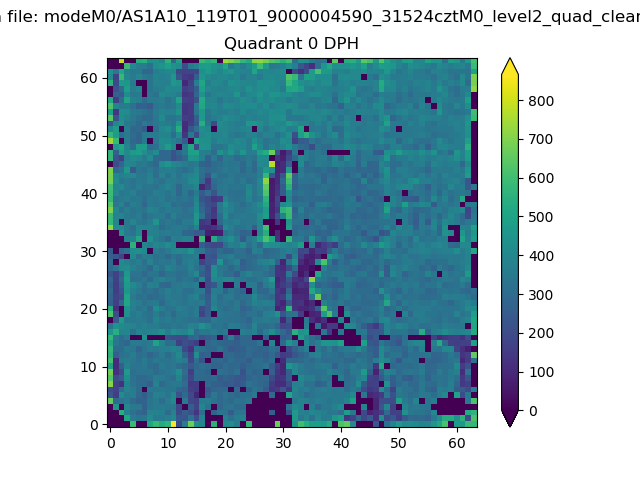 |
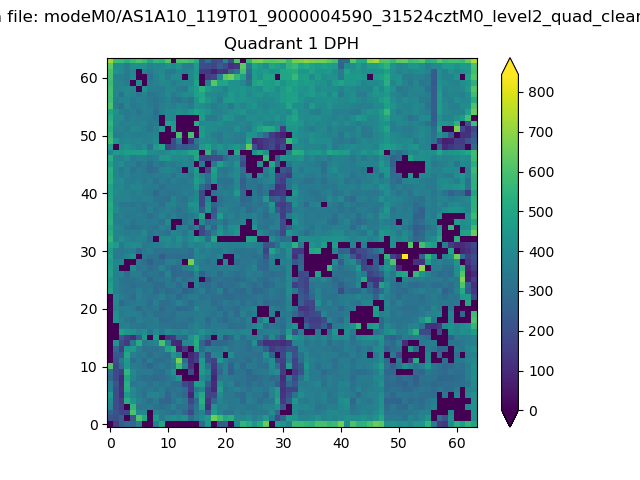 |
Quadrant B |
|---|---|---|---|
| Quadrant D | 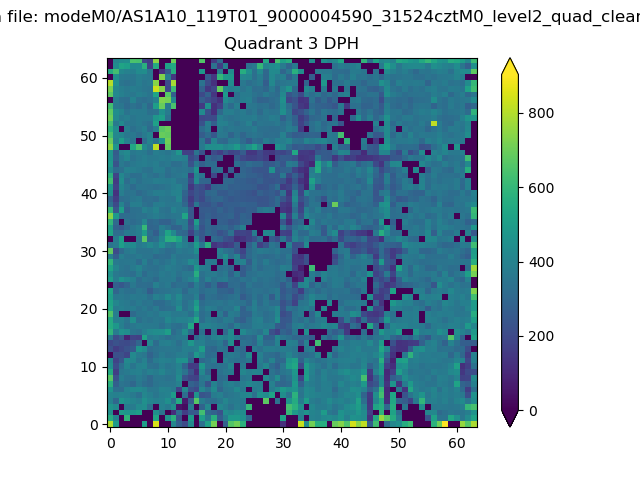 |
 |
Quadrant C |
| Plot type | Count rate plots | Images |
|---|---|---|
| Comparison with Poisson distribution Blue bars denote a histogram of data divided into 1 sec bins. Red curve is a Poisson curve with rate = median count rate of data. |
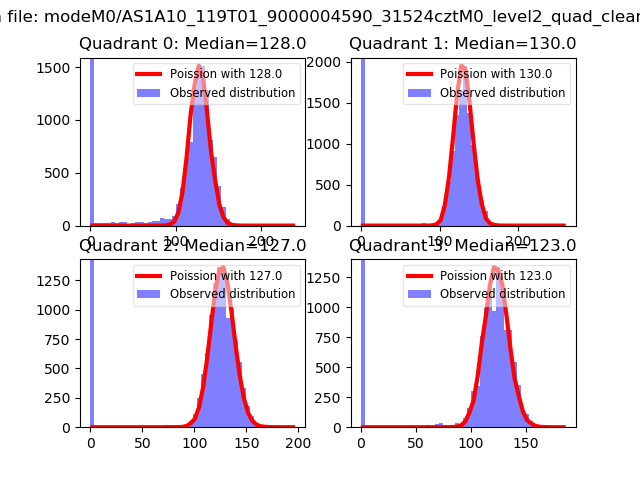 |
 |
| Quadrant-wise count rates Data is divided into 100 sec bins |
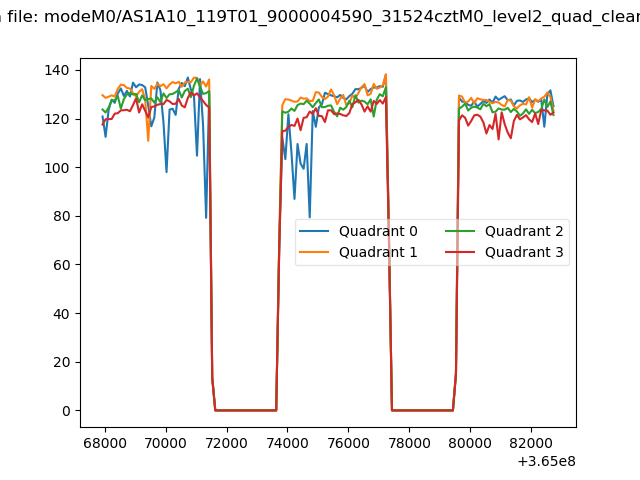 |
|
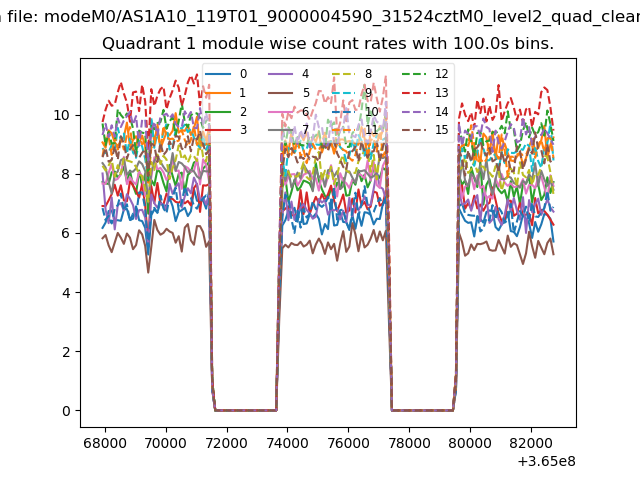
| Module-wise count rates for Quadrant A Data is divided into 100 sec bins |
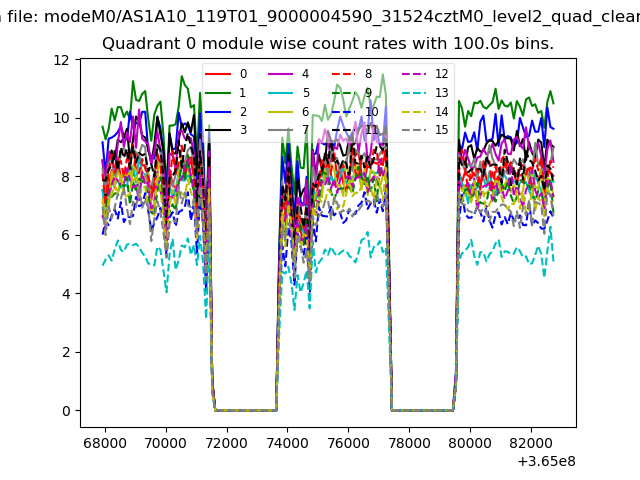 |
 |
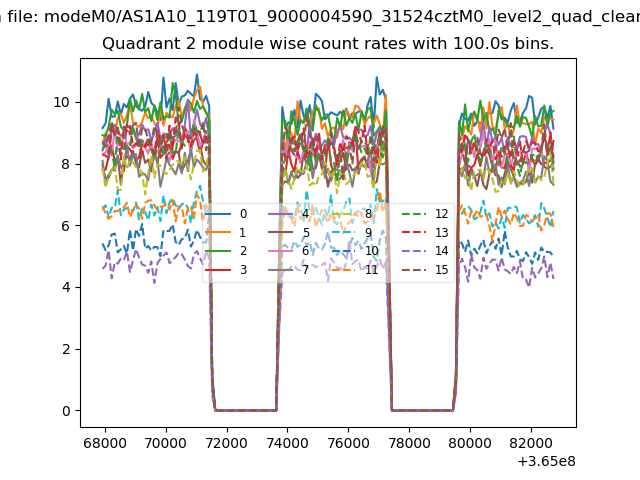
| Module-wise count rates for Quadrant B Data is divided into 100 sec bins |
 |
 |
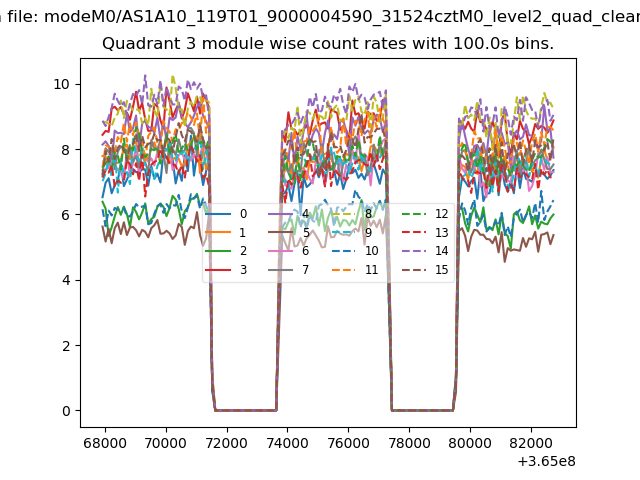
| Module-wise count rates for Quadrant C Data is divided into 100 sec bins |
 |
 |
| Module-wise count rates for Quadrant D Data is divided into 100 sec bins |
 |
 |
| Parameter | Plot |
|---|---|
| CZT HV Monitor | 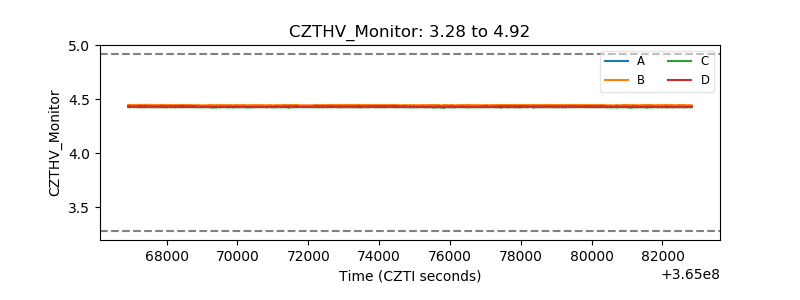 |
| D_VDD | 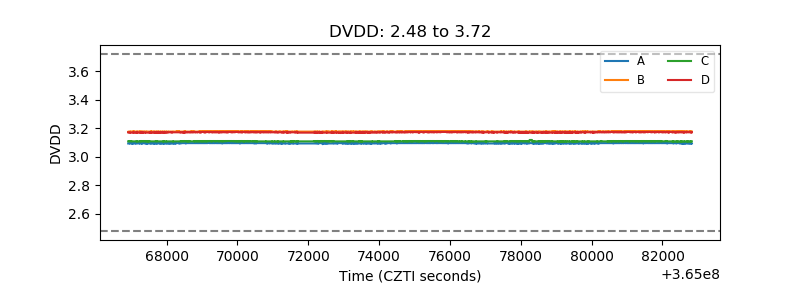 |
| Temperature 1 | 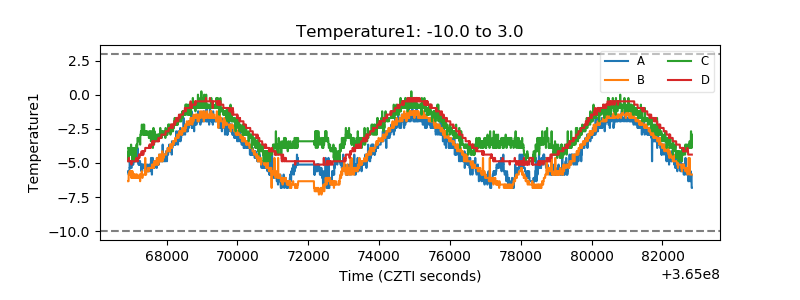 |
| Veto HV Monitor | 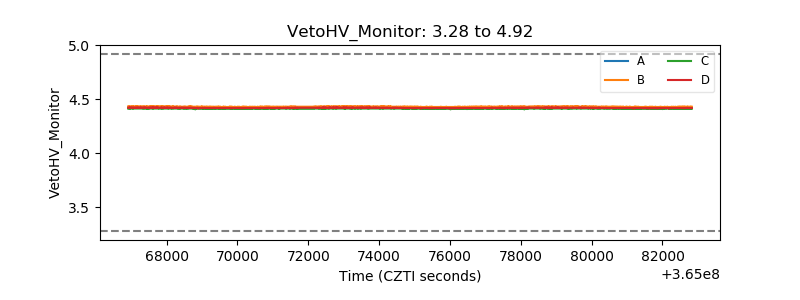 |
| Veto LLD | 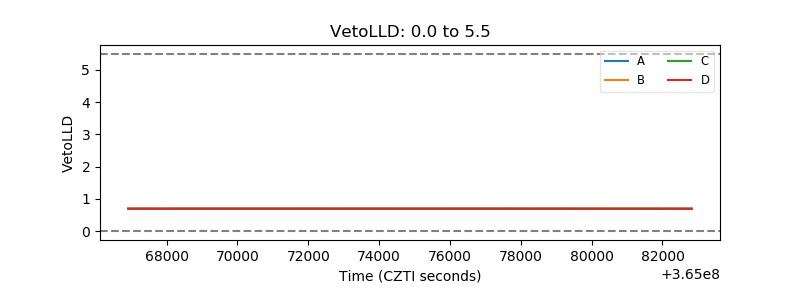 |
| Alpha Counter | 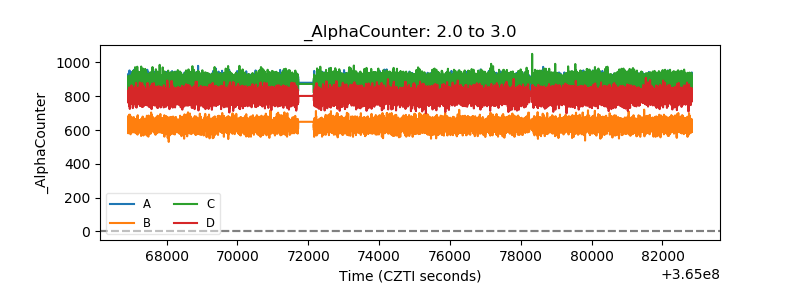 |
| _CPM_Rate | 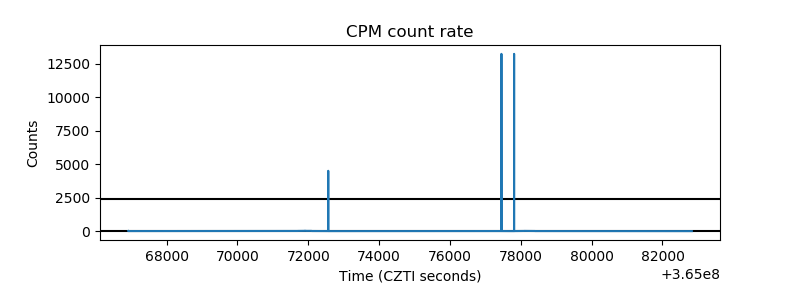 |
| CZT Counter | 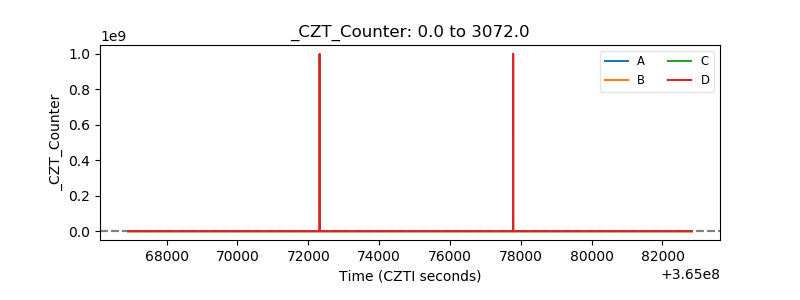 |
| +2.5 Volts monitor | 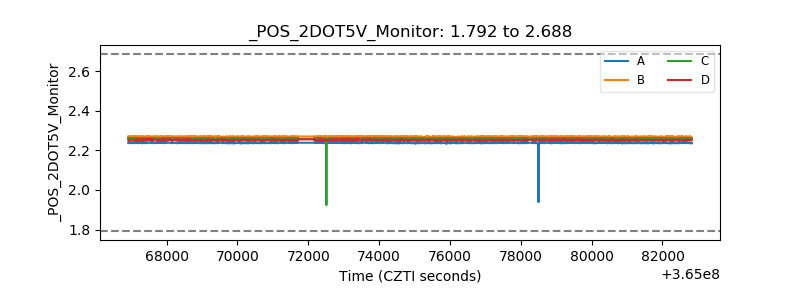 |
| +5 Volts monitor |  |
| _ROLL_ROT | 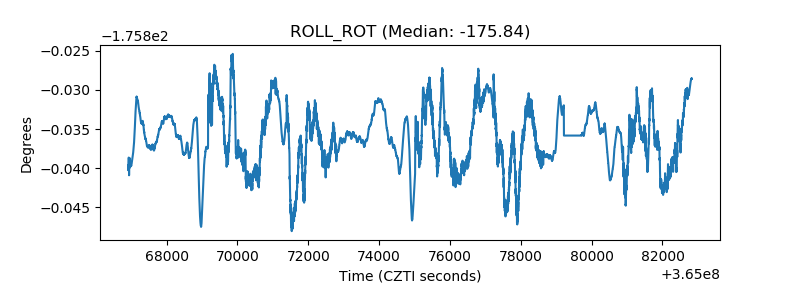 |
| _Roll_DEC | 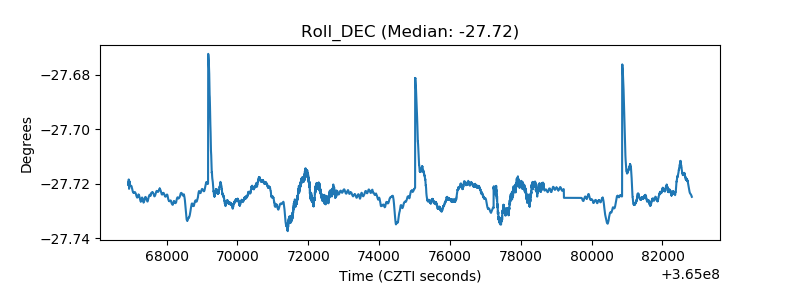 |
| _Roll_RA | 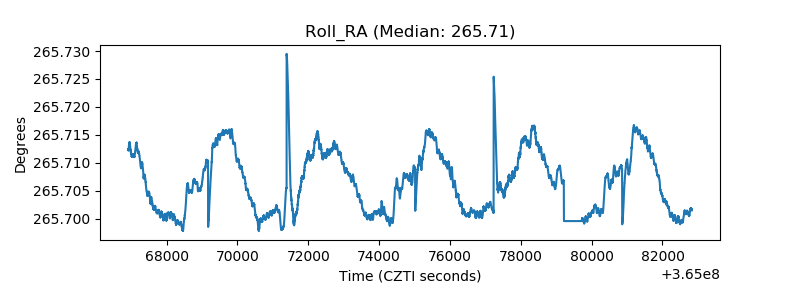 |
| Veto Counter | 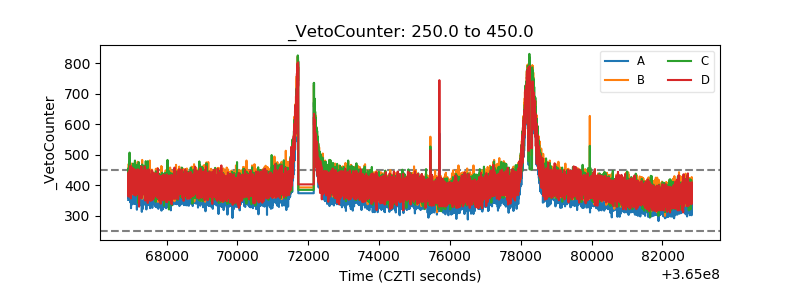 |