| Param | Original file | Final file |
|---|---|---|
| Filename | modeM0/AS1T04_030T01_9000004588cztM0_level2.fits | modeM0/AS1T04_030T01_9000004588cztM0_level2_quad_clean.evt |
| Size (bytes) | 46,785,600 | 37,198,080 |
| Size | 44.6 MB | 35.5 MB |
| Events in quadrant A | 287,376 | 207,823 |
| Events in quadrant B | 267,606 | 204,578 |
| Events in quadrant C | 278,198 | 197,814 |
| Events in quadrant D | 251,418 | 182,910 |
| Mode M0 | |||
|---|---|---|---|
| Quadrant | BADHDUFLAG | Total packets | Discarded packets |
| A | 0 | 10109 | 0 |
| B | 0 | 15214 | 0 |
| C | 0 | 11766 | 0 |
| D | 0 | 10440 | 0 |
| Mode SS | |||
|---|---|---|---|
| Quadrant | BADHDUFLAG | Total packets | Discarded packets |
| A | 0 | 96 | 0 |
| B | 0 | 96 | 0 |
| C | 0 | 96 | 0 |
| D | 0 | 96 | 0 |
| Mode M9 | |||
|---|---|---|---|
| Quadrant | BADHDUFLAG | Total packets | Discarded packets |
| A | 0 | 14 | 0 |
| B | 0 | 14 | 0 |
| C | 0 | 14 | 0 |
| D | 0 | 14 | 0 |
| Quadrant | Total seconds | Saturated seconds | Saturation percentage |
|---|---|---|---|
| A | 4740 | 101 | 2.130802% |
| B | 4725 | 310 | 6.560847% |
| C | 4737 | 249 | 5.256491% |
| D | 4737 | 64 | 1.351066% |
Noise dominated data is calculated using 1-second bins in cleaned event files. If a bin has >2000 counts, and if more than 50% of those come from <1% of pixels, then it is considered to be noise-dominated and hence unusable.
| Quadrant | # 1 sec bins | Bins with >0 counts | Bins with >2000 counts | High rate bins dominated by noise | Noise dominated (total time) | Noise dominated (detector-on time) | Marked lightcurve |
|---|---|---|---|---|---|---|---|
| A | 19805 | 4754 | 0 | 0 | 0.00% | 0.00% |  |
| B | 19806 | 4749 | 0 | 0 | 0.00% | 0.00% |  |
| C | 19806 | 4751 | 0 | 0 | 0.00% | 0.00% |  |
| D | 19806 | 4757 | 0 | 0 | 0.00% | 0.00% |  |
Top three noisy pixels from each quadrant. If the there are fewer than three noisy pixels in the level2.evt file, extra rows are filled as -1
| Pixel properties | Quadrant properties | ||||||
|---|---|---|---|---|---|---|---|
| Quadrant | DetID | PixID | Counts | Sigma | Mean | Median | Sigma |
| A | 0 | 29 | 248 | 8.62 | 75 | 71 | 20.5 |
| A | 7 | 110 | 246 | 8.52 | 75 | 71 | 20.5 |
| A | 9 | 19 | 240 | 8.23 | 75 | 71 | 20.5 |
| B | 2 | 9 | 226 | 9.59 | 70 | 67 | 16.6 |
| B | 3 | 17 | 194 | 7.66 | 70 | 67 | 16.6 |
| B | 2 | 8 | 189 | 7.36 | 70 | 67 | 16.6 |
| C | 1 | 80 | 219 | 7.55 | 73 | 69 | 19.9 |
| C | 1 | 81 | 207 | 6.95 | 73 | 69 | 19.9 |
| C | 3 | 187 | 202 | 6.7 | 73 | 69 | 19.9 |
| D | 7 | 3 | 203 | 6.83 | 71 | 65 | 20.2 |
| D | 3 | 31 | 201 | 6.73 | 71 | 65 | 20.2 |
| D | 3 | 14 | 179 | 5.64 | 71 | 65 | 20.2 |
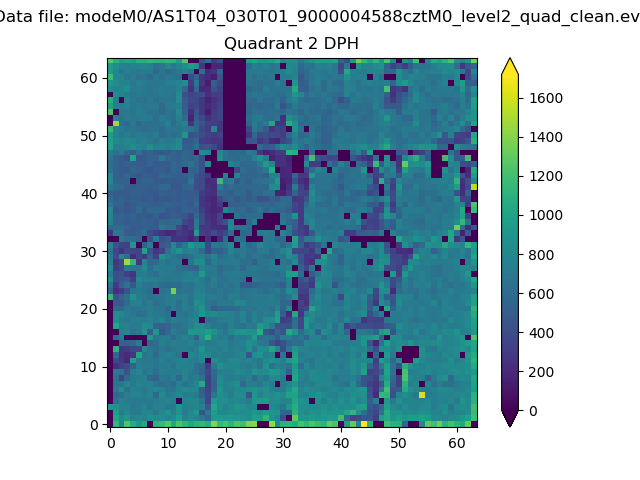
Histogram calculated using DETX and DETY for each event in the final _common_clean file
| Quadrant A | 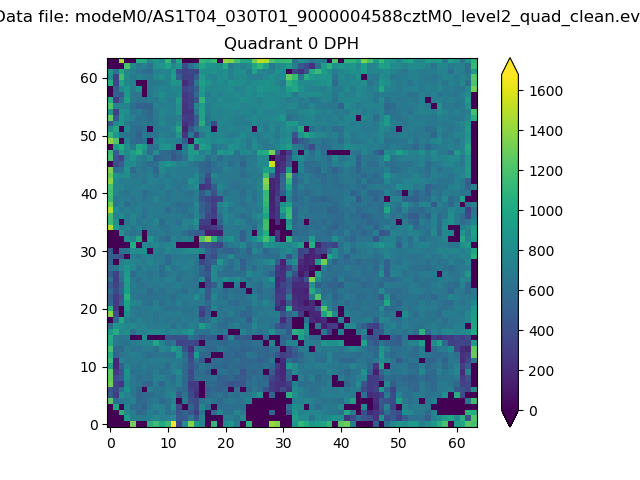 |
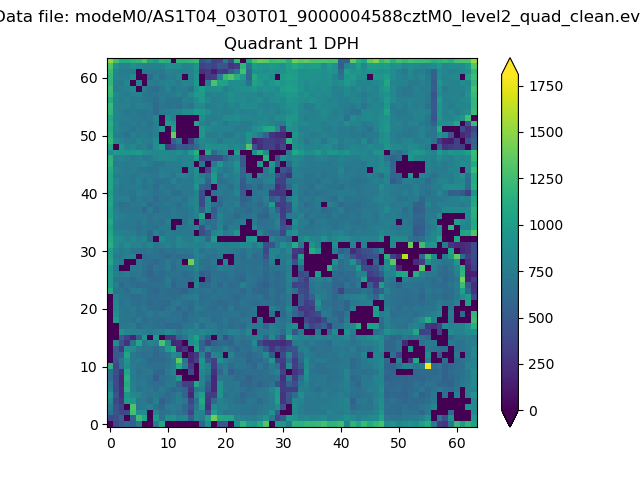 |
Quadrant B |
|---|---|---|---|
| Quadrant D | 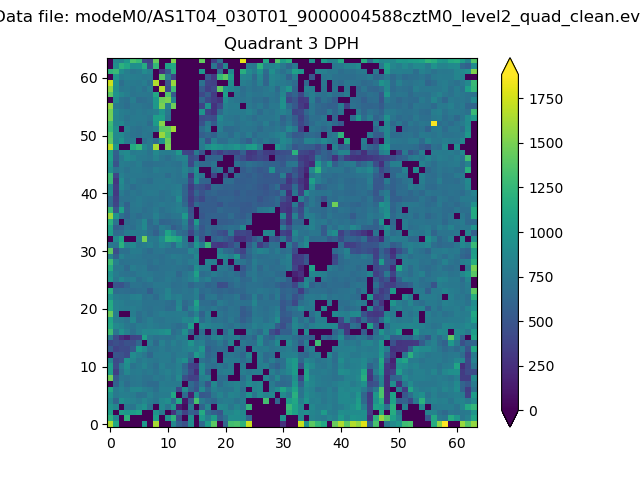 |
 |
Quadrant C |
| Plot type | Count rate plots | Images |
|---|---|---|
| Comparison with Poisson distribution Blue bars denote a histogram of data divided into 1 sec bins. Red curve is a Poisson curve with rate = median count rate of data. |
 |
 |
| Quadrant-wise count rates Data is divided into 100 sec bins |
 |
|
| Module-wise count rates for Quadrant A Data is divided into 100 sec bins |
 |
 |
| Module-wise count rates for Quadrant B Data is divided into 100 sec bins |
 |
 |
| Module-wise count rates for Quadrant C Data is divided into 100 sec bins |
 |
 |
| Module-wise count rates for Quadrant D Data is divided into 100 sec bins |
 |
 |
| Parameter | Plot |
|---|---|
| CZT HV Monitor |  |
| D_VDD |  |
| Temperature 1 |  |
| Veto HV Monitor |  |
| Veto LLD |  |
| Alpha Counter |  |
| _CPM_Rate |  |
| CZT Counter |  |
| +2.5 Volts monitor |  |
| +5 Volts monitor |  |
| _ROLL_ROT |  |
| _Roll_DEC | 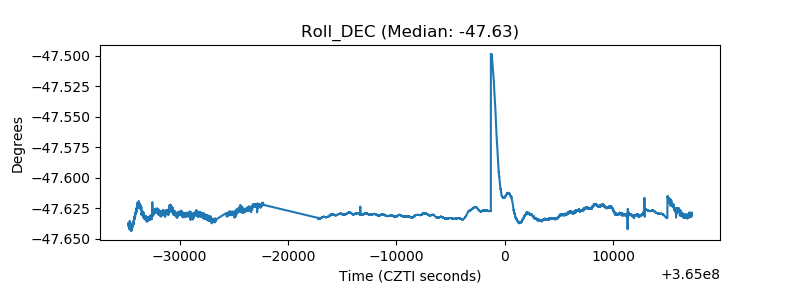 |
| _Roll_RA |  |
| Veto Counter | 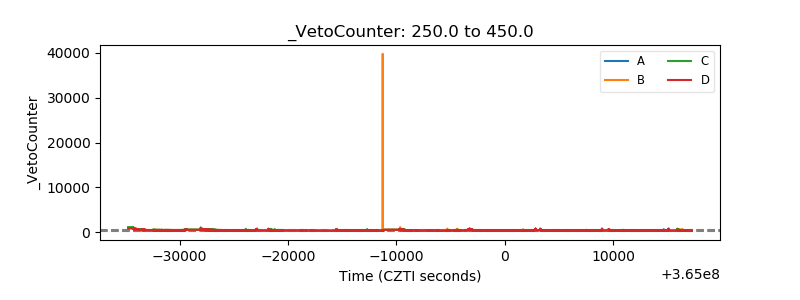 |