| Param | Original file | Final file |
|---|---|---|
| Filename | modeM0/AS1T04_030T01_9000004588_31499cztM0_level2.evt | modeM0/AS1T04_030T01_9000004588_31499cztM0_level2_quad_clean.evt |
| Size (bytes) | 455,757,120 | 68,310,720 |
| Size | 434.6 MB | 65.1 MB |
| Events in quadrant A | 2,804,032 | 437,195 |
| Events in quadrant B | 4,208,249 | 435,817 |
| Events in quadrant C | 3,224,392 | 418,355 |
| Events in quadrant D | 3,212,175 | 411,823 |
| Mode M0 | |||
|---|---|---|---|
| Quadrant | BADHDUFLAG | Total packets | Discarded packets |
| A | 0 | 12195 | 871 |
| B | 0 | 17185 | 1199 |
| C | 0 | 13555 | 826 |
| D | 0 | 13512 | 810 |
| Mode SS | |||
|---|---|---|---|
| Quadrant | BADHDUFLAG | Total packets | Discarded packets |
| A | 0 | 117 | 9 |
| B | 0 | 113 | 5 |
| C | 0 | 112 | 5 |
| D | 0 | 114 | 8 |
| Mode M9 | |||
|---|---|---|---|
| Quadrant | BADHDUFLAG | Total packets | Discarded packets |
| A | 0 | 21 | 3 |
| B | 0 | 19 | 1 |
| C | 0 | 18 | 0 |
| D | 0 | 21 | 3 |
| Quadrant | Total seconds | Saturated seconds | Saturation percentage |
|---|---|---|---|
| A | 5226 | 44 | 0.841944% |
| B | 5199 | 116 | 2.231198% |
| C | 5208 | 192 | 3.686636% |
| D | 5217 | 98 | 1.878474% |
Noise dominated data is calculated using 1-second bins in cleaned event files. If a bin has >2000 counts, and if more than 50% of those come from <1% of pixels, then it is considered to be noise-dominated and hence unusable.
| Quadrant | # 1 sec bins | Bins with >0 counts | Bins with >2000 counts | High rate bins dominated by noise | Noise dominated (total time) | Noise dominated (detector-on time) | Marked lightcurve |
|---|---|---|---|---|---|---|---|
| A | 7623 | 5288 | 1 | 1 | 0.01% | 0.02% | 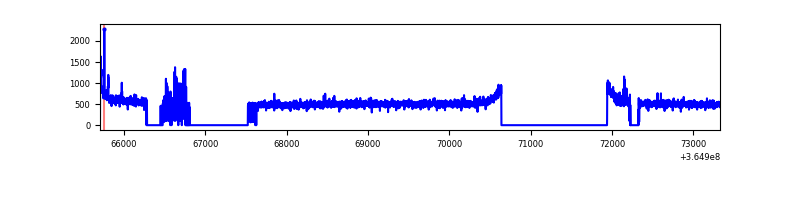 |
| B | 7623 | 5269 | 6 | 6 | 0.08% | 0.11% | 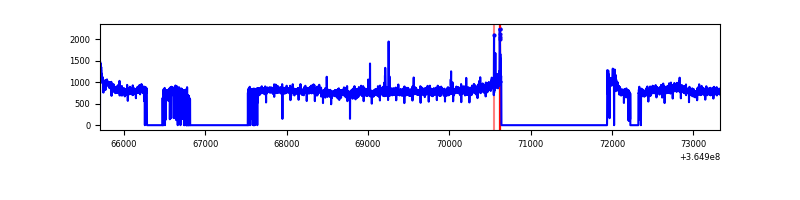 |
| C | 7623 | 5279 | 59 | 59 | 0.77% | 1.12% | 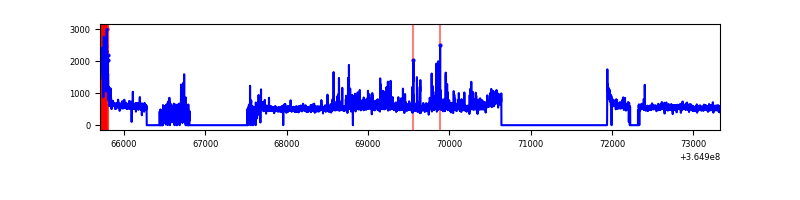 |
| D | 7623 | 5290 | 66 | 66 | 0.87% | 1.25% | 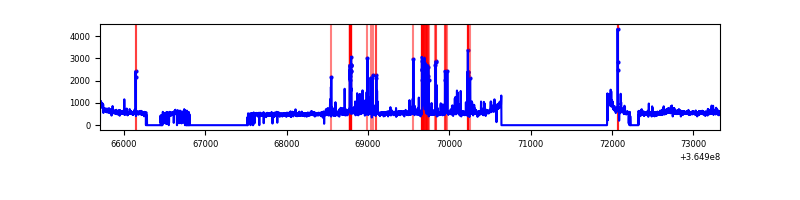 |
Top three noisy pixels from each quadrant. If the there are fewer than three noisy pixels in the level2.evt file, extra rows are filled as -1
| Pixel properties | Quadrant properties | ||||||
|---|---|---|---|---|---|---|---|
| Quadrant | DetID | PixID | Counts | Sigma | Mean | Median | Sigma |
| A | 0 | 13 | 60880 | 428.44 | 708 | 696 | 140.5 |
| A | 14 | 238 | 13943 | 94.3 | 708 | 696 | 140.5 |
| A | 13 | 254 | 9267 | 61.02 | 708 | 696 | 140.5 |
| B | 6 | 159 | 1391001 | 10617.55 | 696 | 680 | 130.9 |
| B | 12 | 1 | 26515 | 197.3 | 696 | 680 | 130.9 |
| B | 4 | 80 | 16170 | 118.29 | 696 | 680 | 130.9 |
| C | 3 | 233 | 253673 | 1629.39 | 675 | 680 | 155.3 |
| C | 0 | 10 | 207424 | 1331.52 | 675 | 680 | 155.3 |
| C | 14 | 238 | 109382 | 700.09 | 675 | 680 | 155.3 |
| D | 8 | 195 | 271756 | 1666.33 | 684 | 666 | 162.7 |
| D | 12 | 233 | 160882 | 984.81 | 684 | 666 | 162.7 |
| D | 2 | 250 | 118259 | 722.82 | 684 | 666 | 162.7 |
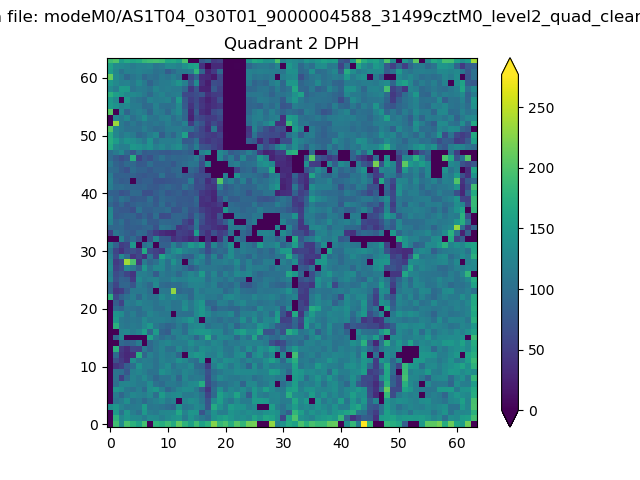
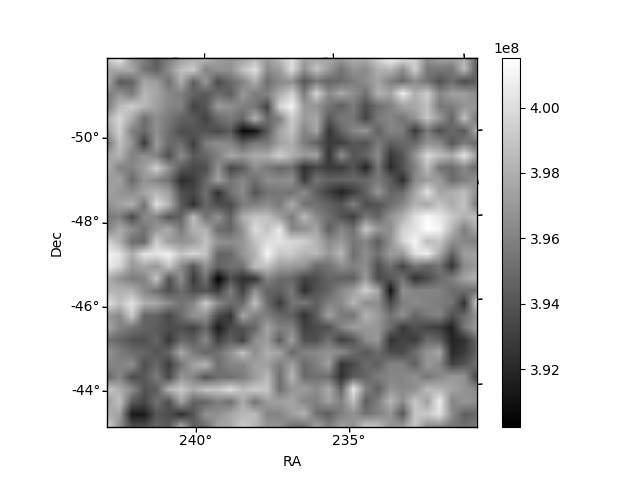
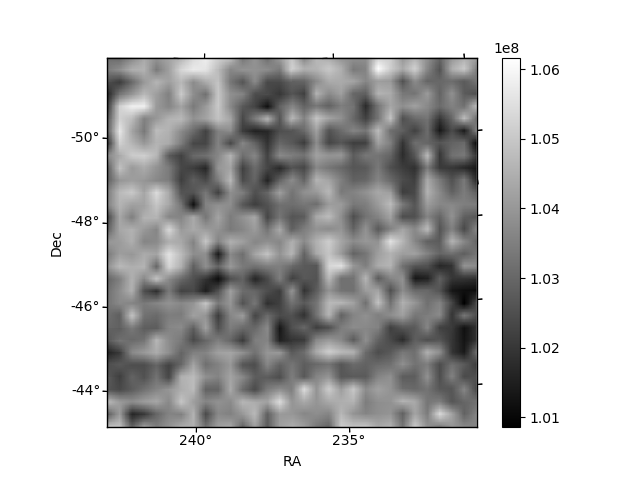
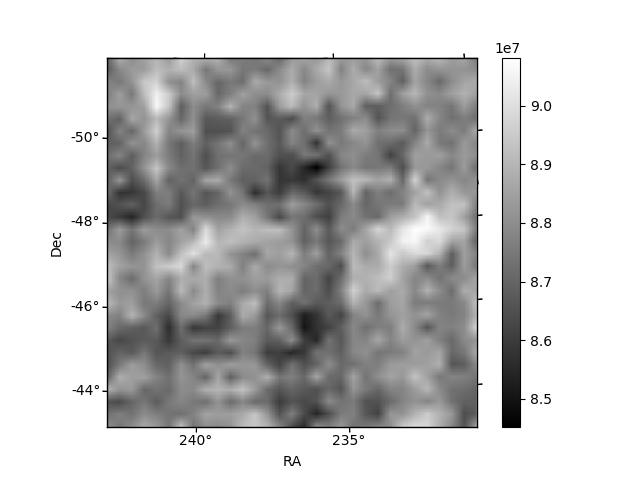
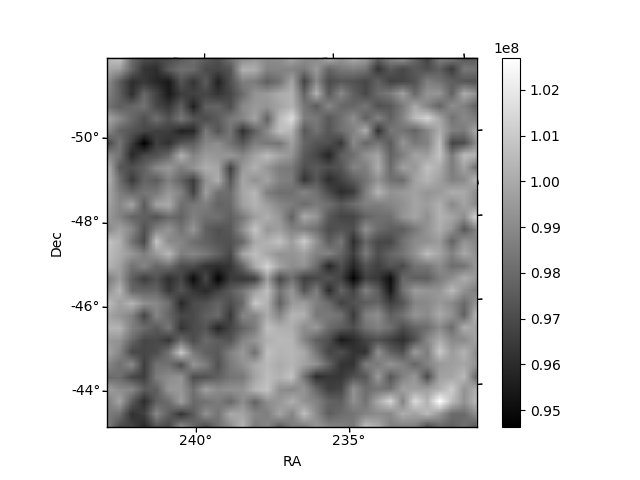
Histogram calculated using DETX and DETY for each event in the final _common_clean file
| Quadrant A | 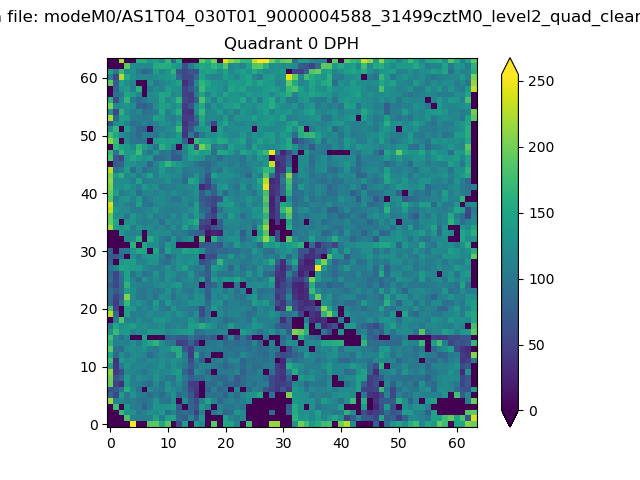 |
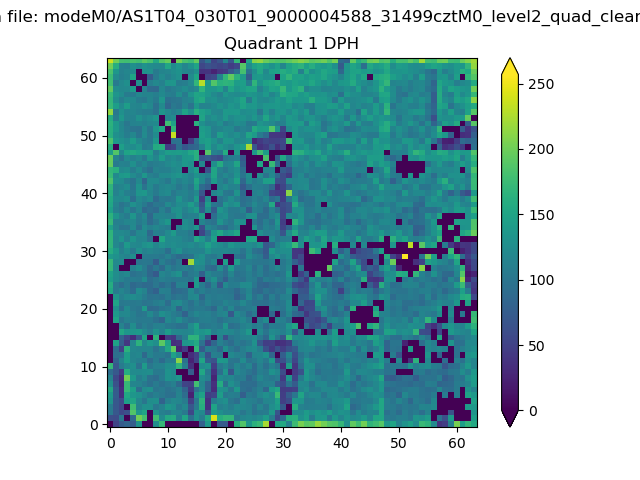 |
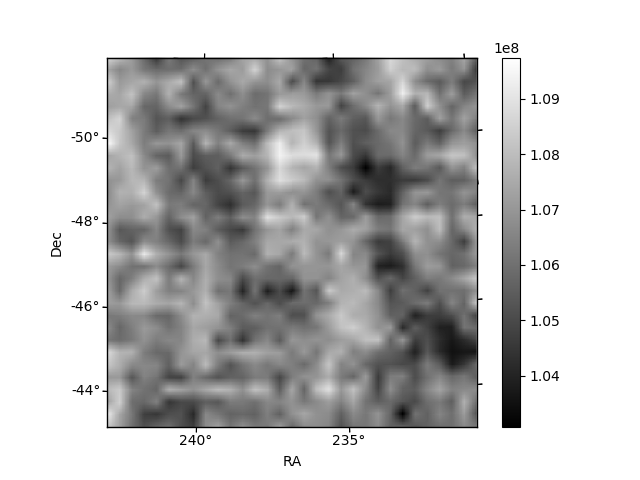
Quadrant B |
|---|---|---|---|
| Quadrant D | 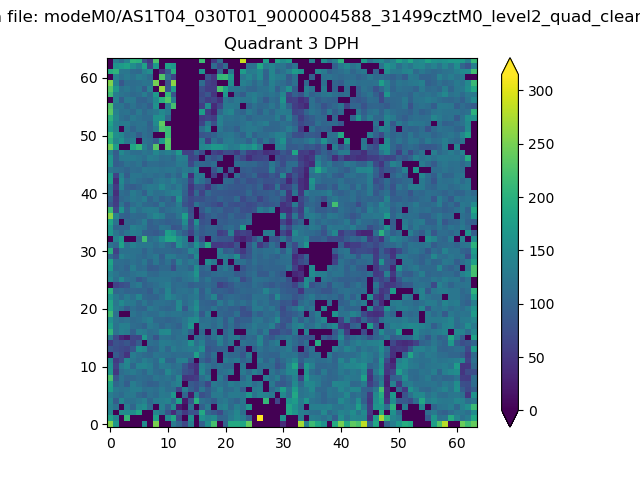 |
 |
Quadrant C |
| Plot type | Count rate plots | Images |
|---|---|---|
| Comparison with Poisson distribution Blue bars denote a histogram of data divided into 1 sec bins. Red curve is a Poisson curve with rate = median count rate of data. |
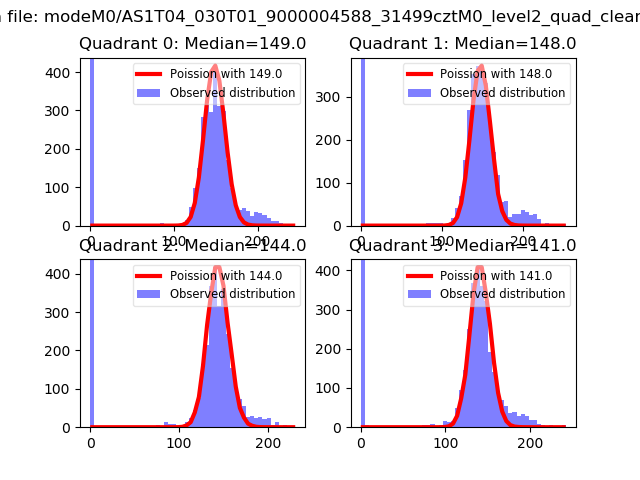 |
 |
| Quadrant-wise count rates Data is divided into 100 sec bins |
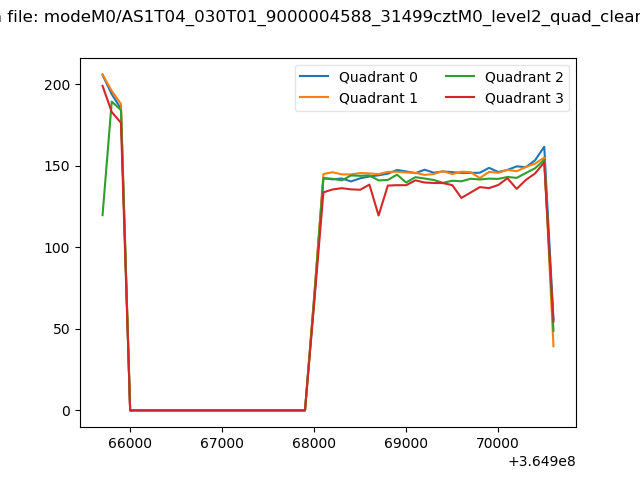 |
|
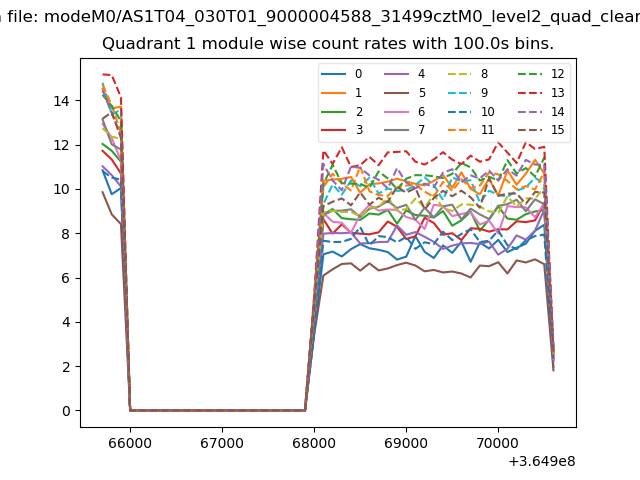
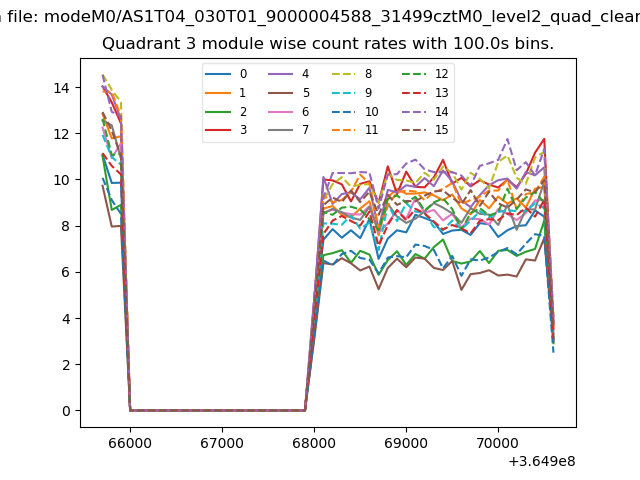
| Module-wise count rates for Quadrant A Data is divided into 100 sec bins |
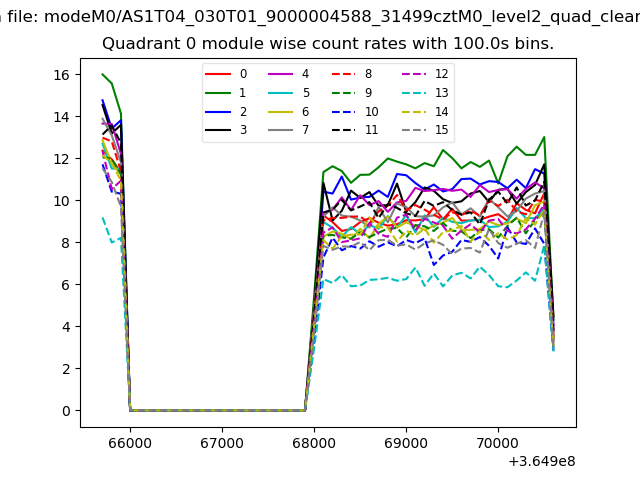 |
 |
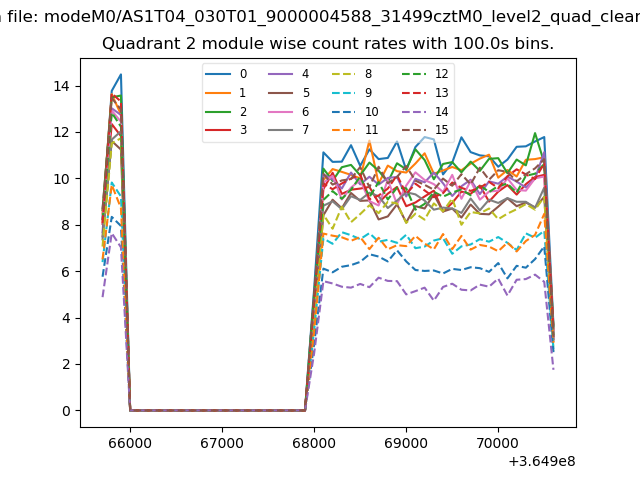
| Module-wise count rates for Quadrant B Data is divided into 100 sec bins |
 |
 |
| Module-wise count rates for Quadrant C Data is divided into 100 sec bins |
 |
 |
| Module-wise count rates for Quadrant D Data is divided into 100 sec bins |
 |
 |
| Parameter | Plot |
|---|---|
| CZT HV Monitor | 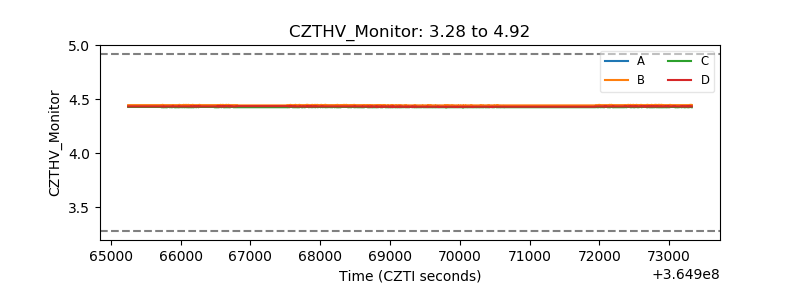 |
| D_VDD | 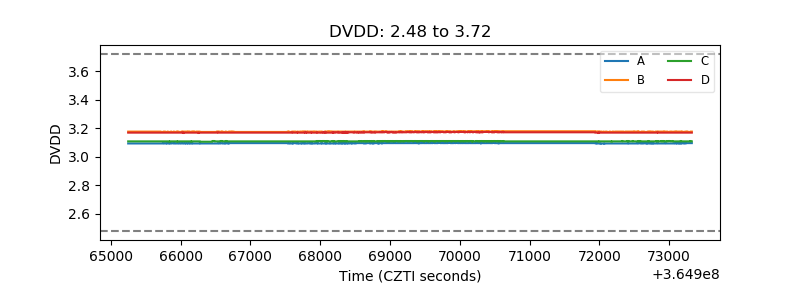 |
| Temperature 1 |  |
| Veto HV Monitor | 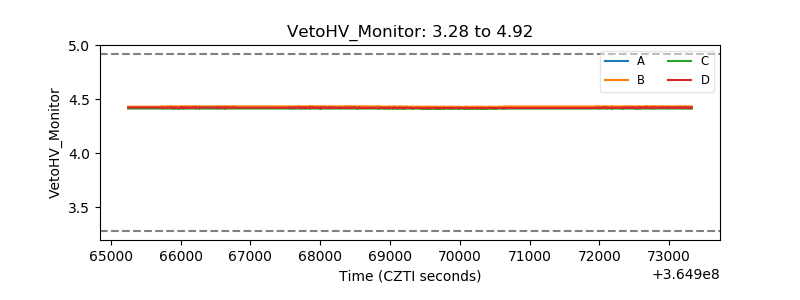 |
| Veto LLD | 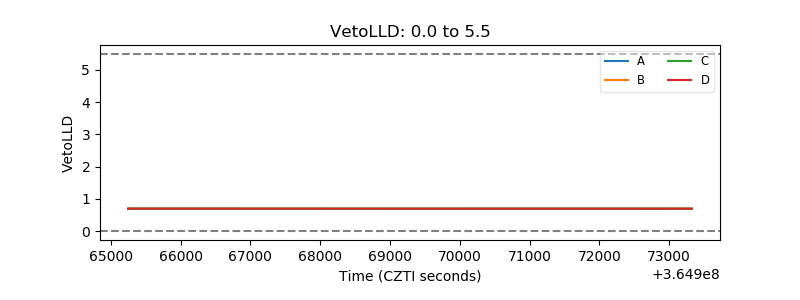 |
| Alpha Counter | 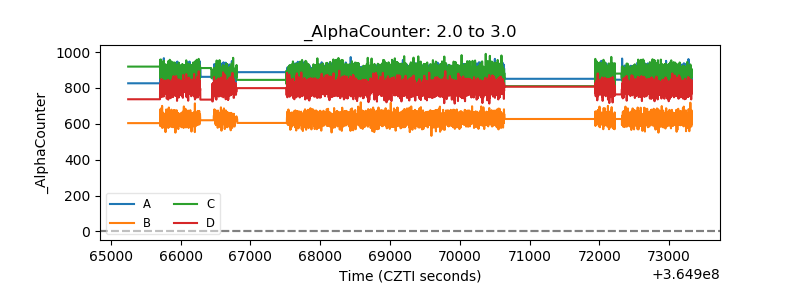 |
| _CPM_Rate | 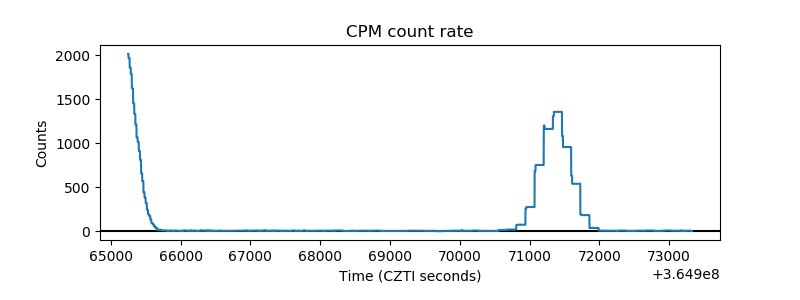 |
| CZT Counter | 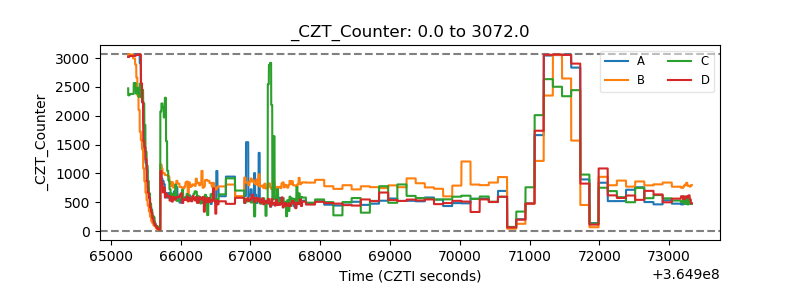 |
| +2.5 Volts monitor |  |
| +5 Volts monitor | 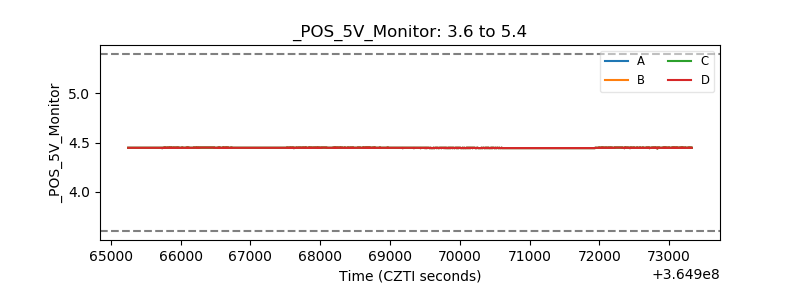 |
| _ROLL_ROT | 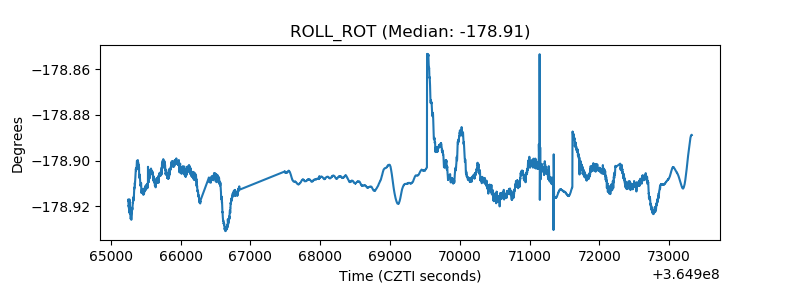 |
| _Roll_DEC | 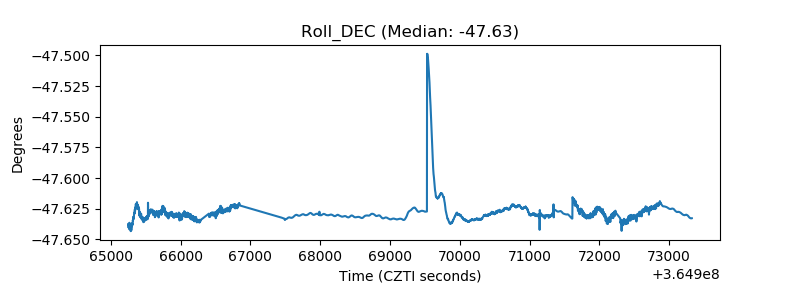 |
| _Roll_RA | 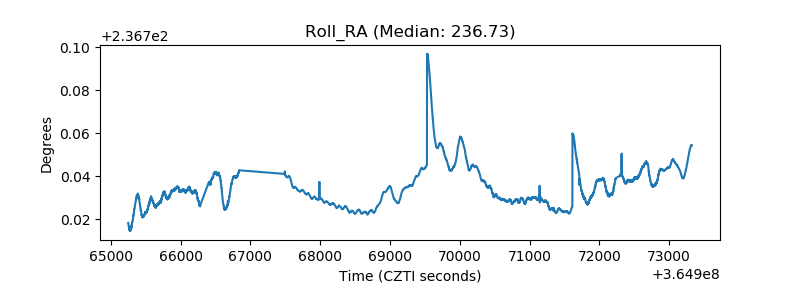 |
| Veto Counter | 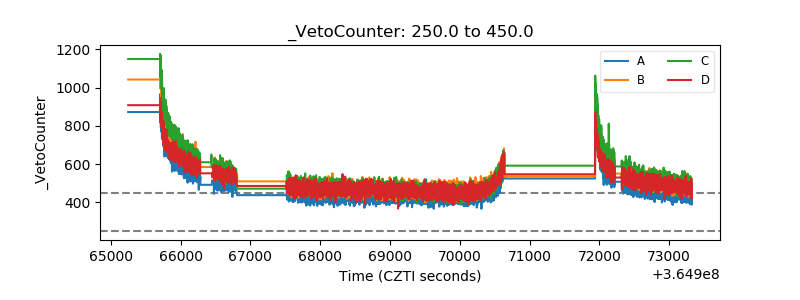 |