| Param | Original file | Final file |
|---|---|---|
| Filename | modeM0/AS1T04_030T01_9000004588_31500cztM0_level2.evt | modeM0/AS1T04_030T01_9000004588_31500cztM0_level2_quad_clean.evt |
| Size (bytes) | 575,737,920 | 72,892,800 |
| Size | 549.1 MB | 69.5 MB |
| Events in quadrant A | 3,556,530 | 445,600 |
| Events in quadrant B | 5,074,873 | 453,470 |
| Events in quadrant C | 4,088,174 | 439,365 |
| Events in quadrant D | 4,290,853 | 429,215 |
| Mode M0 | |||
|---|---|---|---|
| Quadrant | BADHDUFLAG | Total packets | Discarded packets |
| A | 0 | 14270 | 1 |
| B | 0 | 19404 | 1 |
| C | 0 | 15760 | 1 |
| D | 0 | 16684 | 1 |
| Mode SS | |||
|---|---|---|---|
| Quadrant | BADHDUFLAG | Total packets | Discarded packets |
| A | 0 | 126 | 0 |
| B | 0 | 126 | 0 |
| C | 0 | 126 | 0 |
| D | 0 | 126 | 0 |
| Mode M9 | |||
|---|---|---|---|
| Quadrant | BADHDUFLAG | Total packets | Discarded packets |
| A | 0 | 11 | 0 |
| B | 0 | 11 | 0 |
| C | 0 | 11 | 0 |
| D | 0 | 11 | 0 |
| Quadrant | Total seconds | Saturated seconds | Saturation percentage |
|---|---|---|---|
| A | 6301 | 210 | 3.332804% |
| B | 6301 | 154 | 2.444056% |
| C | 6301 | 288 | 4.570703% |
| D | 6301 | 234 | 3.713696% |
Noise dominated data is calculated using 1-second bins in cleaned event files. If a bin has >2000 counts, and if more than 50% of those come from <1% of pixels, then it is considered to be noise-dominated and hence unusable.
| Quadrant | # 1 sec bins | Bins with >0 counts | Bins with >2000 counts | High rate bins dominated by noise | Noise dominated (total time) | Noise dominated (detector-on time) | Marked lightcurve |
|---|---|---|---|---|---|---|---|
| A | 7346 | 6301 | 98 | 98 | 1.33% | 1.56% | 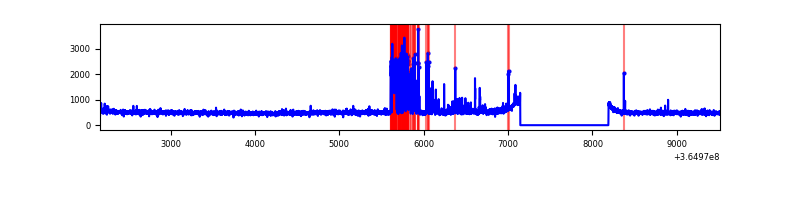 |
| B | 7346 | 6301 | 12 | 12 | 0.16% | 0.19% | 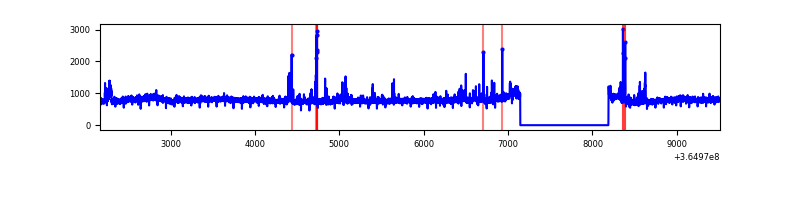 |
| C | 7346 | 6301 | 83 | 83 | 1.13% | 1.32% |  |
| D | 7346 | 6301 | 151 | 151 | 2.06% | 2.40% | 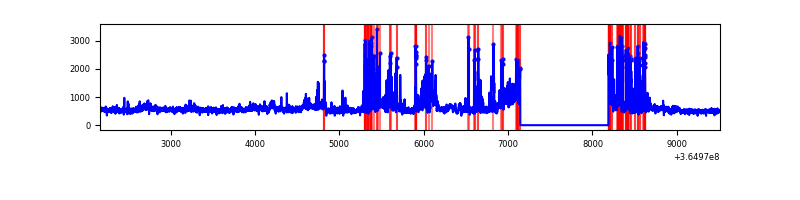 |
Top three noisy pixels from each quadrant. If the there are fewer than three noisy pixels in the level2.evt file, extra rows are filled as -1
| Pixel properties | Quadrant properties | ||||||
|---|---|---|---|---|---|---|---|
| Quadrant | DetID | PixID | Counts | Sigma | Mean | Median | Sigma |
| A | 0 | 13 | 461794 | 2888.55 | 801 | 784 | 159.6 |
| A | 13 | 254 | 11815 | 69.12 | 801 | 784 | 159.6 |
| A | 3 | 137 | 7970 | 45.03 | 801 | 784 | 159.6 |
| B | 6 | 159 | 1714423 | 11215.73 | 803 | 782 | 152.8 |
| B | 0 | 190 | 76948 | 498.5 | 803 | 782 | 152.8 |
| B | 4 | 80 | 31634 | 201.93 | 803 | 782 | 152.8 |
| C | 3 | 233 | 896130 | 4983.16 | 777 | 781 | 179.7 |
| C | 14 | 238 | 126727 | 700.97 | 777 | 781 | 179.7 |
| C | 2 | 114 | 14355 | 75.55 | 777 | 781 | 179.7 |
| D | 12 | 218 | 659417 | 3579.01 | 772 | 752 | 184.0 |
| D | 8 | 195 | 495207 | 2686.73 | 772 | 752 | 184.0 |
| D | 13 | 249 | 92842 | 500.39 | 772 | 752 | 184.0 |
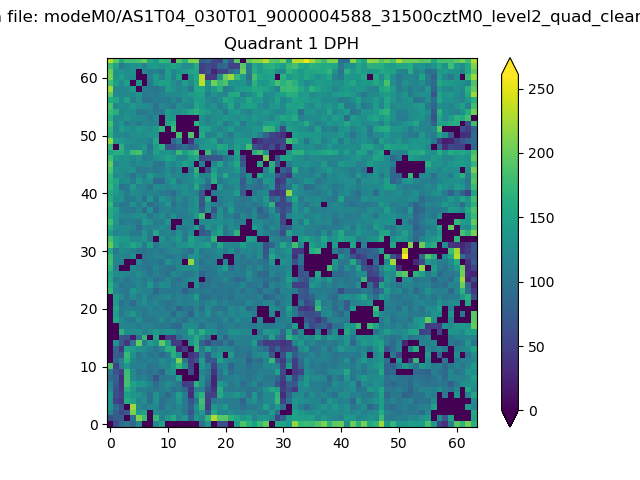
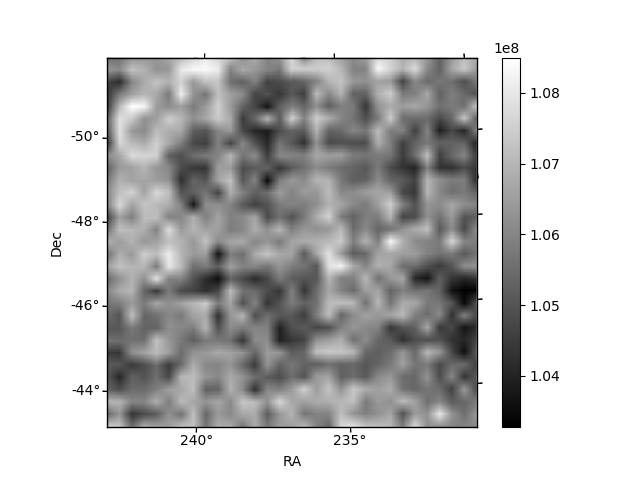
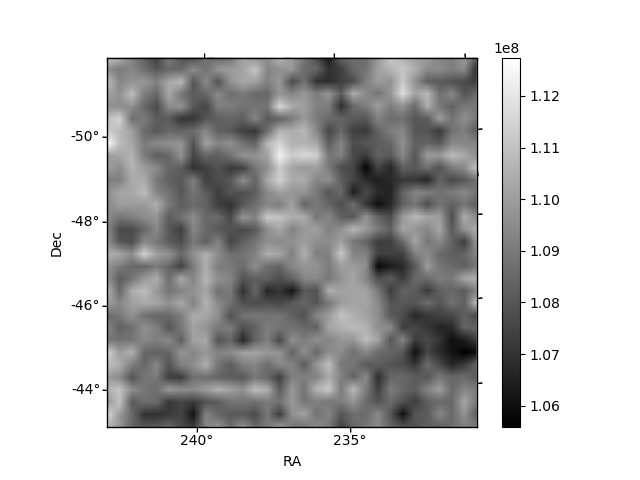
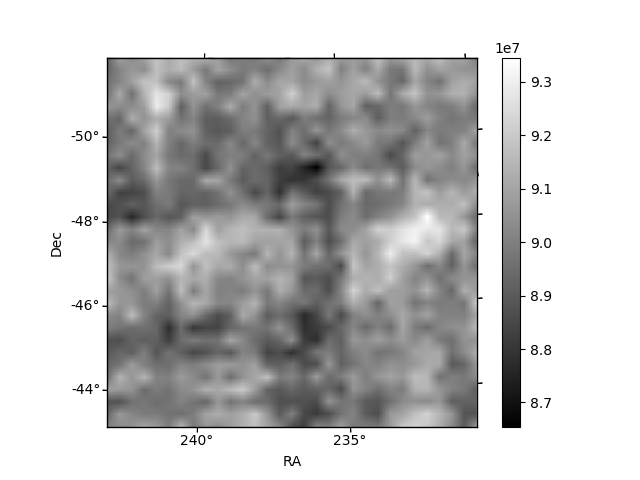
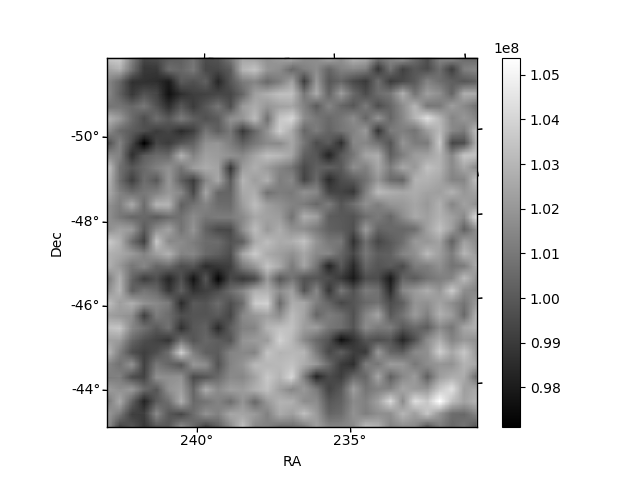
Histogram calculated using DETX and DETY for each event in the final _common_clean file
| Quadrant A |  |
 |
Quadrant B |
|---|---|---|---|
| Quadrant D | 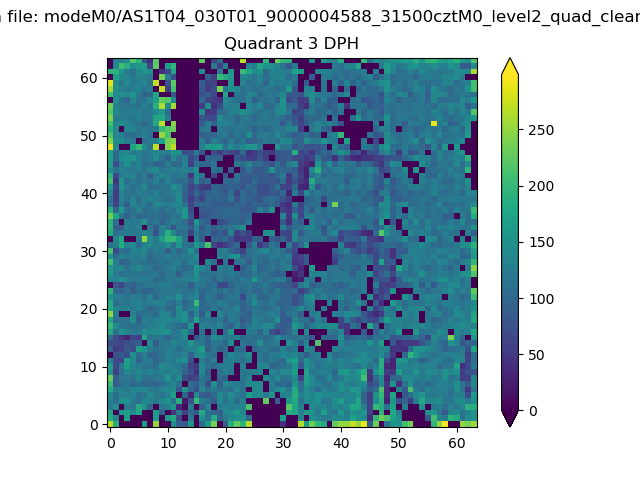 |
 |
Quadrant C |
| Plot type | Count rate plots | Images |
|---|---|---|
| Comparison with Poisson distribution Blue bars denote a histogram of data divided into 1 sec bins. Red curve is a Poisson curve with rate = median count rate of data. |
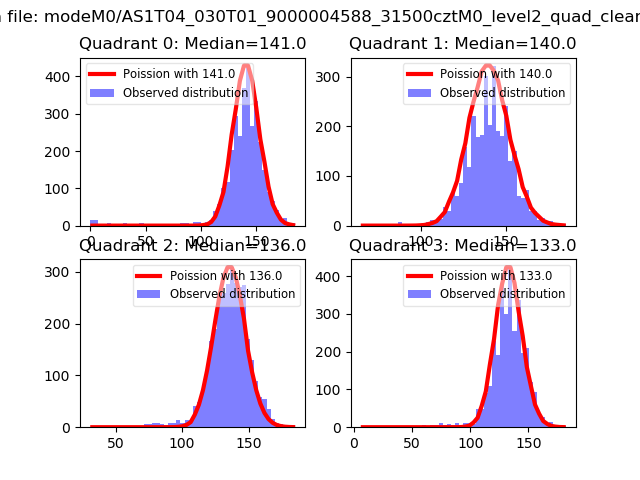 |
 |
| Quadrant-wise count rates Data is divided into 100 sec bins |
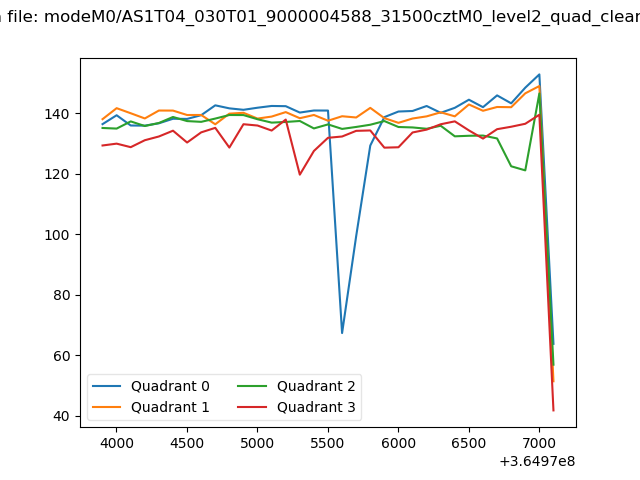 |
|
| Module-wise count rates for Quadrant A Data is divided into 100 sec bins |
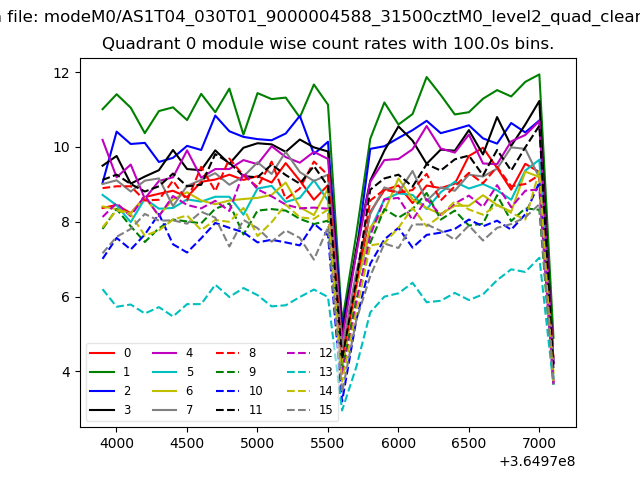 |
 |
| Module-wise count rates for Quadrant B Data is divided into 100 sec bins |
 |
 |
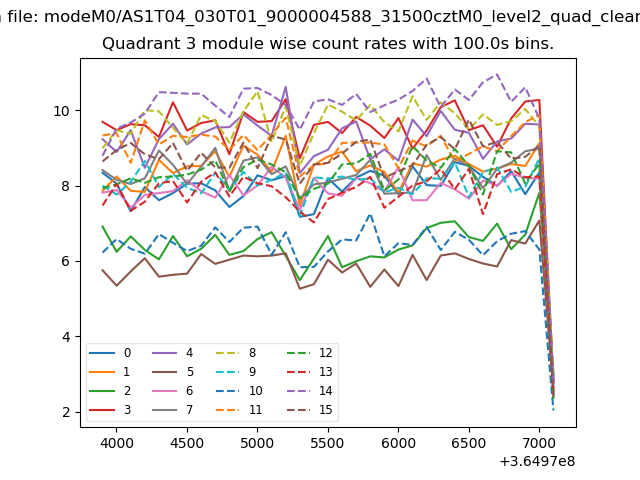
| Module-wise count rates for Quadrant C Data is divided into 100 sec bins |
 |
 |
| Module-wise count rates for Quadrant D Data is divided into 100 sec bins |
 |
 |
| Parameter | Plot |
|---|---|
| CZT HV Monitor |  |
| D_VDD | 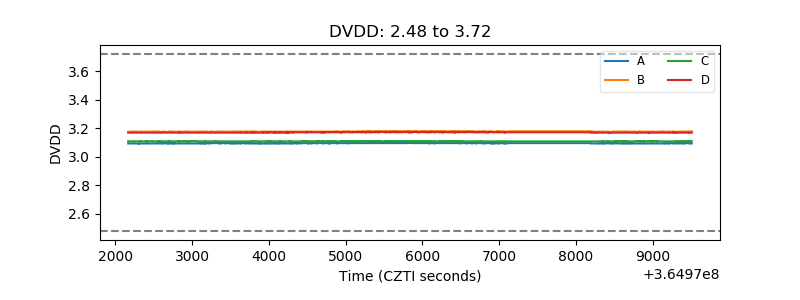 |
| Temperature 1 | 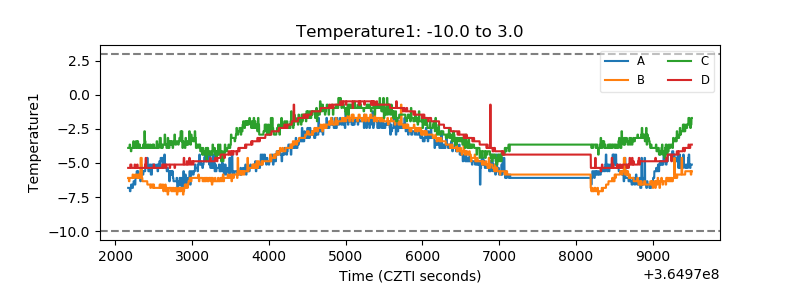 |
| Veto HV Monitor | 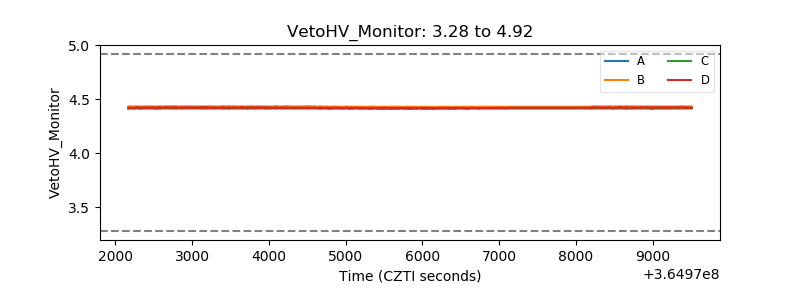 |
| Veto LLD | 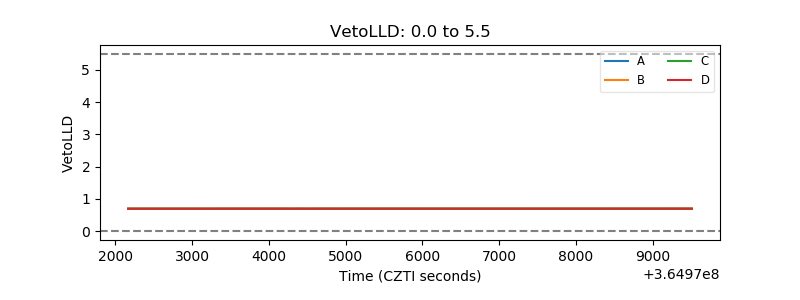 |
| Alpha Counter |  |
| _CPM_Rate | 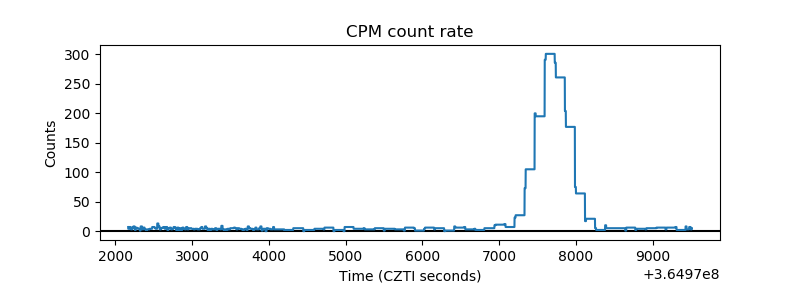 |
| CZT Counter | 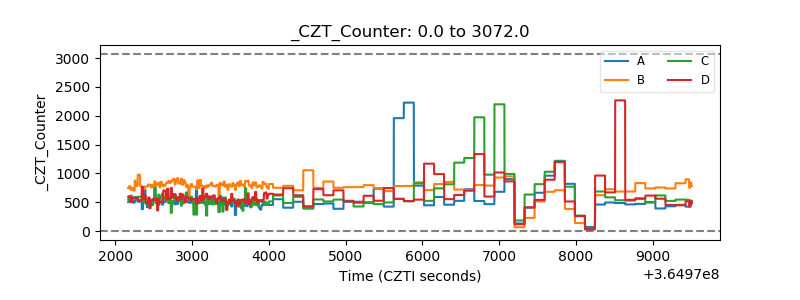 |
| +2.5 Volts monitor |  |
| +5 Volts monitor | 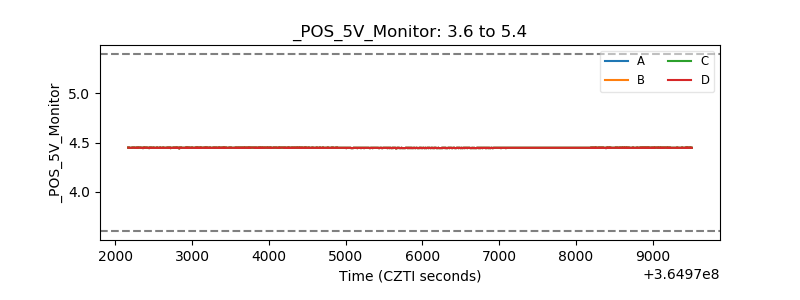 |
| _ROLL_ROT | 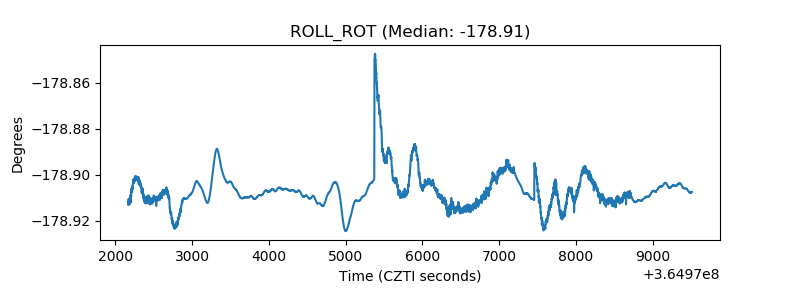 |
| _Roll_DEC | 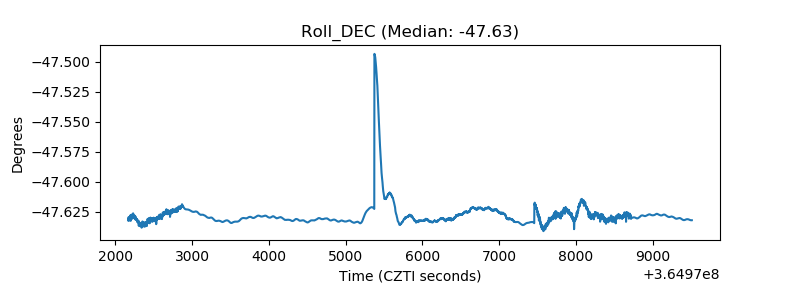 |
| _Roll_RA | 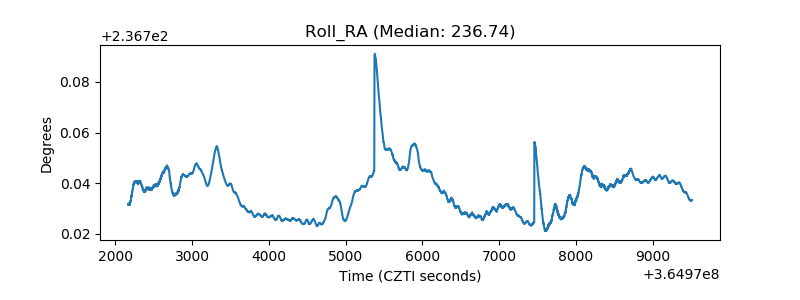 |
| Veto Counter | 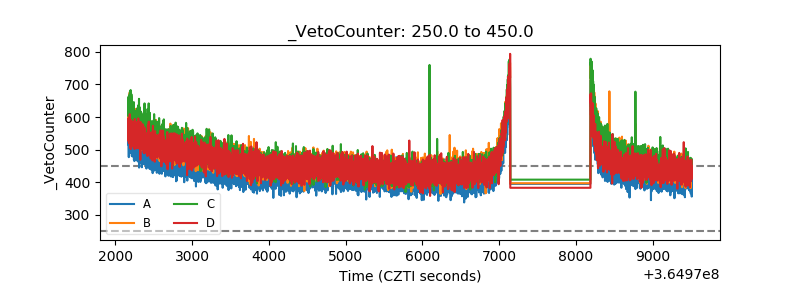 |