| Param | Original file | Final file |
|---|---|---|
| Filename | modeM0/AS1T04_030T01_9000004588_31503cztM0_level2.evt | modeM0/AS1T04_030T01_9000004588_31503cztM0_level2_quad_clean.evt |
| Size (bytes) | 698,474,880 | 86,970,240 |
| Size | 666.1 MB | 82.9 MB |
| Events in quadrant A | 3,901,089 | 580,493 |
| Events in quadrant B | 5,498,382 | 536,271 |
| Events in quadrant C | 6,367,924 | 499,692 |
| Events in quadrant D | 4,902,641 | 519,307 |
| Mode M0 | |||
|---|---|---|---|
| Quadrant | BADHDUFLAG | Total packets | Discarded packets |
| A | 0 | 34121 | 17915 |
| B | 0 | 47020 | 25691 |
| C | 0 | 45359 | 21718 |
| D | 0 | 40409 | 21105 |
| Mode SS | |||
|---|---|---|---|
| Quadrant | BADHDUFLAG | Total packets | Discarded packets |
| A | 0 | 319 | 175 |
| B | 0 | 310 | 158 |
| C | 0 | 319 | 169 |
| D | 0 | 321 | 171 |
| Mode M9 | |||
|---|---|---|---|
| Quadrant | BADHDUFLAG | Total packets | Discarded packets |
| A | 0 | 10 | 5 |
| B | 0 | 8 | 3 |
| C | 0 | 8 | 3 |
| D | 0 | 7 | 2 |
| Quadrant | Total seconds | Saturated seconds | Saturation percentage |
|---|---|---|---|
| A | 7350 | 255 | 3.469388% |
| B | 6933 | 357 | 5.149286% |
| C | 7088 | 1093 | 15.420429% |
| D | 7112 | 315 | 4.429134% |
Noise dominated data is calculated using 1-second bins in cleaned event files. If a bin has >2000 counts, and if more than 50% of those come from <1% of pixels, then it is considered to be noise-dominated and hence unusable.
| Quadrant | # 1 sec bins | Bins with >0 counts | Bins with >2000 counts | High rate bins dominated by noise | Noise dominated (total time) | Noise dominated (detector-on time) | Marked lightcurve |
|---|---|---|---|---|---|---|---|
| A | 19534 | 8047 | 27 | 27 | 0.14% | 0.34% | 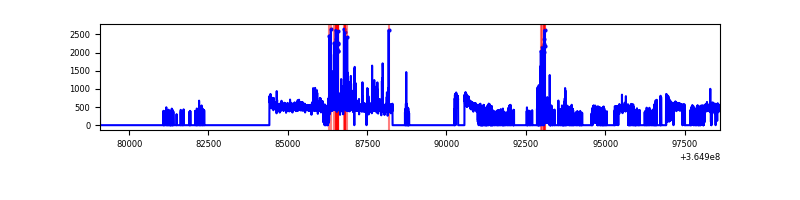 |
| B | 17388 | 7534 | 24 | 24 | 0.14% | 0.32% | 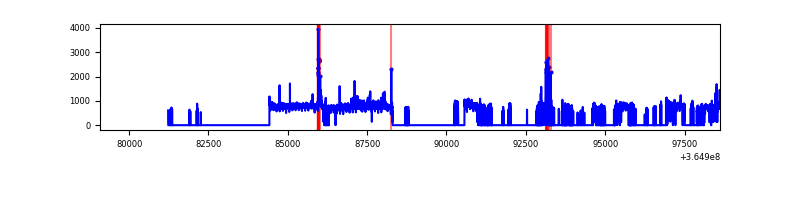 |
| C | 19530 | 7758 | 544 | 544 | 2.79% | 7.01% | 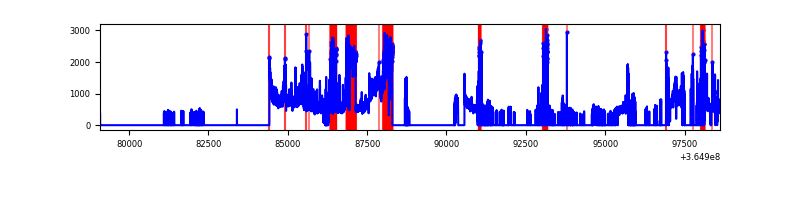 |
| D | 17582 | 7768 | 115 | 115 | 0.65% | 1.48% | 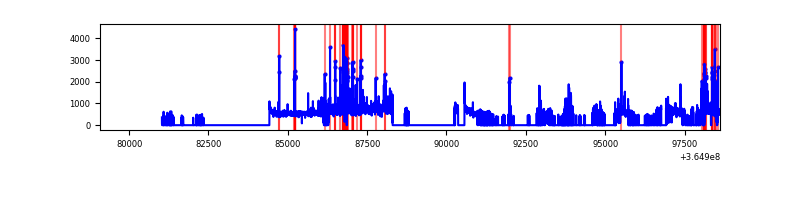 |
Top three noisy pixels from each quadrant. If the there are fewer than three noisy pixels in the level2.evt file, extra rows are filled as -1
| Pixel properties | Quadrant properties | ||||||
|---|---|---|---|---|---|---|---|
| Quadrant | DetID | PixID | Counts | Sigma | Mean | Median | Sigma |
| A | 0 | 13 | 380889 | 2053.1 | 913 | 892 | 185.1 |
| A | 13 | 254 | 12804 | 64.36 | 913 | 892 | 185.1 |
| A | 3 | 137 | 9537 | 46.71 | 913 | 892 | 185.1 |
| B | 6 | 159 | 1891552 | 11579.05 | 845 | 822 | 163.3 |
| B | 5 | 172 | 56332 | 339.95 | 845 | 822 | 163.3 |
| B | 4 | 80 | 47830 | 287.88 | 845 | 822 | 163.3 |
| C | 3 | 233 | 2173005 | 11446.3 | 804 | 806 | 189.8 |
| C | 10 | 22 | 883160 | 4649.52 | 804 | 806 | 189.8 |
| C | 14 | 238 | 129305 | 677.12 | 804 | 806 | 189.8 |
| D | 8 | 195 | 999539 | 4885.49 | 853 | 826 | 204.4 |
| D | 12 | 218 | 317092 | 1547.11 | 853 | 826 | 204.4 |
| D | 12 | 233 | 95549 | 463.37 | 853 | 826 | 204.4 |
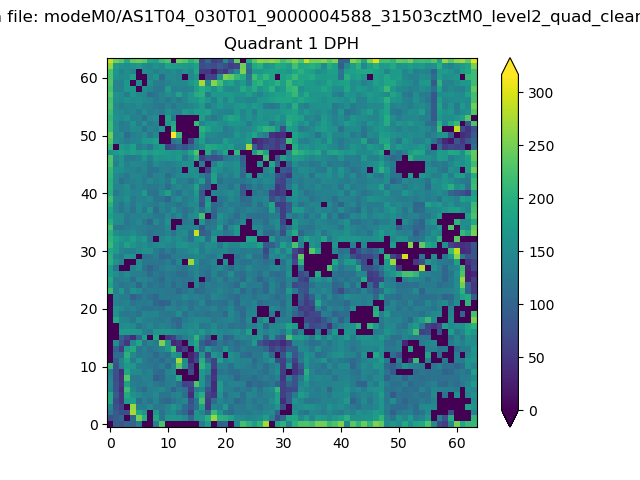
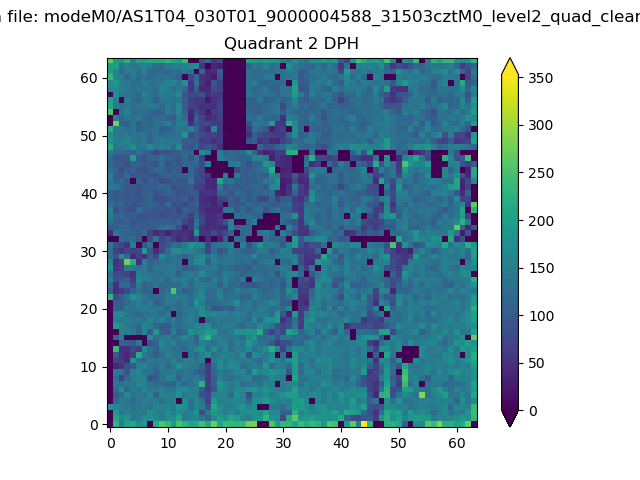
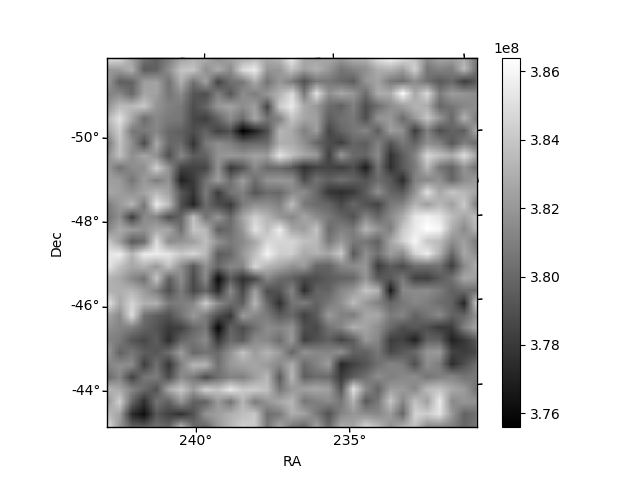
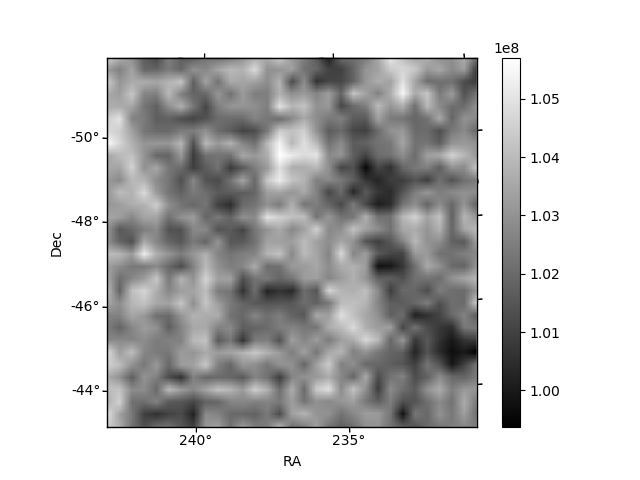
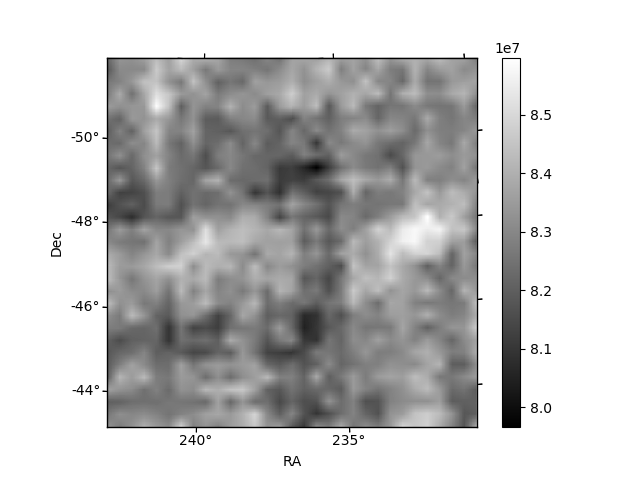
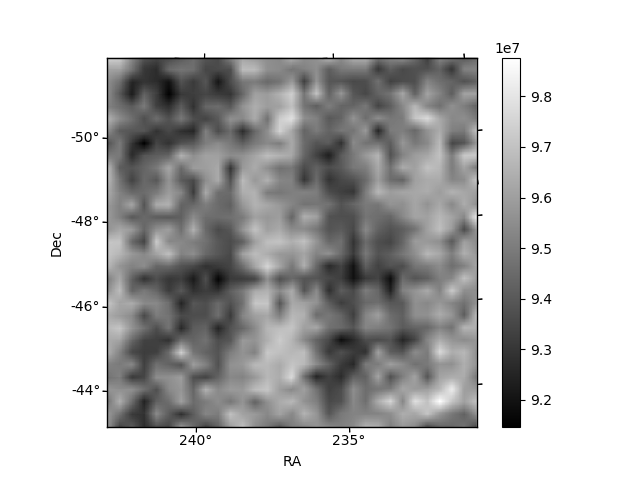
Histogram calculated using DETX and DETY for each event in the final _common_clean file
| Quadrant A |  |
 |
Quadrant B |
|---|---|---|---|
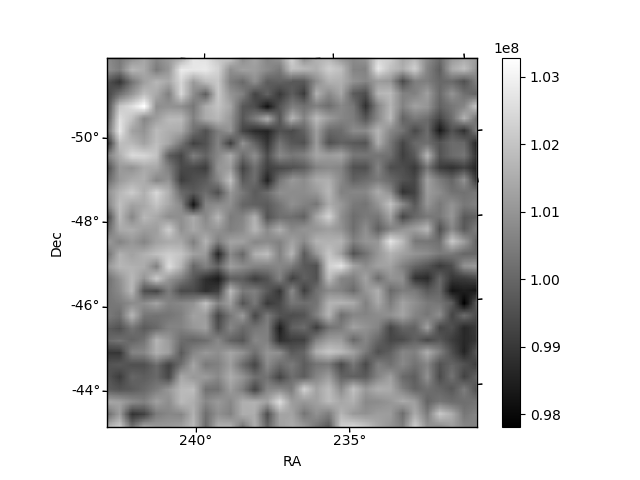
| Quadrant D | 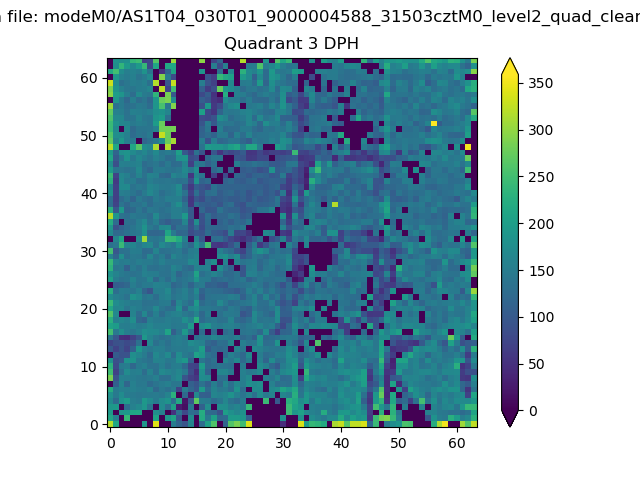 |
 |
Quadrant C |
| Plot type | Count rate plots | Images |
|---|---|---|
| Comparison with Poisson distribution Blue bars denote a histogram of data divided into 1 sec bins. Red curve is a Poisson curve with rate = median count rate of data. |
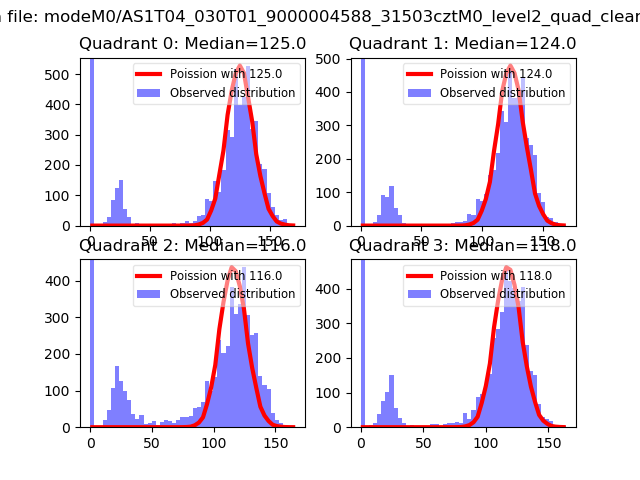 |
 |
| Quadrant-wise count rates Data is divided into 100 sec bins |
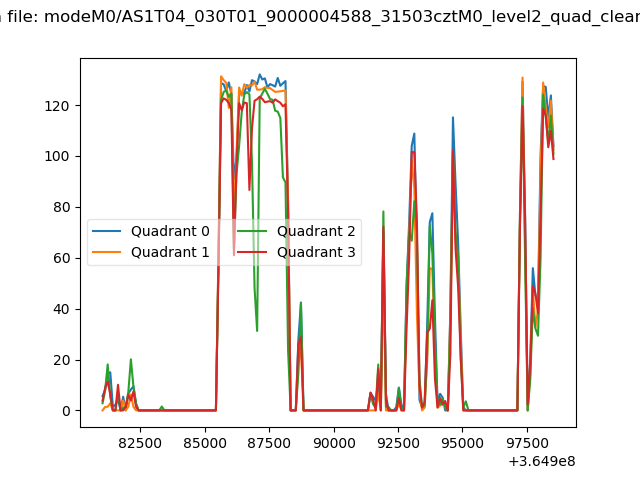 |
|
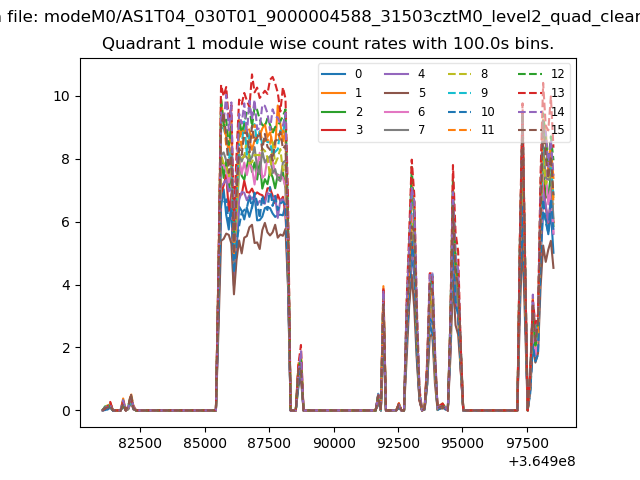
| Module-wise count rates for Quadrant A Data is divided into 100 sec bins |
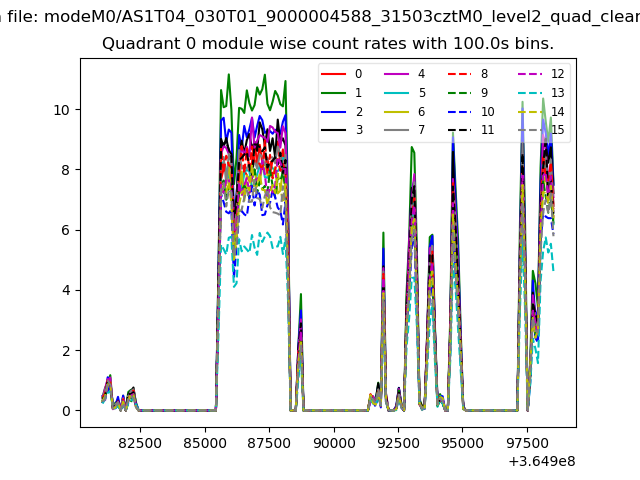 |
 |
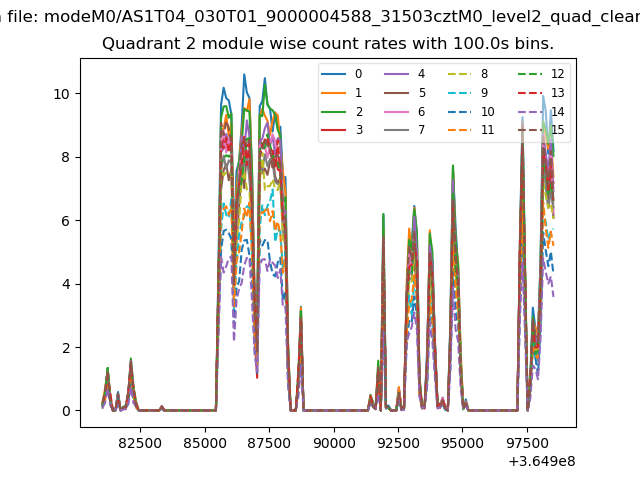
| Module-wise count rates for Quadrant B Data is divided into 100 sec bins |
 |
 |
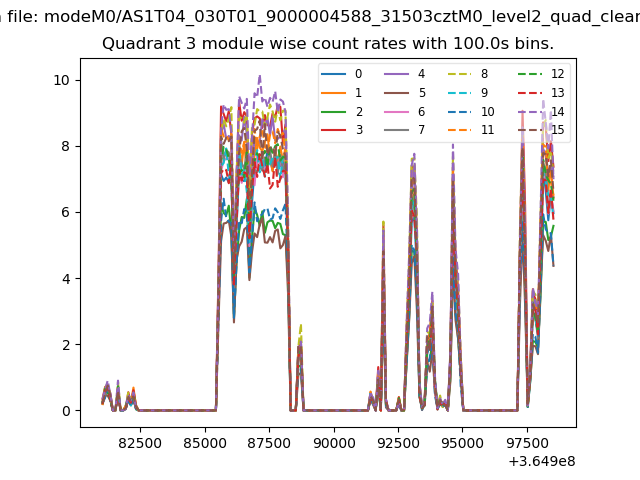
| Module-wise count rates for Quadrant C Data is divided into 100 sec bins |
 |
 |
| Module-wise count rates for Quadrant D Data is divided into 100 sec bins |
 |
 |
| Parameter | Plot |
|---|---|
| CZT HV Monitor | 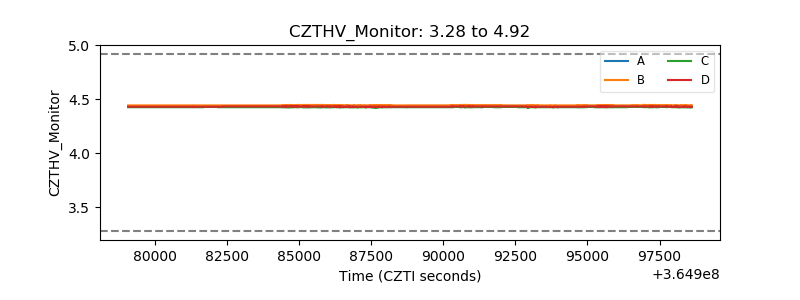 |
| D_VDD | 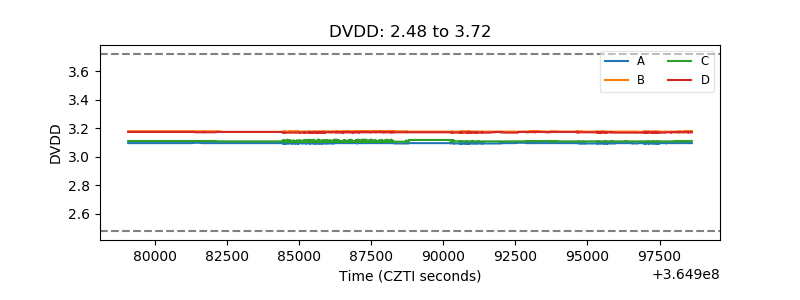 |
| Temperature 1 | 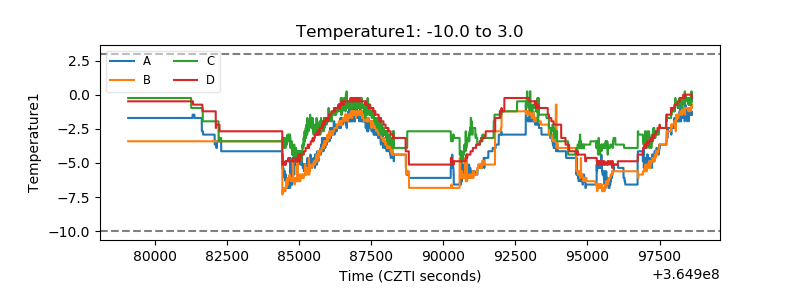 |
| Veto HV Monitor | 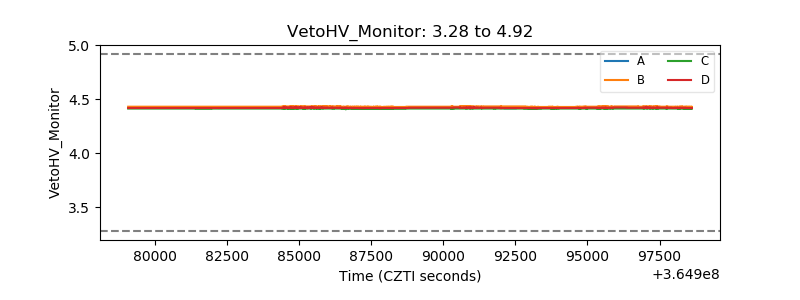 |
| Veto LLD | 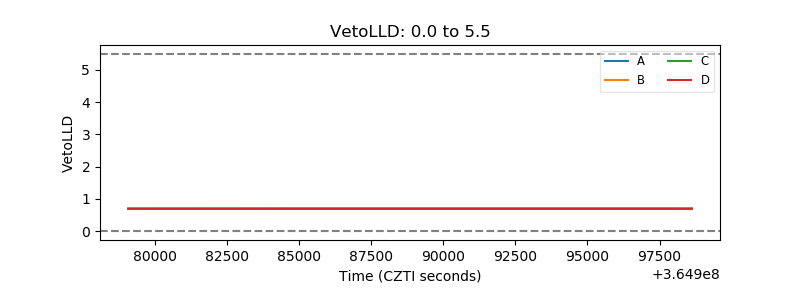 |
| Alpha Counter |  |
| _CPM_Rate | 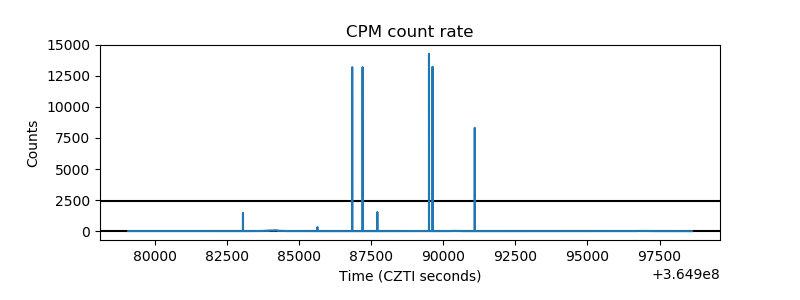 |
| CZT Counter | 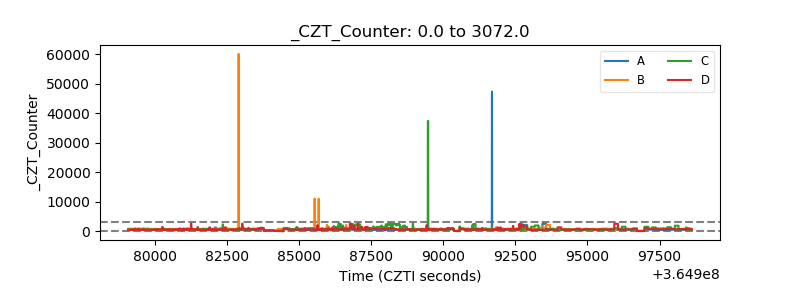 |
| +2.5 Volts monitor |  |
| +5 Volts monitor | 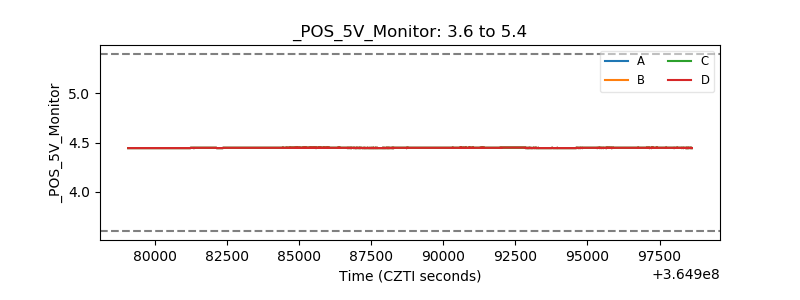 |
| _ROLL_ROT | 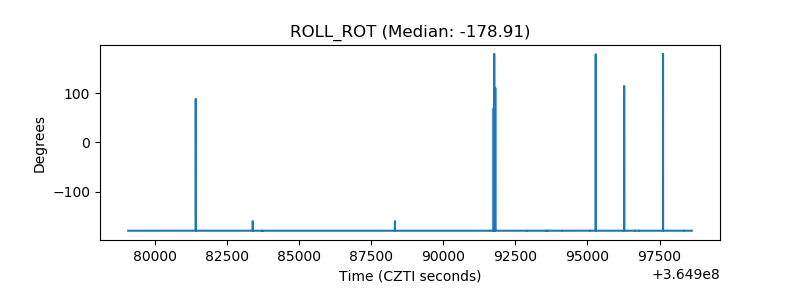 |
| _Roll_DEC | 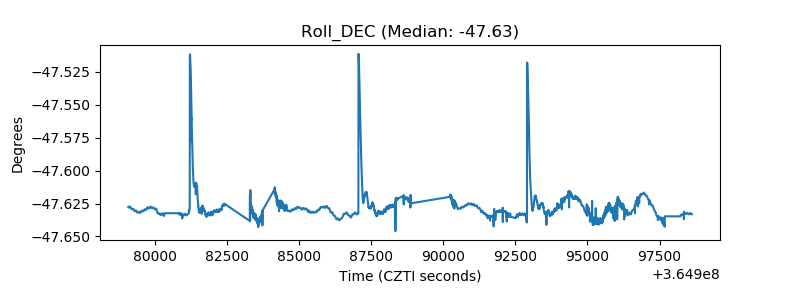 |
| _Roll_RA | 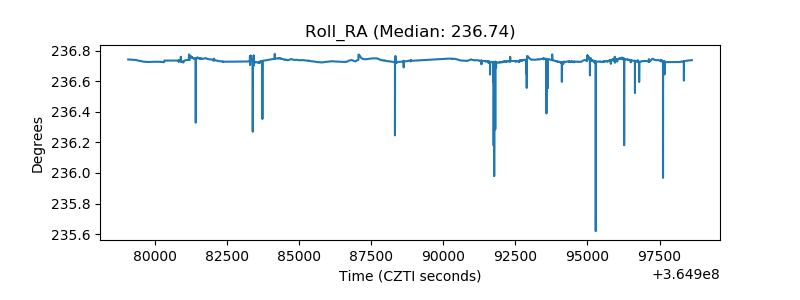 |
| Veto Counter | 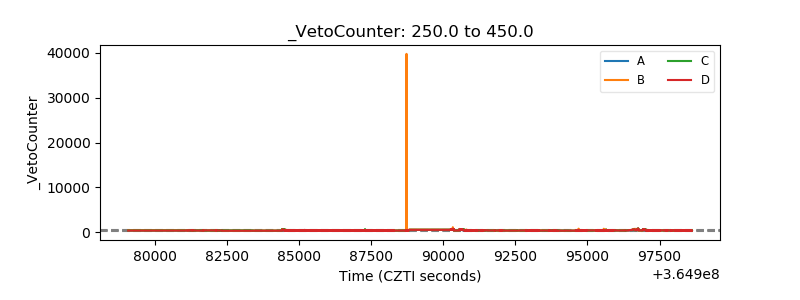 |