| Param | Original file | Final file |
|---|---|---|
| Filename | modeM0/AS1T04_030T01_9000004588_31507cztM0_level2.evt | modeM0/AS1T04_030T01_9000004588_31507cztM0_level2_quad_clean.evt |
| Size (bytes) | 2,042,303,040 | 215,222,400 |
| Size | 1.9 GB | 205.3 MB |
| Events in quadrant A | 17,914,333 | 1,184,470 |
| Events in quadrant B | 14,093,218 | 1,451,079 |
| Events in quadrant C | 17,146,178 | 1,288,409 |
| Events in quadrant D | 11,519,917 | 1,383,380 |
| Mode M0 | |||
|---|---|---|---|
| Quadrant | BADHDUFLAG | Total packets | Discarded packets |
| A | 0 | 65015 | 3 |
| B | 0 | 54804 | 3 |
| C | 0 | 62564 | 3 |
| D | 0 | 45726 | 3 |
| Mode SS | |||
|---|---|---|---|
| Quadrant | BADHDUFLAG | Total packets | Discarded packets |
| A | 0 | 356 | 0 |
| B | 0 | 356 | 0 |
| C | 0 | 356 | 0 |
| D | 0 | 356 | 0 |
| Mode M9 | |||
|---|---|---|---|
| Quadrant | BADHDUFLAG | Total packets | Discarded packets |
| A | 0 | 18 | 0 |
| B | 0 | 18 | 0 |
| C | 0 | 18 | 0 |
| D | 0 | 18 | 0 |
| Quadrant | Total seconds | Saturated seconds | Saturation percentage |
|---|---|---|---|
| A | 17529 | 4632 | 26.424782% |
| B | 17529 | 515 | 2.937988% |
| C | 17529 | 3519 | 20.075304% |
| D | 17529 | 481 | 2.744024% |
Noise dominated data is calculated using 1-second bins in cleaned event files. If a bin has >2000 counts, and if more than 50% of those come from <1% of pixels, then it is considered to be noise-dominated and hence unusable.
| Quadrant | # 1 sec bins | Bins with >0 counts | Bins with >2000 counts | High rate bins dominated by noise | Noise dominated (total time) | Noise dominated (detector-on time) | Marked lightcurve |
|---|---|---|---|---|---|---|---|
| A | 19303 | 17528 | 2770 | 2770 | 14.35% | 15.80% | 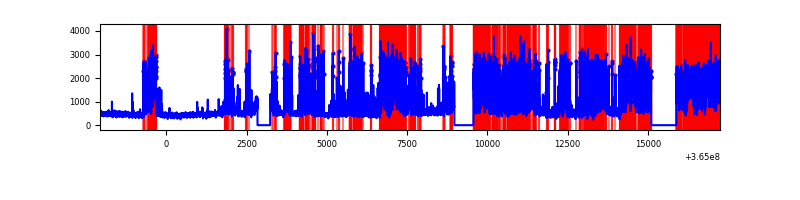 |
| B | 19304 | 17529 | 162 | 162 | 0.84% | 0.92% | 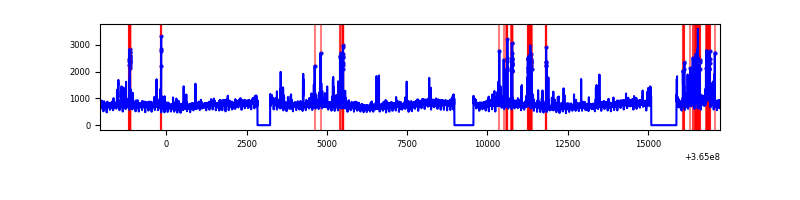 |
| C | 19304 | 17530 | 2610 | 2610 | 13.52% | 14.89% | 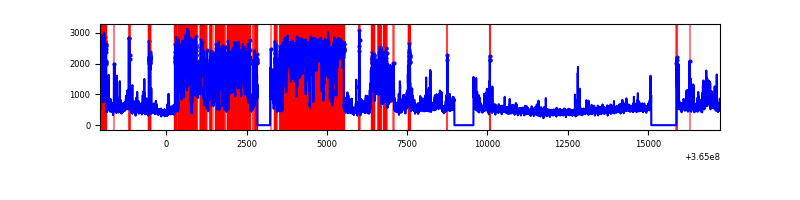 |
| D | 19304 | 17530 | 331 | 331 | 1.71% | 1.89% | 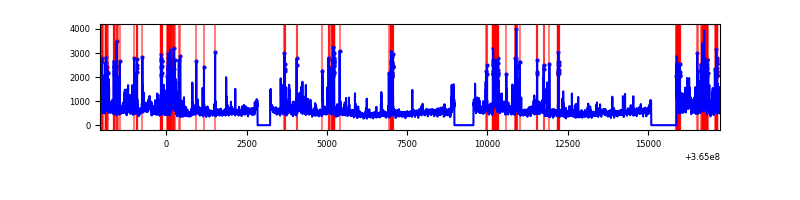 |
Top three noisy pixels from each quadrant. If the there are fewer than three noisy pixels in the level2.evt file, extra rows are filled as -1
| Pixel properties | Quadrant properties | ||||||
|---|---|---|---|---|---|---|---|
| Quadrant | DetID | PixID | Counts | Sigma | Mean | Median | Sigma |
| A | 0 | 13 | 10452377 | 29444.15 | 1775 | 1742 | 354.9 |
| A | 15 | 174 | 609838 | 1713.28 | 1775 | 1742 | 354.9 |
| A | 13 | 254 | 27673 | 73.06 | 1775 | 1742 | 354.9 |
| B | 6 | 159 | 4931806 | 12456.03 | 2080 | 2032 | 395.8 |
| B | 5 | 172 | 574844 | 1447.32 | 2080 | 2032 | 395.8 |
| B | 4 | 80 | 104316 | 258.44 | 2080 | 2032 | 395.8 |
| C | 3 | 233 | 8523698 | 19458.25 | 1874 | 1882 | 438.0 |
| C | 10 | 22 | 888653 | 2024.8 | 1874 | 1882 | 438.0 |
| C | 14 | 238 | 299405 | 679.35 | 1874 | 1882 | 438.0 |
| D | 8 | 195 | 1900753 | 3931.71 | 2023 | 1966 | 482.9 |
| D | 2 | 250 | 581660 | 1200.34 | 2023 | 1966 | 482.9 |
| D | 12 | 79 | 505400 | 1042.43 | 2023 | 1966 | 482.9 |
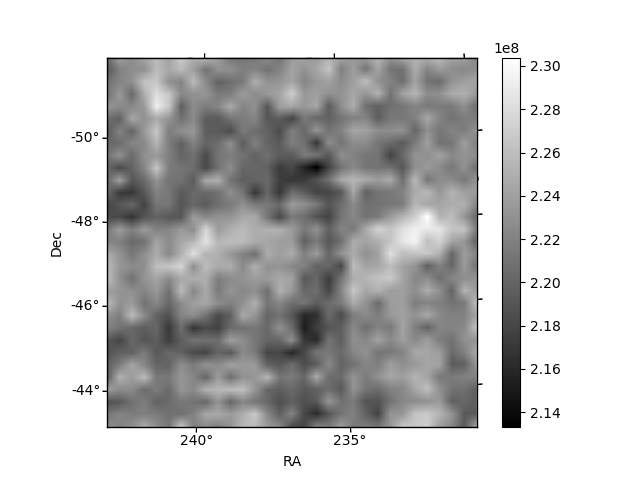
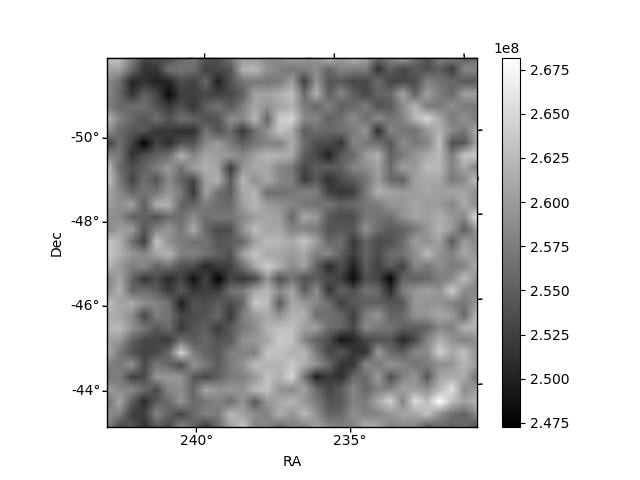
Histogram calculated using DETX and DETY for each event in the final _common_clean file
| Quadrant A |  |
 |
Quadrant B |
|---|---|---|---|
| Quadrant D |  |
 |
Quadrant C |
| Plot type | Count rate plots | Images |
|---|---|---|
| Comparison with Poisson distribution Blue bars denote a histogram of data divided into 1 sec bins. Red curve is a Poisson curve with rate = median count rate of data. |
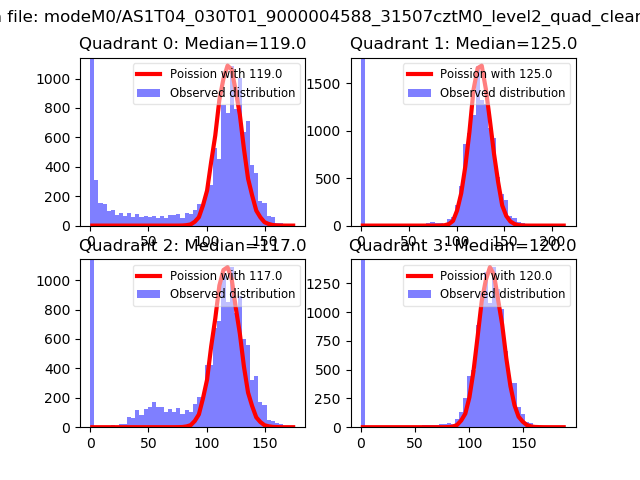 |
 |
| Quadrant-wise count rates Data is divided into 100 sec bins |
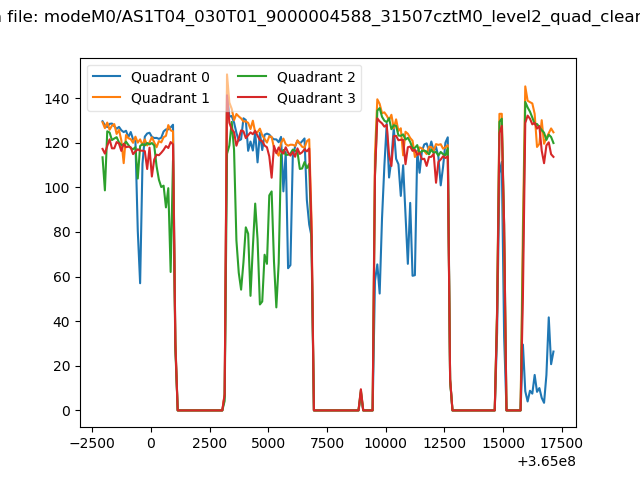 |
|
| Module-wise count rates for Quadrant A Data is divided into 100 sec bins |
 |
 |
| Module-wise count rates for Quadrant B Data is divided into 100 sec bins |
 |
 |
| Module-wise count rates for Quadrant C Data is divided into 100 sec bins |
 |
 |
| Module-wise count rates for Quadrant D Data is divided into 100 sec bins |
 |
 |
| Parameter | Plot |
|---|---|
| CZT HV Monitor |  |
| D_VDD | 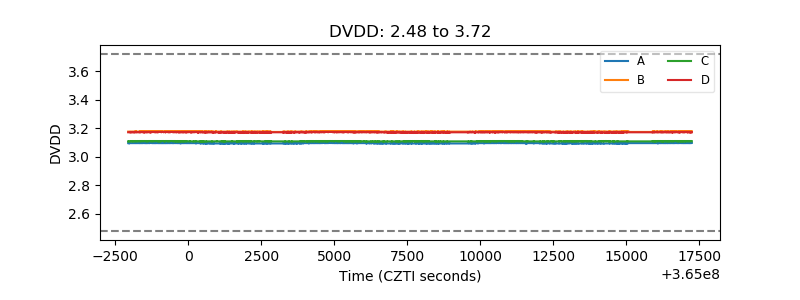 |
| Temperature 1 |  |
| Veto HV Monitor |  |
| Veto LLD |  |
| Alpha Counter |  |
| _CPM_Rate | 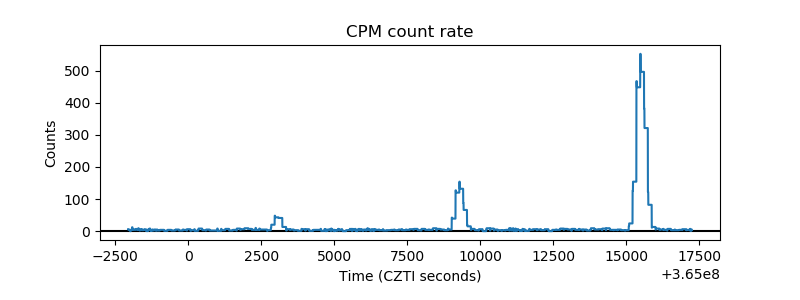 |
| CZT Counter |  |
| +2.5 Volts monitor |  |
| +5 Volts monitor |  |
| _ROLL_ROT |  |
| _Roll_DEC |  |
| _Roll_RA |  |
| Veto Counter |  |