| Param | Original file | Final file |
|---|---|---|
| Filename | modeM0/AS1T04_030T01_9000004588_31509cztM0_level2.evt | modeM0/AS1T04_030T01_9000004588_31509cztM0_level2_quad_clean.evt |
| Size (bytes) | 2,094,148,800 | 273,839,040 |
| Size | 2.0 GB | 261.2 MB |
| Events in quadrant A | 12,238,175 | 1,788,281 |
| Events in quadrant B | 15,659,554 | 1,813,248 |
| Events in quadrant C | 20,725,532 | 1,586,825 |
| Events in quadrant D | 13,454,536 | 1,727,746 |
| Mode M0 | |||
|---|---|---|---|
| Quadrant | BADHDUFLAG | Total packets | Discarded packets |
| A | 0 | 49471 | 4 |
| B | 0 | 61534 | 4 |
| C | 0 | 74621 | 4 |
| D | 0 | 53179 | 4 |
| Mode SS | |||
|---|---|---|---|
| Quadrant | BADHDUFLAG | Total packets | Discarded packets |
| A | 0 | 408 | 0 |
| B | 0 | 408 | 0 |
| C | 0 | 408 | 0 |
| D | 0 | 408 | 0 |
| Mode M9 | |||
|---|---|---|---|
| Quadrant | BADHDUFLAG | Total packets | Discarded packets |
| A | 0 | 7 | 0 |
| B | 0 | 7 | 0 |
| C | 0 | 7 | 0 |
| D | 0 | 7 | 0 |
| Quadrant | Total seconds | Saturated seconds | Saturation percentage |
|---|---|---|---|
| A | 19973 | 1291 | 6.463726% |
| B | 19974 | 772 | 3.865025% |
| C | 19974 | 4738 | 23.720837% |
| D | 19974 | 708 | 3.544608% |
Noise dominated data is calculated using 1-second bins in cleaned event files. If a bin has >2000 counts, and if more than 50% of those come from <1% of pixels, then it is considered to be noise-dominated and hence unusable.
| Quadrant | # 1 sec bins | Bins with >0 counts | Bins with >2000 counts | High rate bins dominated by noise | Noise dominated (total time) | Noise dominated (detector-on time) | Marked lightcurve |
|---|---|---|---|---|---|---|---|
| A | 20758 | 19973 | 678 | 678 | 3.27% | 3.39% | 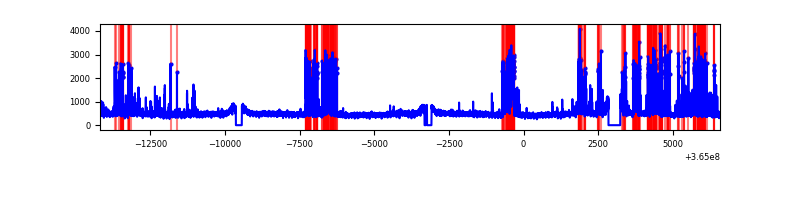 |
| B | 20759 | 19974 | 100 | 100 | 0.48% | 0.50% | 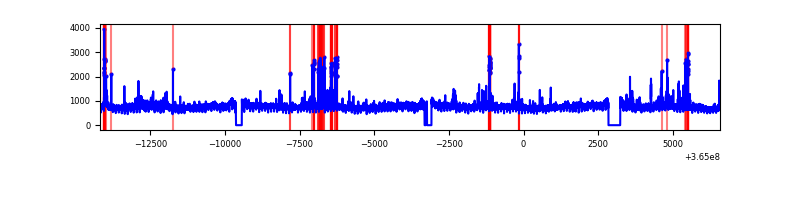 |
| C | 20758 | 19973 | 3345 | 3345 | 16.11% | 16.75% | 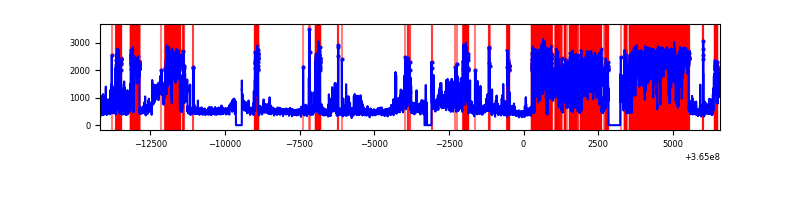 |
| D | 20759 | 19974 | 324 | 324 | 1.56% | 1.62% | 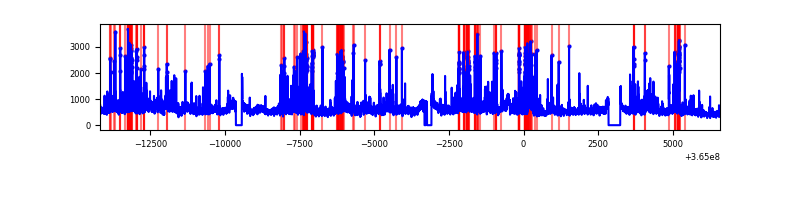 |
Top three noisy pixels from each quadrant. If the there are fewer than three noisy pixels in the level2.evt file, extra rows are filled as -1
| Pixel properties | Quadrant properties | ||||||
|---|---|---|---|---|---|---|---|
| Quadrant | DetID | PixID | Counts | Sigma | Mean | Median | Sigma |
| A | 0 | 13 | 2460417 | 5162.11 | 2376 | 2326 | 476.2 |
| A | 15 | 174 | 610656 | 1277.52 | 2376 | 2326 | 476.2 |
| A | 13 | 254 | 35796 | 70.29 | 2376 | 2326 | 476.2 |
| B | 6 | 159 | 5487094 | 12102.19 | 2374 | 2315 | 453.2 |
| B | 5 | 172 | 299539 | 655.83 | 2374 | 2315 | 453.2 |
| B | 0 | 190 | 113634 | 245.63 | 2374 | 2315 | 453.2 |
| C | 3 | 233 | 10306697 | 20831.72 | 2116 | 2126 | 494.7 |
| C | 10 | 22 | 1685958 | 3404.03 | 2116 | 2126 | 494.7 |
| C | 14 | 238 | 336923 | 676.83 | 2116 | 2126 | 494.7 |
| D | 8 | 195 | 2534740 | 4615.91 | 2320 | 2254 | 548.6 |
| D | 12 | 218 | 648355 | 1177.63 | 2320 | 2254 | 548.6 |
| D | 2 | 250 | 464937 | 843.32 | 2320 | 2254 | 548.6 |
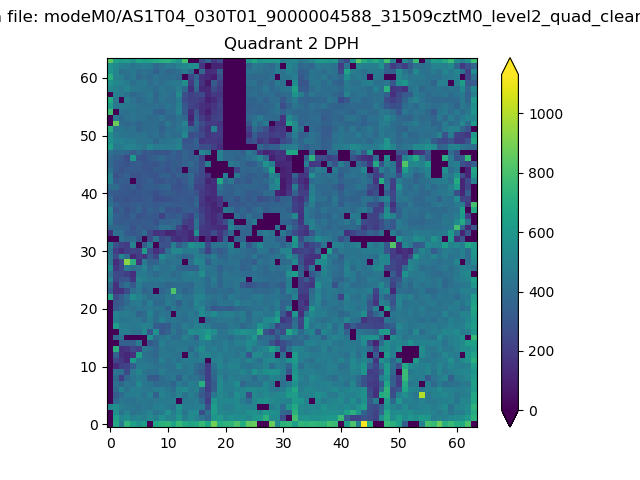
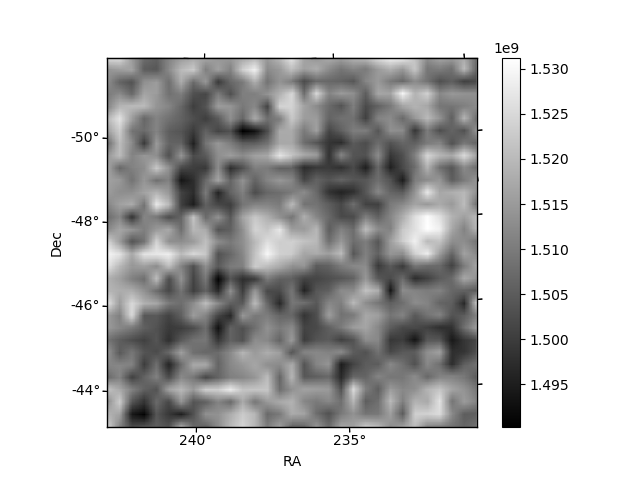
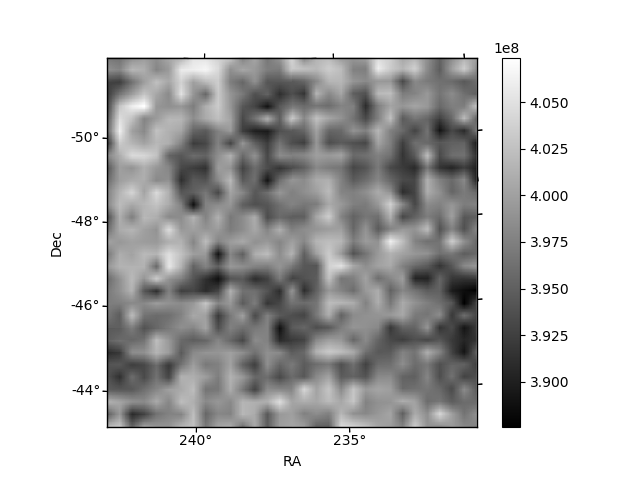
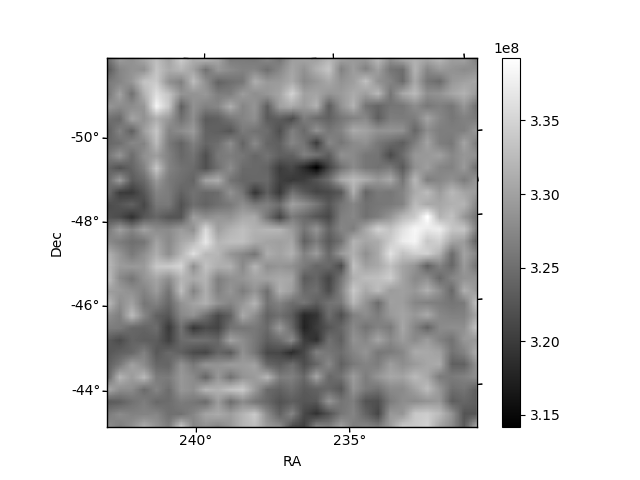
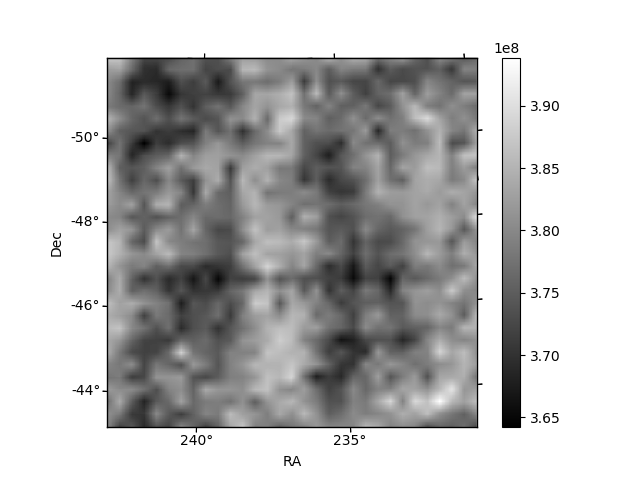
Histogram calculated using DETX and DETY for each event in the final _common_clean file
| Quadrant A | 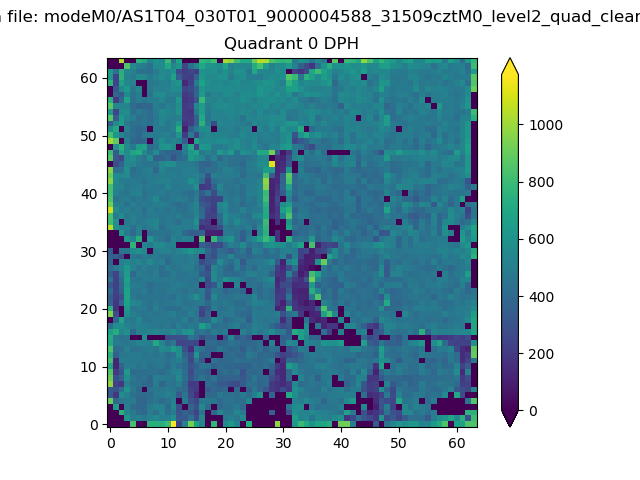 |
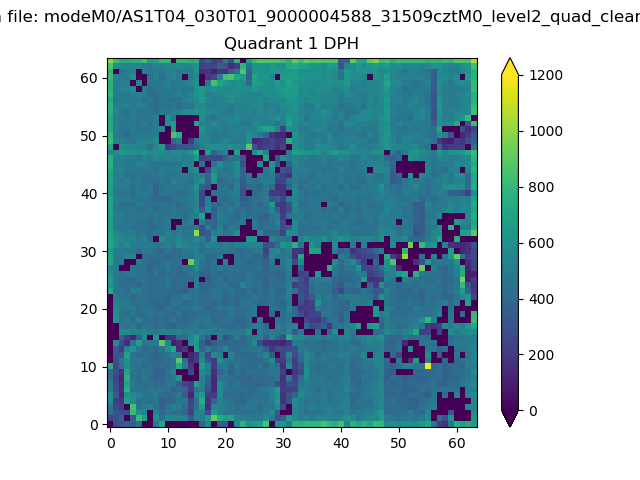 |
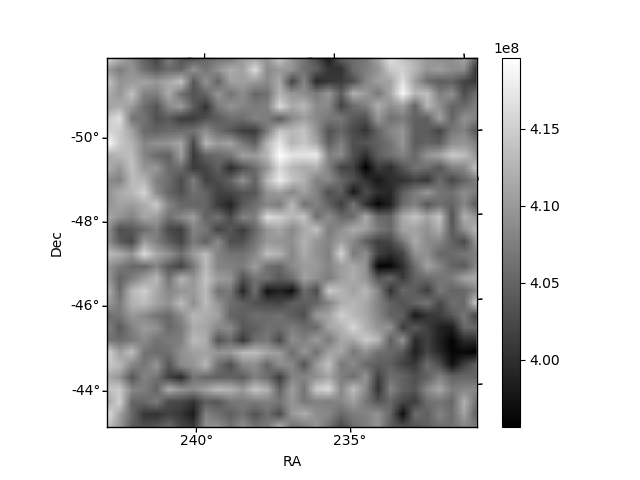
Quadrant B |
|---|---|---|---|
| Quadrant D | 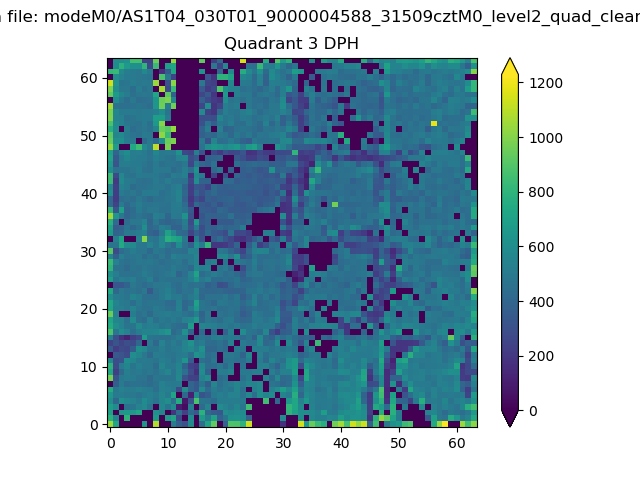 |
 |
Quadrant C |
| Plot type | Count rate plots | Images |
|---|---|---|
| Comparison with Poisson distribution Blue bars denote a histogram of data divided into 1 sec bins. Red curve is a Poisson curve with rate = median count rate of data. |
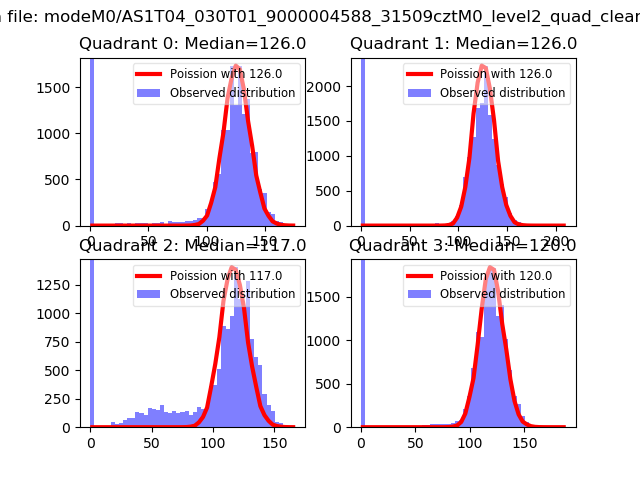 |
 |
| Quadrant-wise count rates Data is divided into 100 sec bins |
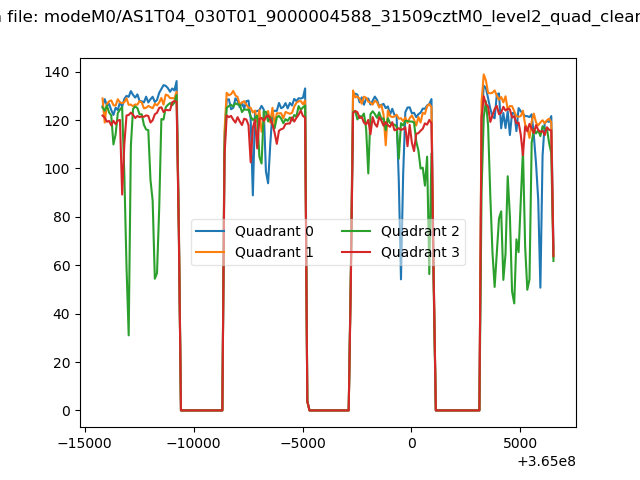 |
|
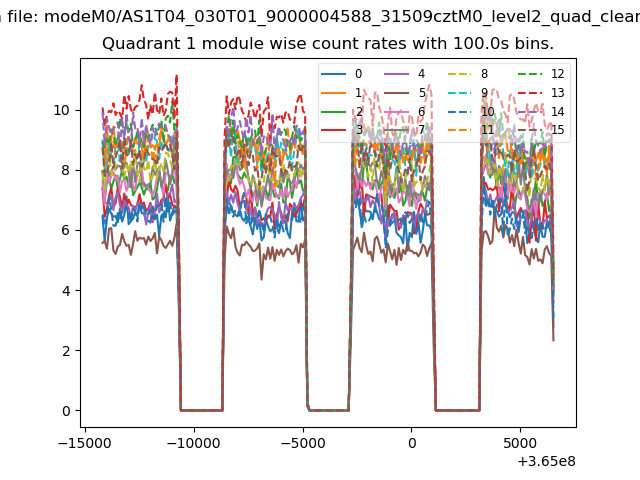
| Module-wise count rates for Quadrant A Data is divided into 100 sec bins |
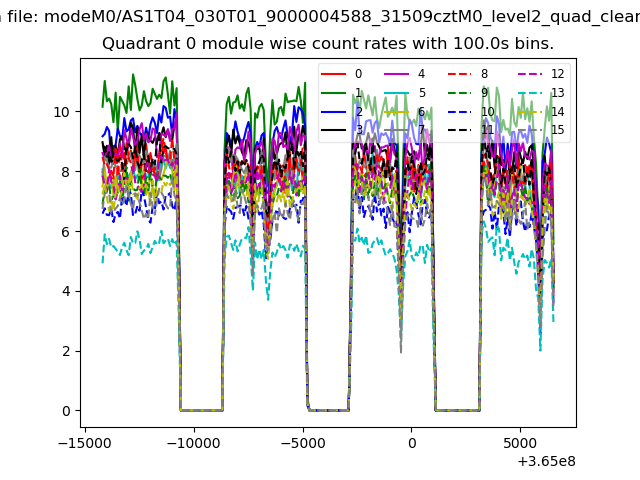 |
 |
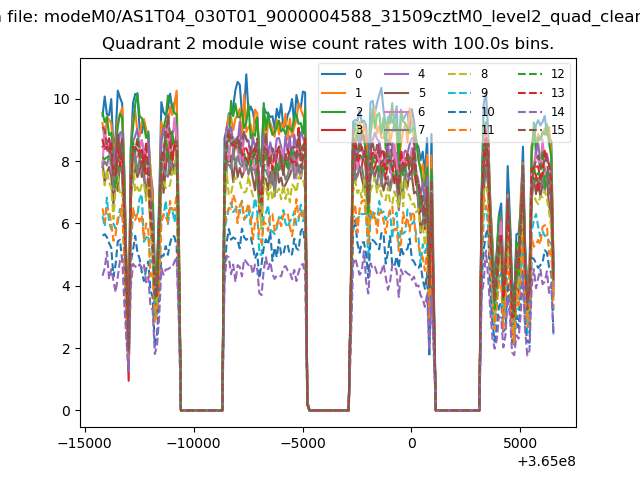
| Module-wise count rates for Quadrant B Data is divided into 100 sec bins |
 |
 |
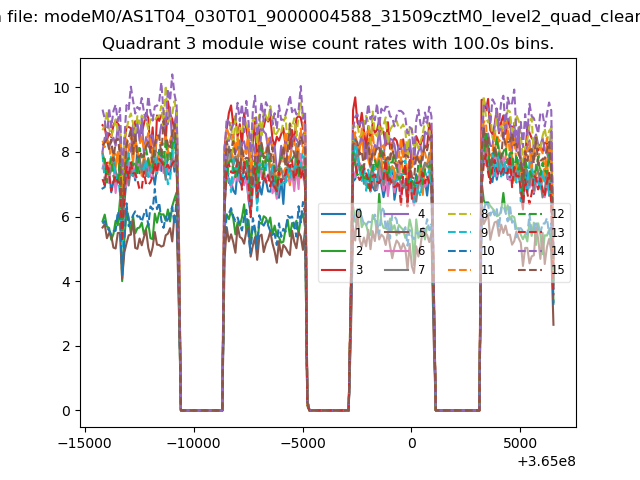
| Module-wise count rates for Quadrant C Data is divided into 100 sec bins |
 |
 |
| Module-wise count rates for Quadrant D Data is divided into 100 sec bins |
 |
 |
| Parameter | Plot |
|---|---|
| CZT HV Monitor | 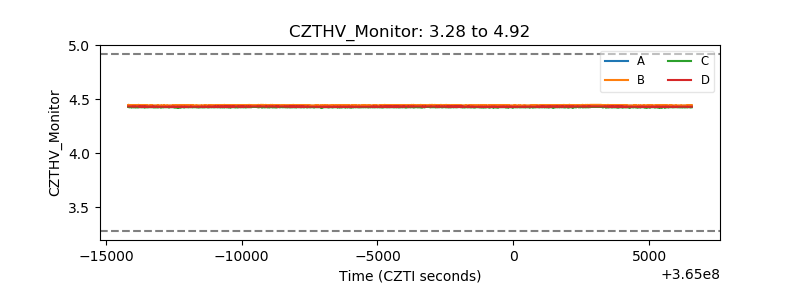 |
| D_VDD | 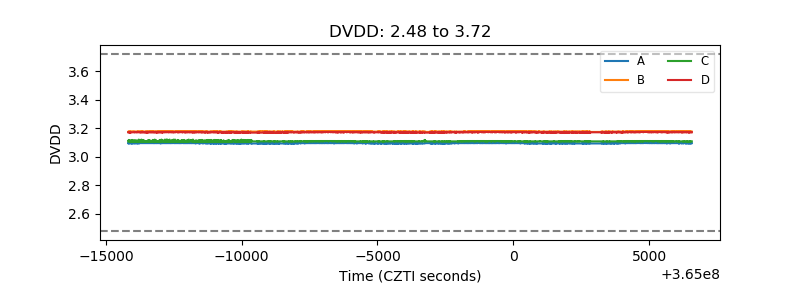 |
| Temperature 1 |  |
| Veto HV Monitor | 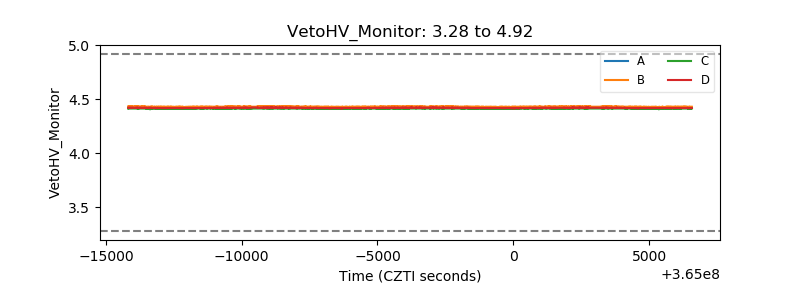 |
| Veto LLD | 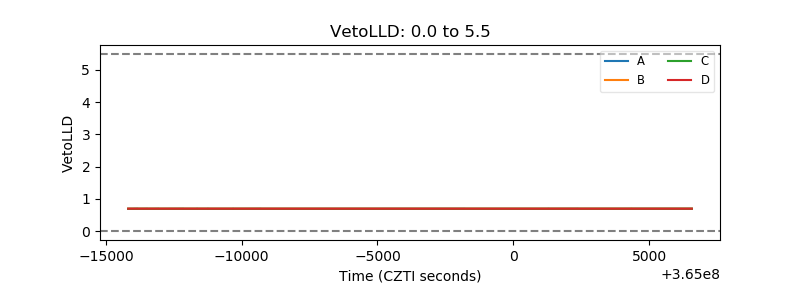 |
| Alpha Counter | 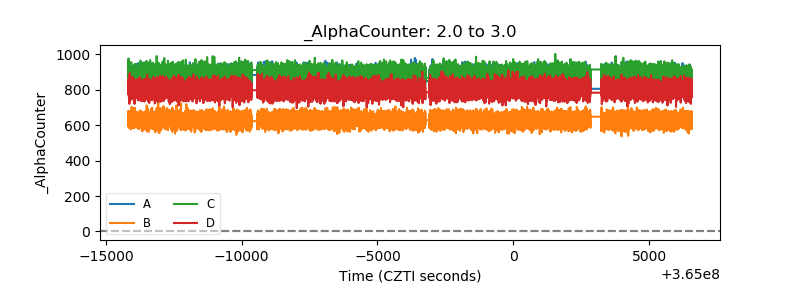 |
| _CPM_Rate | 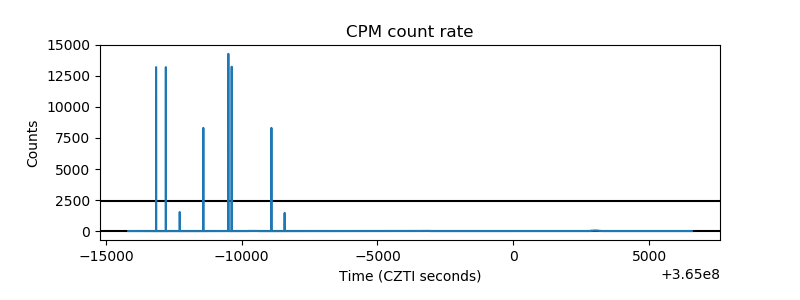 |
| CZT Counter | 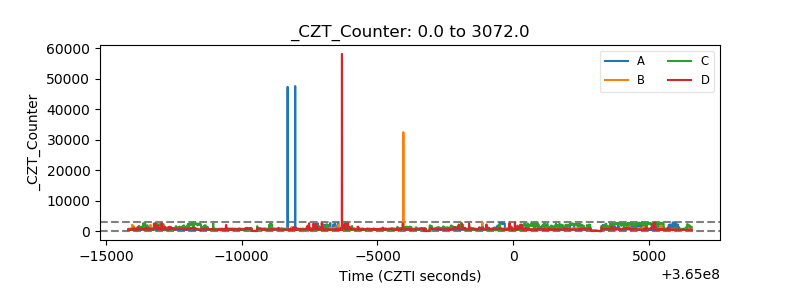 |
| +2.5 Volts monitor |  |
| +5 Volts monitor |  |
| _ROLL_ROT | 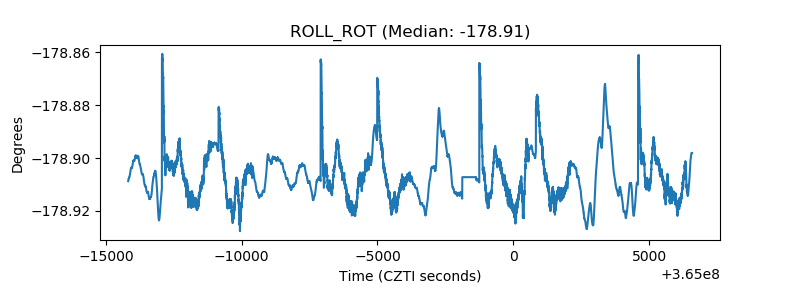 |
| _Roll_DEC |  |
| _Roll_RA | 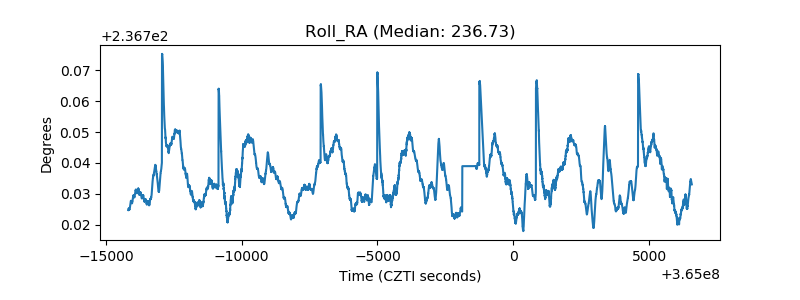 |
| Veto Counter |  |