| Param | Original file | Final file |
|---|---|---|
| Filename | modeM0/AS1A10_053T21_9000004592cztM0_level2.fits | modeM0/AS1A10_053T21_9000004592cztM0_level2_quad_clean.evt |
| Size (bytes) | 59,443,200 | 53,055,360 |
| Size | 56.7 MB | 50.6 MB |
| Events in quadrant A | 363,782 | 307,150 |
| Events in quadrant B | 340,276 | 302,351 |
| Events in quadrant C | 351,832 | 289,496 |
| Events in quadrant D | 306,214 | 268,630 |
| Mode SS | |||
|---|---|---|---|
| Quadrant | BADHDUFLAG | Total packets | Discarded packets |
| A | 0 | 130 | 0 |
| B | 0 | 130 | 0 |
| C | 0 | 130 | 0 |
| D | 0 | 130 | 0 |
| Mode M9 | |||
|---|---|---|---|
| Quadrant | BADHDUFLAG | Total packets | Discarded packets |
| A | 0 | 10 | 0 |
| B | 0 | 10 | 0 |
| C | 0 | 10 | 0 |
| D | 0 | 10 | 0 |
| Mode M0 | |||
|---|---|---|---|
| Quadrant | BADHDUFLAG | Total packets | Discarded packets |
| A | 0 | 13940 | 0 |
| B | 0 | 19506 | 0 |
| C | 0 | 13923 | 0 |
| D | 0 | 19265 | 0 |
| Quadrant | Total seconds | Saturated seconds | Saturation percentage |
|---|---|---|---|
| A | 6283 | 217 | 3.453764% |
| B | 6283 | 246 | 3.915327% |
| C | 6283 | 219 | 3.485596% |
| D | 6283 | 277 | 4.408722% |
Noise dominated data is calculated using 1-second bins in cleaned event files. If a bin has >2000 counts, and if more than 50% of those come from <1% of pixels, then it is considered to be noise-dominated and hence unusable.
| Quadrant | # 1 sec bins | Bins with >0 counts | Bins with >2000 counts | High rate bins dominated by noise | Noise dominated (total time) | Noise dominated (detector-on time) | Marked lightcurve |
|---|---|---|---|---|---|---|---|
| A | 7183 | 6279 | 0 | 0 | 0.00% | 0.00% |  |
| B | 7183 | 6280 | 0 | 0 | 0.00% | 0.00% |  |
| C | 7183 | 6280 | 0 | 0 | 0.00% | 0.00% |  |
| D | 7183 | 6278 | 0 | 0 | 0.00% | 0.00% |  |
Top three noisy pixels from each quadrant. If the there are fewer than three noisy pixels in the level2.evt file, extra rows are filled as -1
| Pixel properties | Quadrant properties | ||||||
|---|---|---|---|---|---|---|---|
| Quadrant | DetID | PixID | Counts | Sigma | Mean | Median | Sigma |
| A | 0 | 29 | 291 | 7.94 | 94 | 89 | 25.4 |
| A | 14 | 95 | 274 | 7.28 | 94 | 89 | 25.4 |
| A | 9 | 19 | 271 | 7.16 | 94 | 89 | 25.4 |
| B | 2 | 9 | 283 | 9.51 | 90 | 85 | 20.8 |
| B | 2 | 8 | 236 | 7.25 | 90 | 85 | 20.8 |
| B | 3 | 17 | 235 | 7.2 | 90 | 85 | 20.8 |
| C | 7 | 111 | 264 | 7.02 | 93 | 87 | 25.2 |
| C | 3 | 126 | 255 | 6.66 | 93 | 87 | 25.2 |
| C | 12 | 241 | 248 | 6.39 | 93 | 87 | 25.2 |
| D | 4 | 246 | 226 | 5.9 | 87 | 79 | 24.9 |
| D | 7 | 3 | 223 | 5.78 | 87 | 79 | 24.9 |
| D | 7 | 4 | 220 | 5.66 | 87 | 79 | 24.9 |
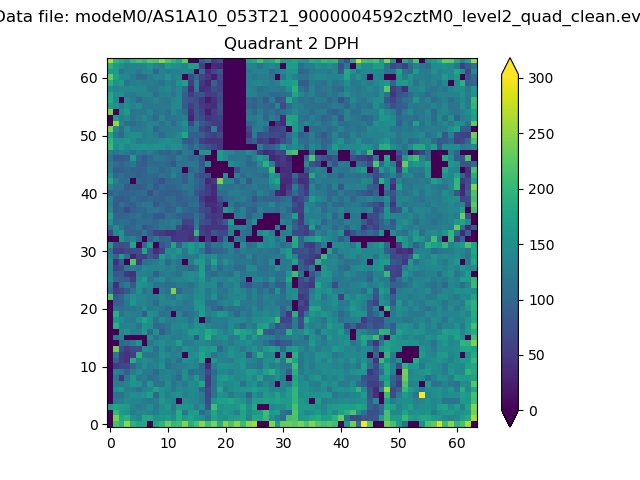
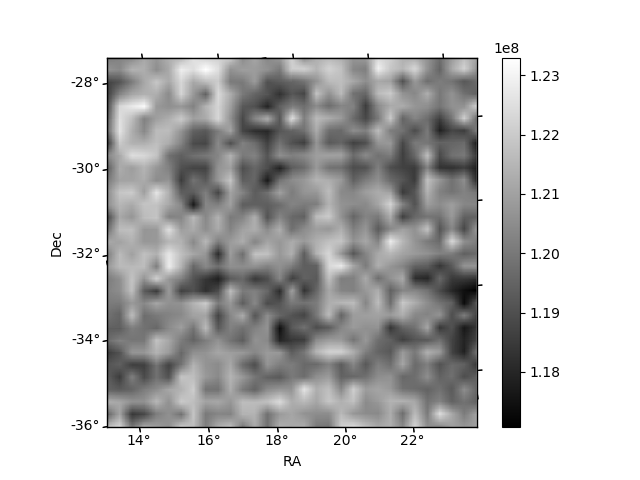
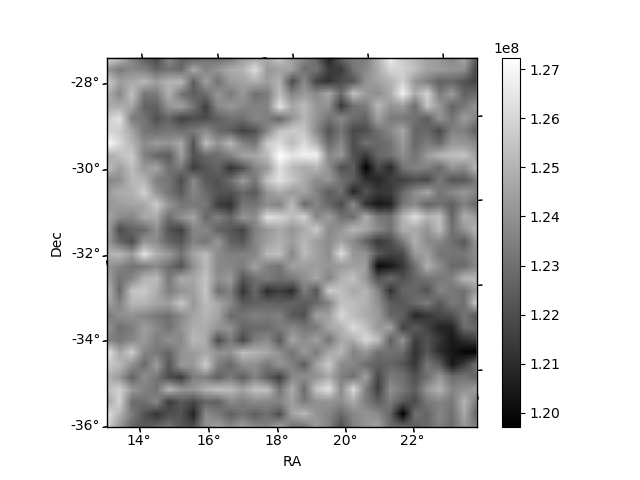
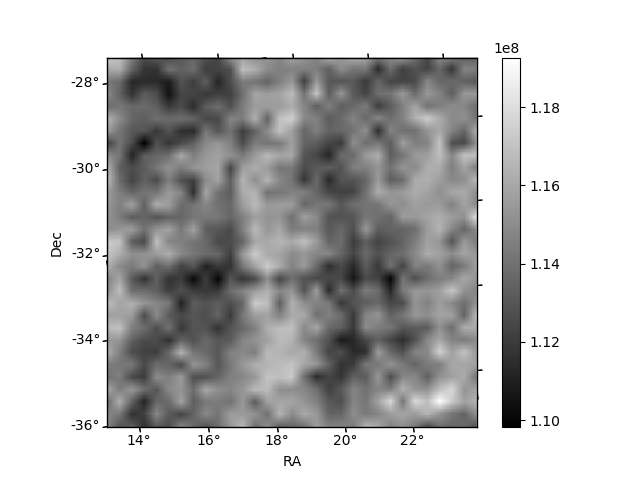
Histogram calculated using DETX and DETY for each event in the final _common_clean file
| Quadrant A |  |
 |
Quadrant B |
|---|---|---|---|
| Quadrant D |  |
 |
Quadrant C |
| Plot type | Count rate plots | Images |
|---|---|---|
| Comparison with Poisson distribution Blue bars denote a histogram of data divided into 1 sec bins. Red curve is a Poisson curve with rate = median count rate of data. |
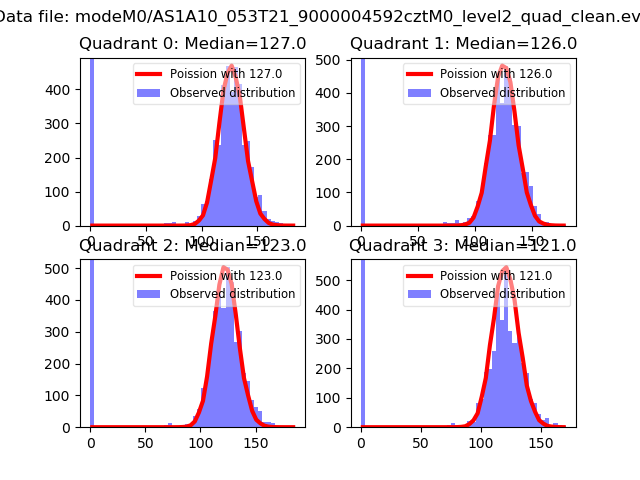 |
 |
| Quadrant-wise count rates Data is divided into 100 sec bins |
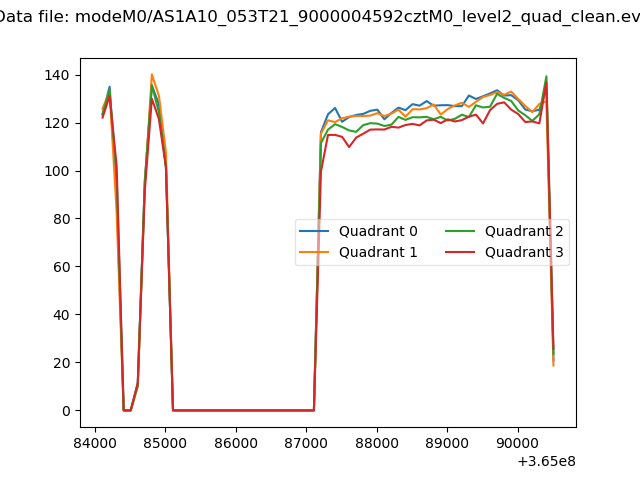 |
|
| Module-wise count rates for Quadrant A Data is divided into 100 sec bins |
 |
 |
| Module-wise count rates for Quadrant B Data is divided into 100 sec bins |
 |
 |
| Module-wise count rates for Quadrant C Data is divided into 100 sec bins |
 |
 |
| Module-wise count rates for Quadrant D Data is divided into 100 sec bins |
 |
 |
| Parameter | Plot |
|---|---|
| CZT HV Monitor |  |
| D_VDD | 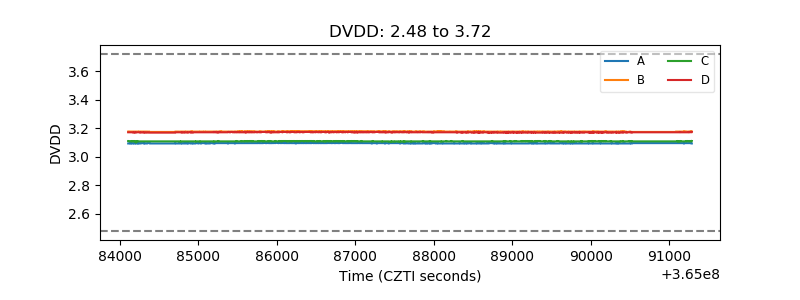 |
| Temperature 1 | 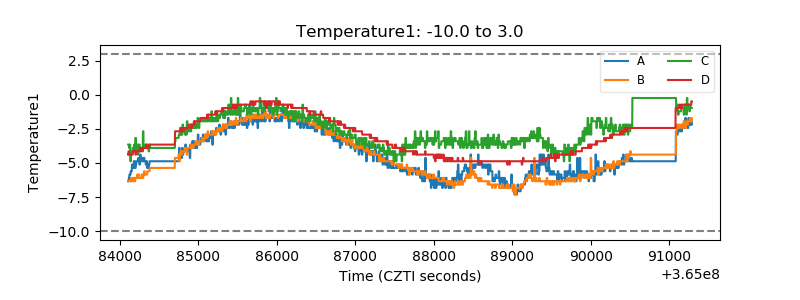 |
| Veto HV Monitor | 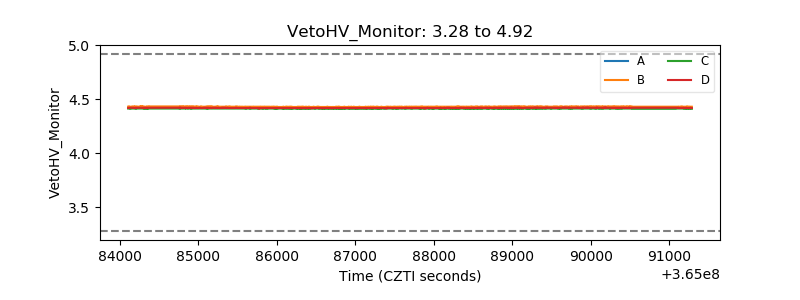 |
| Veto LLD |  |
| Alpha Counter |  |
| _CPM_Rate |  |
| CZT Counter | 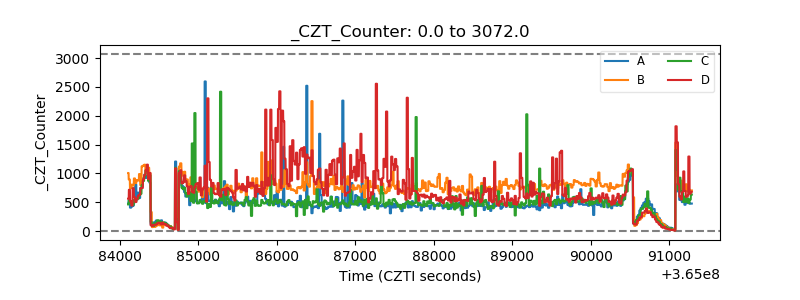 |
| +2.5 Volts monitor |  |
| +5 Volts monitor |  |
| _ROLL_ROT | 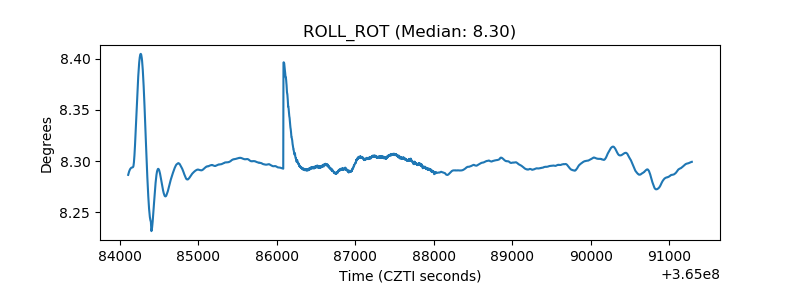 |
| _Roll_DEC |  |
| _Roll_RA | 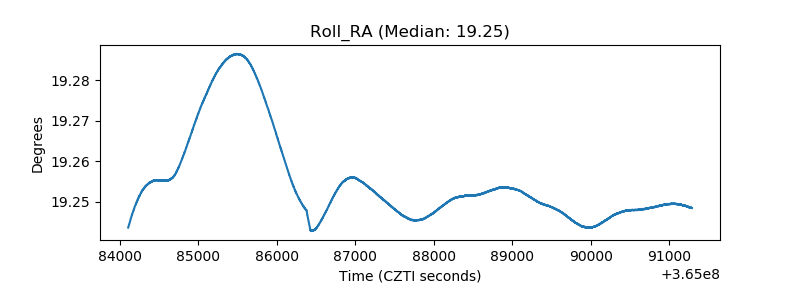 |
| Veto Counter |  |