| Param | Original file | Final file |
|---|---|---|
| Filename | modeM0/AS1A10_053T21_9000004592_31520cztM0_level2.evt | modeM0/AS1A10_053T21_9000004592_31520cztM0_level2_quad_clean.evt |
| Size (bytes) | 549,037,440 | 75,764,160 |
| Size | 523.6 MB | 72.3 MB |
| Events in quadrant A | 3,168,194 | 477,531 |
| Events in quadrant B | 4,841,611 | 473,845 |
| Events in quadrant C | 3,306,641 | 463,742 |
| Events in quadrant D | 4,899,346 | 453,956 |
| Mode SS | |||
|---|---|---|---|
| Quadrant | BADHDUFLAG | Total packets | Discarded packets |
| A | 0 | 126 | 0 |
| B | 0 | 126 | 0 |
| C | 0 | 126 | 0 |
| D | 0 | 126 | 0 |
| Mode M9 | |||
|---|---|---|---|
| Quadrant | BADHDUFLAG | Total packets | Discarded packets |
| A | 0 | 10 | 0 |
| B | 0 | 10 | 0 |
| C | 0 | 10 | 0 |
| D | 0 | 10 | 0 |
| Mode M0 | |||
|---|---|---|---|
| Quadrant | BADHDUFLAG | Total packets | Discarded packets |
| A | 0 | 13440 | 2 |
| B | 0 | 18855 | 2 |
| C | 0 | 13479 | 2 |
| D | 0 | 18825 | 2 |
| Quadrant | Total seconds | Saturated seconds | Saturation percentage |
|---|---|---|---|
| A | 6089 | 211 | 3.465265% |
| B | 6089 | 232 | 3.810149% |
| C | 6089 | 219 | 3.596650% |
| D | 6090 | 276 | 4.532020% |
Noise dominated data is calculated using 1-second bins in cleaned event files. If a bin has >2000 counts, and if more than 50% of those come from <1% of pixels, then it is considered to be noise-dominated and hence unusable.
| Quadrant | # 1 sec bins | Bins with >0 counts | Bins with >2000 counts | High rate bins dominated by noise | Noise dominated (total time) | Noise dominated (detector-on time) | Marked lightcurve |
|---|---|---|---|---|---|---|---|
| A | 6989 | 6089 | 39 | 39 | 0.56% | 0.64% | 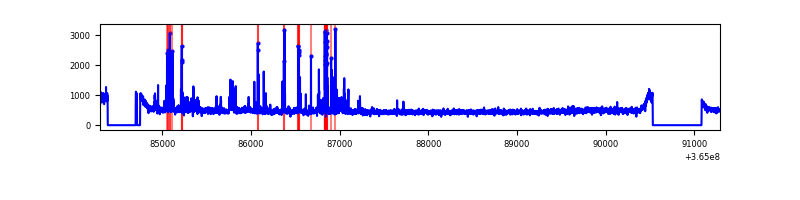 |
| B | 6989 | 6089 | 4 | 4 | 0.06% | 0.07% | 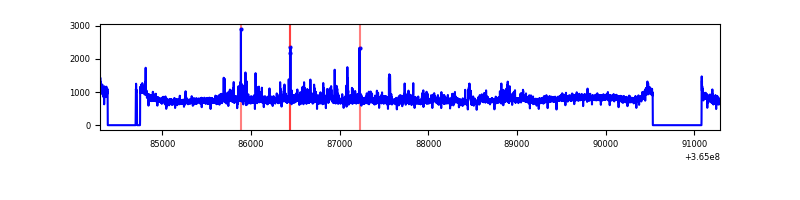 |
| C | 6989 | 6089 | 18 | 18 | 0.26% | 0.30% | 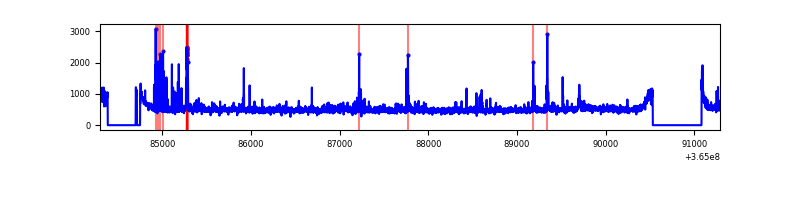 |
| D | 6990 | 6090 | 122 | 122 | 1.75% | 2.00% | 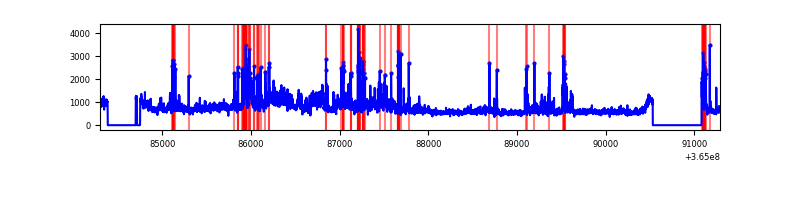 |
Top three noisy pixels from each quadrant. If the there are fewer than three noisy pixels in the level2.evt file, extra rows are filled as -1
| Pixel properties | Quadrant properties | ||||||
|---|---|---|---|---|---|---|---|
| Quadrant | DetID | PixID | Counts | Sigma | Mean | Median | Sigma |
| A | 0 | 13 | 268361 | 1747.83 | 751 | 734 | 153.1 |
| A | 13 | 254 | 11694 | 71.58 | 751 | 734 | 153.1 |
| A | 3 | 137 | 8003 | 47.47 | 751 | 734 | 153.1 |
| B | 6 | 159 | 1649403 | 11375.36 | 736 | 715 | 144.9 |
| B | 4 | 80 | 196526 | 1351.03 | 736 | 715 | 144.9 |
| B | 0 | 190 | 25419 | 170.45 | 736 | 715 | 144.9 |
| C | 3 | 233 | 167543 | 970.61 | 721 | 722 | 171.9 |
| C | 14 | 238 | 115038 | 665.12 | 721 | 722 | 171.9 |
| C | 0 | 10 | 107945 | 623.86 | 721 | 722 | 171.9 |
| D | 8 | 195 | 1504321 | 8614.33 | 727 | 708 | 174.5 |
| D | 13 | 249 | 241937 | 1382.02 | 727 | 708 | 174.5 |
| D | 12 | 79 | 197616 | 1128.1 | 727 | 708 | 174.5 |
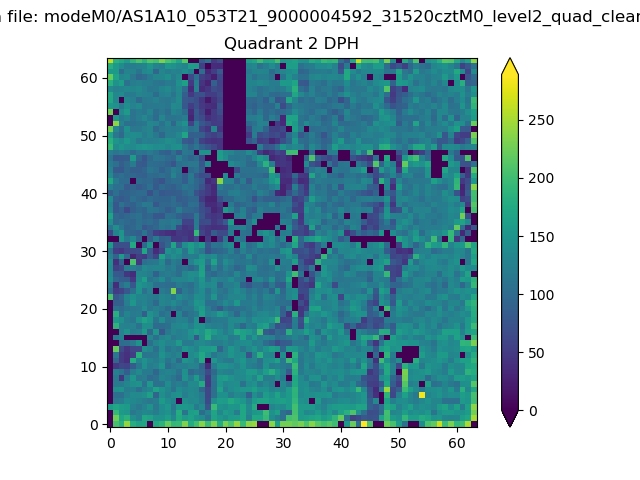
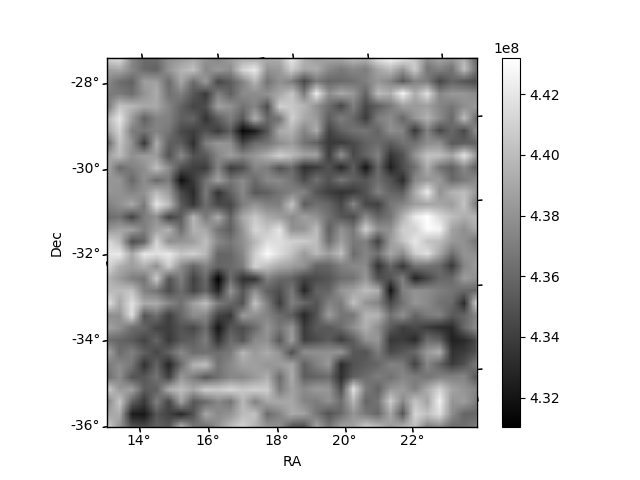
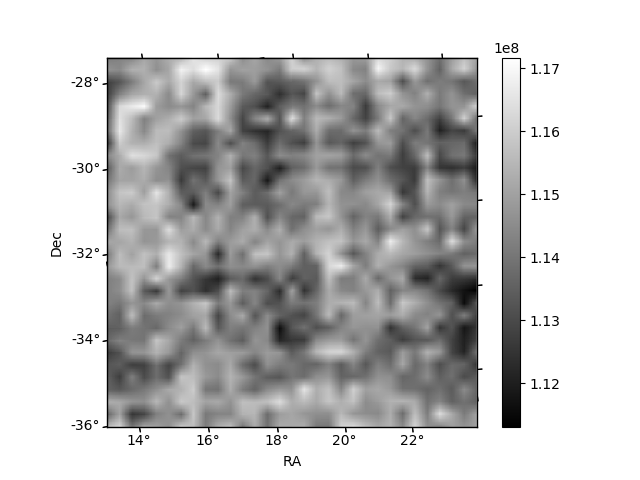
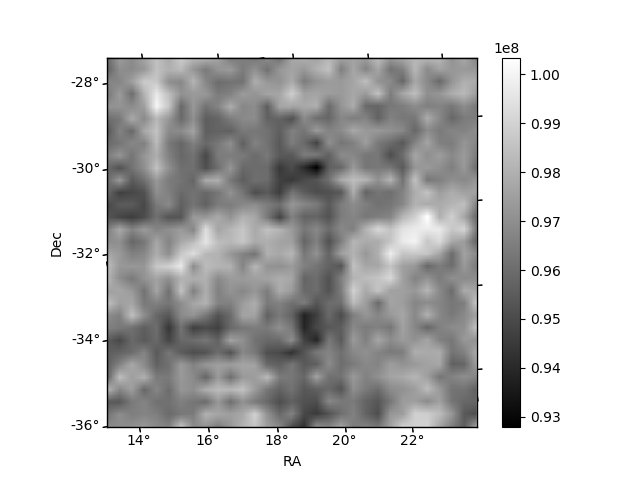
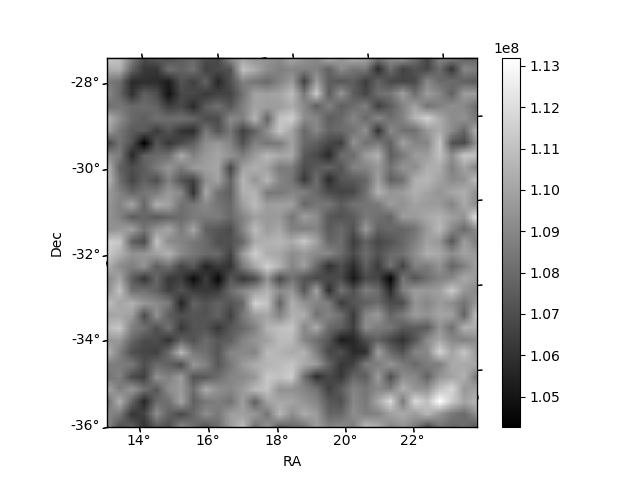
Histogram calculated using DETX and DETY for each event in the final _common_clean file
| Quadrant A | 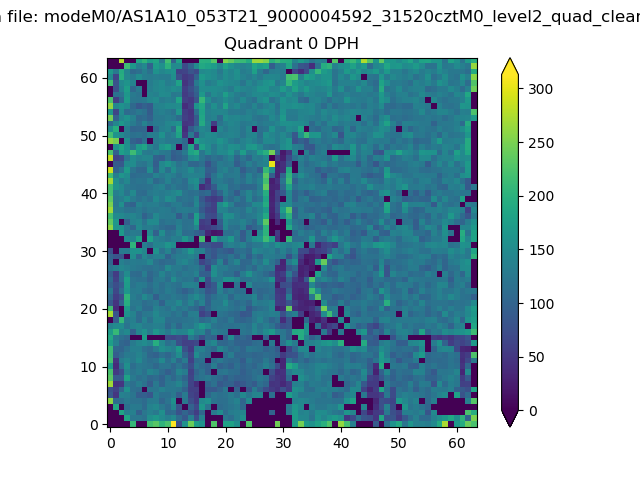 |
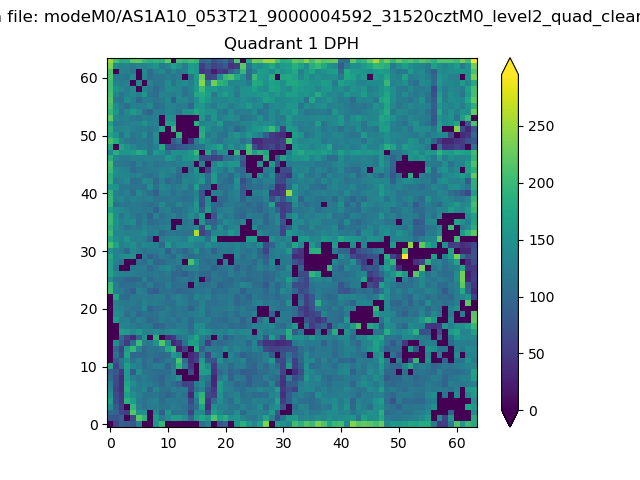 |
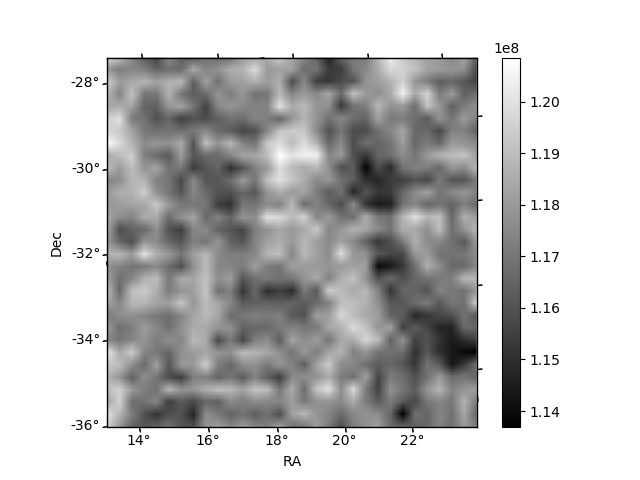
Quadrant B |
|---|---|---|---|
| Quadrant D | 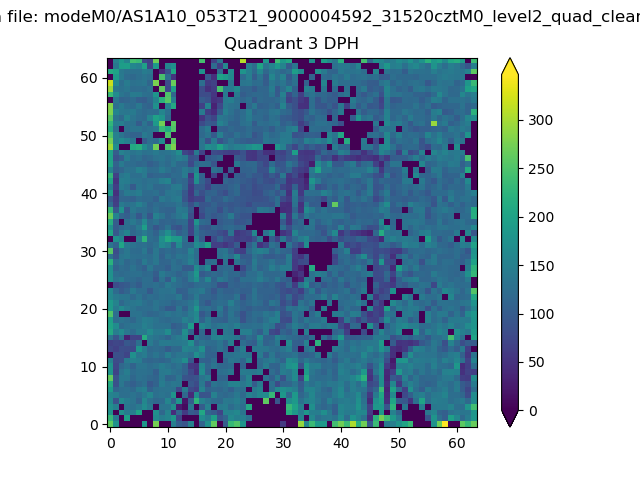 |
 |
Quadrant C |
| Plot type | Count rate plots | Images |
|---|---|---|
| Comparison with Poisson distribution Blue bars denote a histogram of data divided into 1 sec bins. Red curve is a Poisson curve with rate = median count rate of data. |
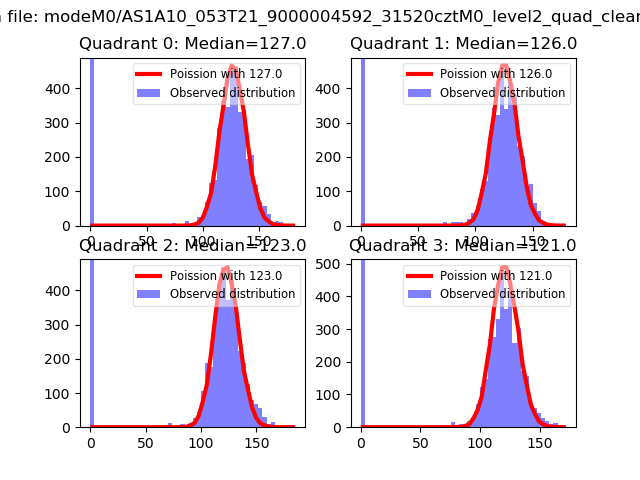 |
 |
| Quadrant-wise count rates Data is divided into 100 sec bins |
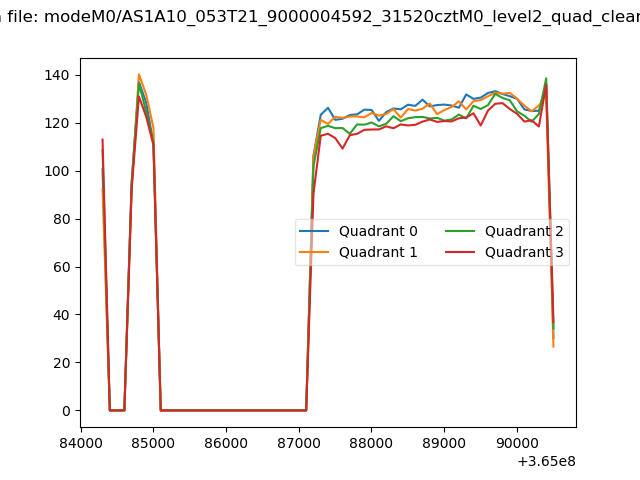 |
|
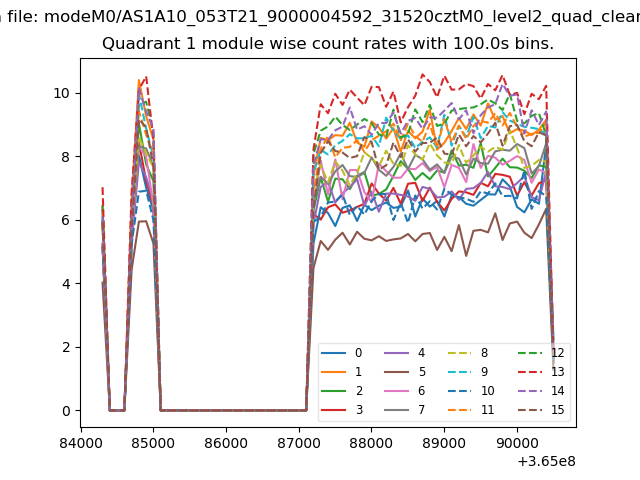
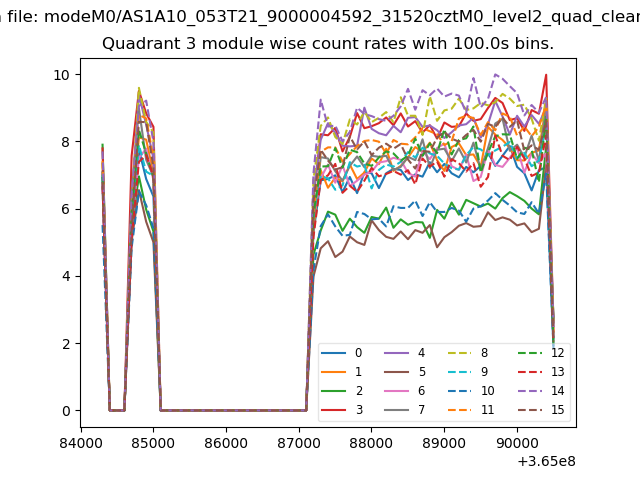
| Module-wise count rates for Quadrant A Data is divided into 100 sec bins |
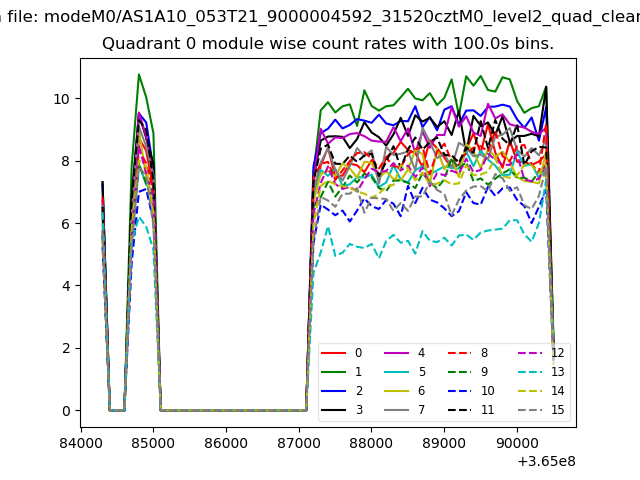 |
 |
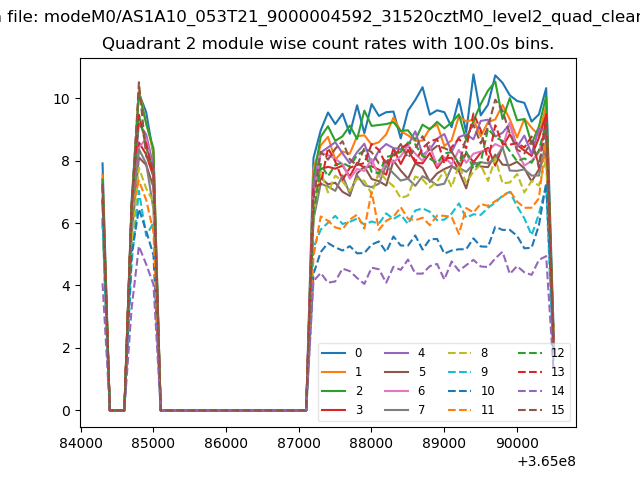
| Module-wise count rates for Quadrant B Data is divided into 100 sec bins |
 |
 |
| Module-wise count rates for Quadrant C Data is divided into 100 sec bins |
 |
 |
| Module-wise count rates for Quadrant D Data is divided into 100 sec bins |
 |
 |
| Parameter | Plot |
|---|---|
| CZT HV Monitor | 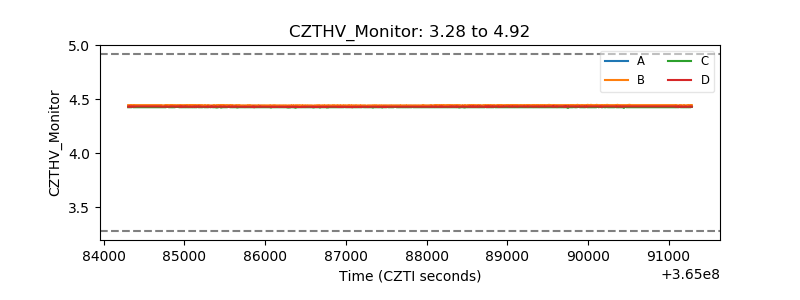 |
| D_VDD | 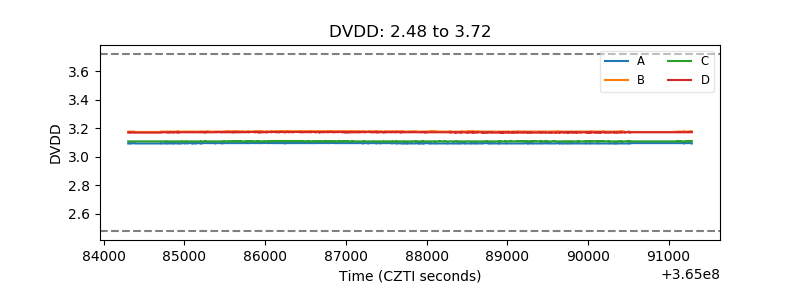 |
| Temperature 1 | 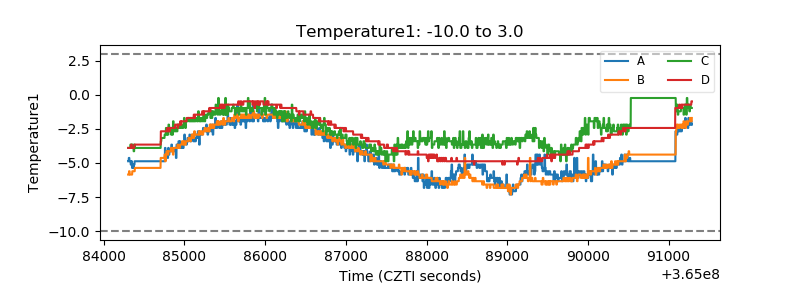 |
| Veto HV Monitor | 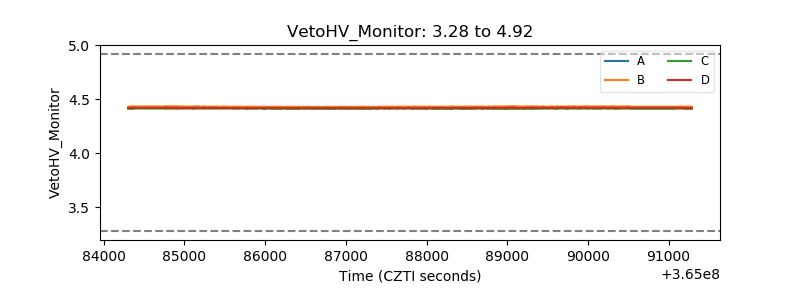 |
| Veto LLD | 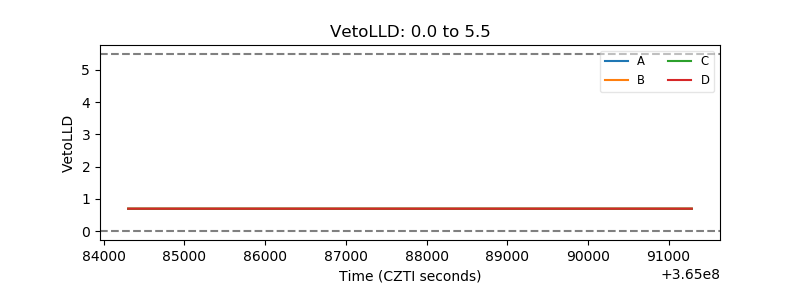 |
| Alpha Counter | 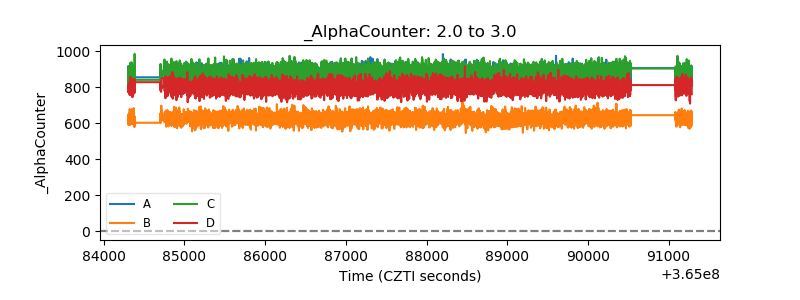 |
| _CPM_Rate | 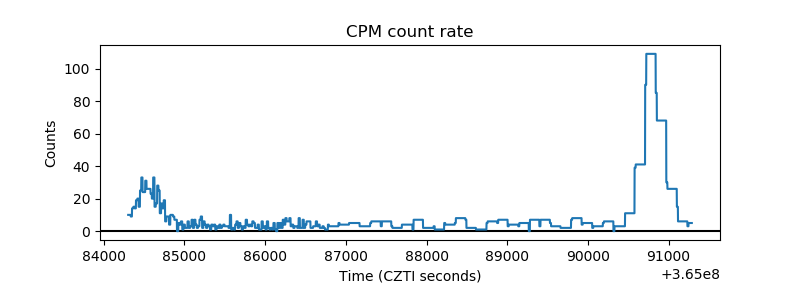 |
| CZT Counter | 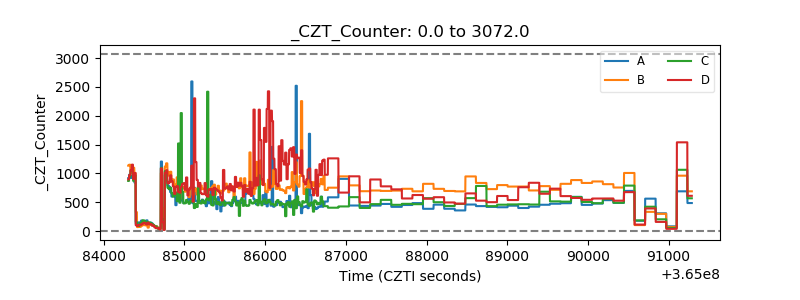 |
| +2.5 Volts monitor |  |
| +5 Volts monitor |  |
| _ROLL_ROT | 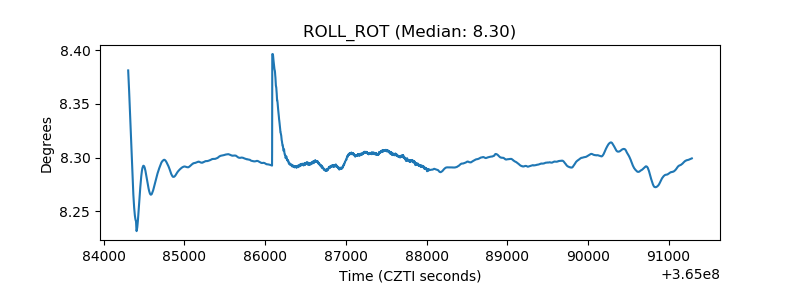 |
| _Roll_DEC | 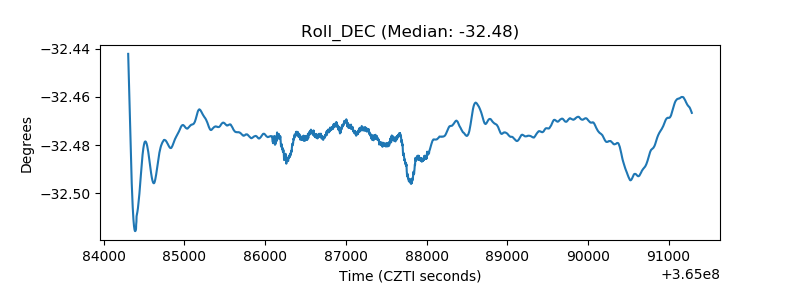 |
| _Roll_RA | 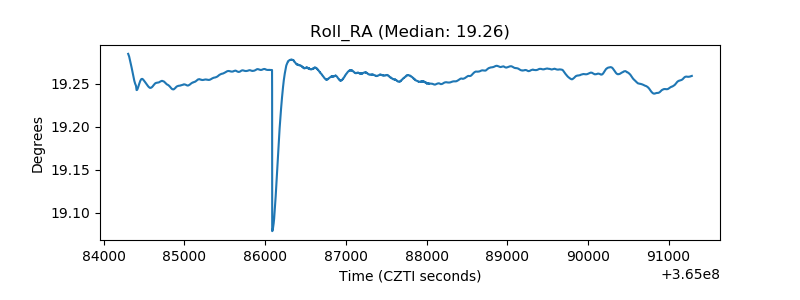 |
| Veto Counter | 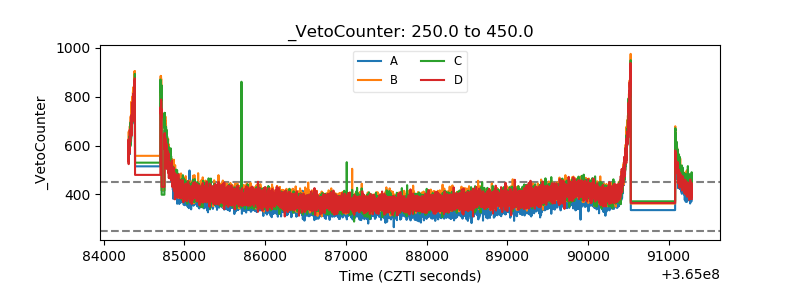 |