| Param | Original file | Final file |
|---|---|---|
| Filename | modeM0/AS1A10_053T21_9000004592_31524cztM0_level2.evt | modeM0/AS1A10_053T21_9000004592_31524cztM0_level2_quad_clean.evt |
| Size (bytes) | 566,663,040 | 79,476,480 |
| Size | 540.4 MB | 75.8 MB |
| Events in quadrant A | 3,292,880 | 502,080 |
| Events in quadrant B | 5,020,023 | 499,209 |
| Events in quadrant C | 3,416,970 | 488,646 |
| Events in quadrant D | 5,006,670 | 478,168 |
| Mode SS | |||
|---|---|---|---|
| Quadrant | BADHDUFLAG | Total packets | Discarded packets |
| A | 0 | 130 | 0 |
| B | 0 | 130 | 0 |
| C | 0 | 130 | 0 |
| D | 0 | 130 | 0 |
| Mode M9 | |||
|---|---|---|---|
| Quadrant | BADHDUFLAG | Total packets | Discarded packets |
| A | 0 | 10 | 0 |
| B | 0 | 10 | 0 |
| C | 0 | 10 | 0 |
| D | 0 | 10 | 0 |
| Mode M0 | |||
|---|---|---|---|
| Quadrant | BADHDUFLAG | Total packets | Discarded packets |
| A | 0 | 13942 | 2 |
| B | 0 | 19508 | 2 |
| C | 0 | 13925 | 2 |
| D | 0 | 19267 | 2 |
| Quadrant | Total seconds | Saturated seconds | Saturation percentage |
|---|---|---|---|
| A | 6283 | 217 | 3.453764% |
| B | 6283 | 246 | 3.915327% |
| C | 6283 | 219 | 3.485596% |
| D | 6283 | 277 | 4.408722% |
Noise dominated data is calculated using 1-second bins in cleaned event files. If a bin has >2000 counts, and if more than 50% of those come from <1% of pixels, then it is considered to be noise-dominated and hence unusable.
| Quadrant | # 1 sec bins | Bins with >0 counts | Bins with >2000 counts | High rate bins dominated by noise | Noise dominated (total time) | Noise dominated (detector-on time) | Marked lightcurve |
|---|---|---|---|---|---|---|---|
| A | 7183 | 6283 | 41 | 41 | 0.57% | 0.65% | 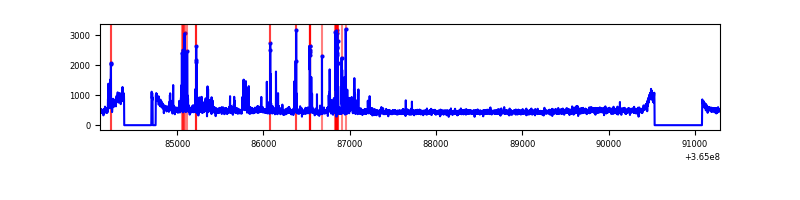 |
| B | 7183 | 6283 | 4 | 4 | 0.06% | 0.06% | 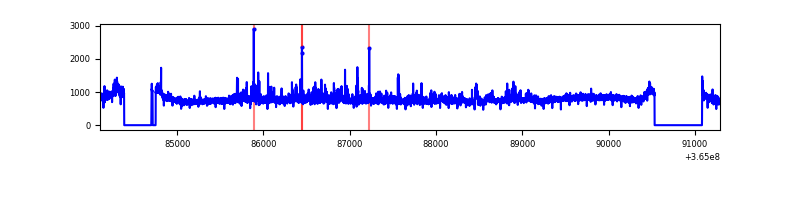 |
| C | 7183 | 6283 | 18 | 18 | 0.25% | 0.29% | 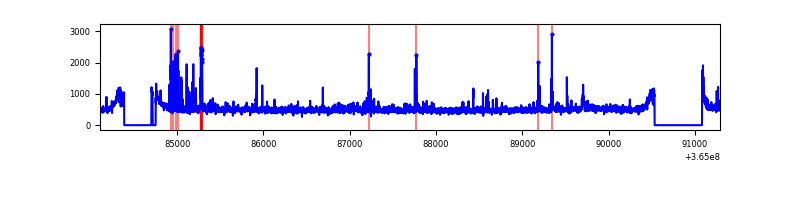 |
| D | 7183 | 6283 | 122 | 122 | 1.70% | 1.94% | 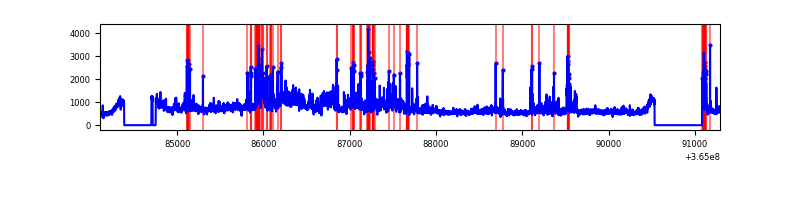 |
Top three noisy pixels from each quadrant. If the there are fewer than three noisy pixels in the level2.evt file, extra rows are filled as -1
| Pixel properties | Quadrant properties | ||||||
|---|---|---|---|---|---|---|---|
| Quadrant | DetID | PixID | Counts | Sigma | Mean | Median | Sigma |
| A | 0 | 13 | 285290 | 1791.86 | 779 | 761 | 158.8 |
| A | 13 | 254 | 12044 | 71.06 | 779 | 761 | 158.8 |
| A | 3 | 137 | 8354 | 47.82 | 779 | 761 | 158.8 |
| B | 6 | 159 | 1711059 | 11339.92 | 763 | 741 | 150.8 |
| B | 4 | 80 | 206369 | 1363.37 | 763 | 741 | 150.8 |
| B | 0 | 190 | 25434 | 163.72 | 763 | 741 | 150.8 |
| C | 3 | 233 | 168679 | 941.85 | 747 | 748 | 178.3 |
| C | 14 | 238 | 118924 | 662.8 | 747 | 748 | 178.3 |
| C | 0 | 10 | 108629 | 605.06 | 747 | 748 | 178.3 |
| D | 8 | 195 | 1508854 | 8304.76 | 754 | 733 | 181.6 |
| D | 13 | 249 | 241980 | 1328.47 | 754 | 733 | 181.6 |
| D | 12 | 79 | 197736 | 1084.83 | 754 | 733 | 181.6 |
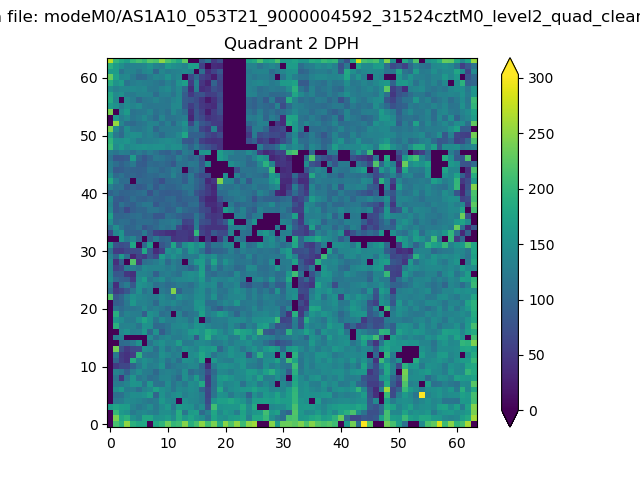
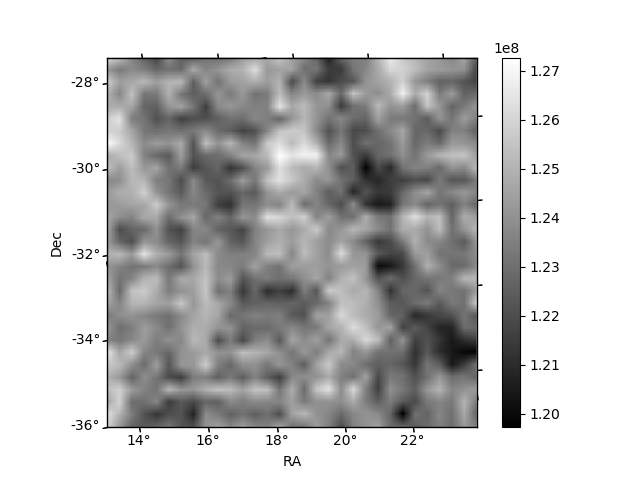
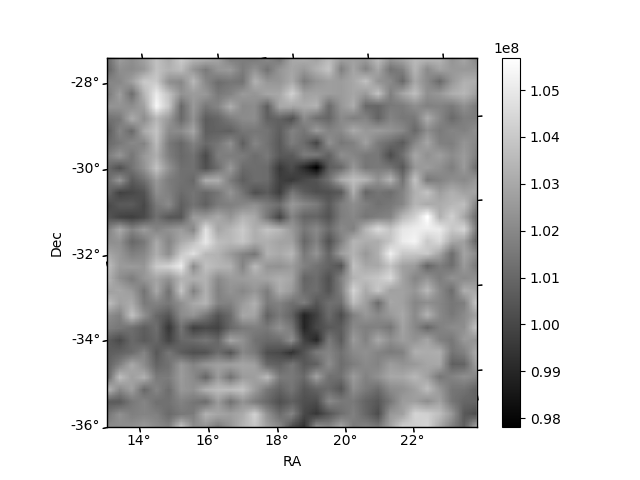
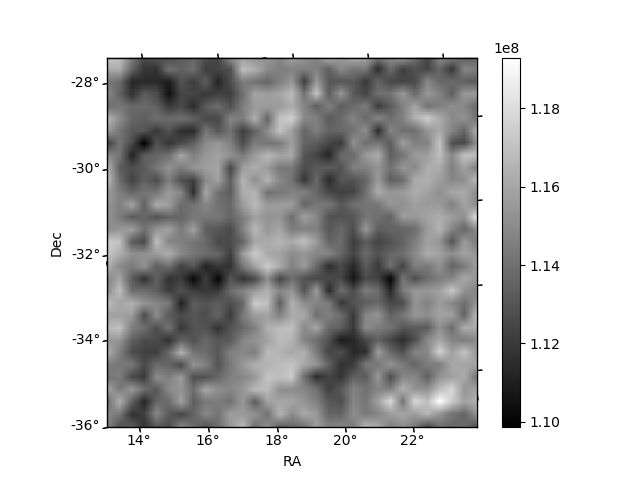
Histogram calculated using DETX and DETY for each event in the final _common_clean file
| Quadrant A | 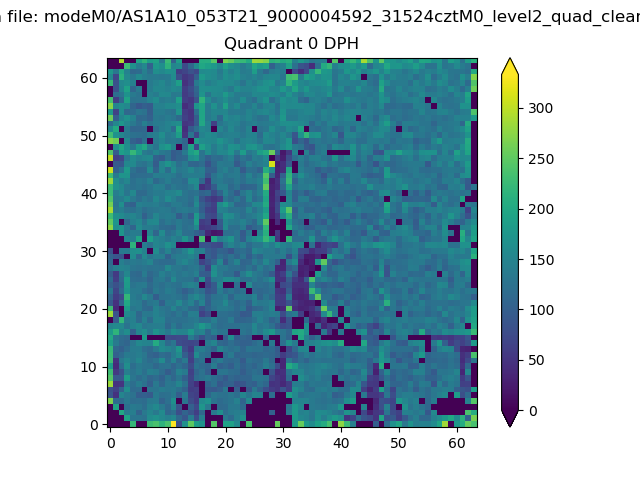 |
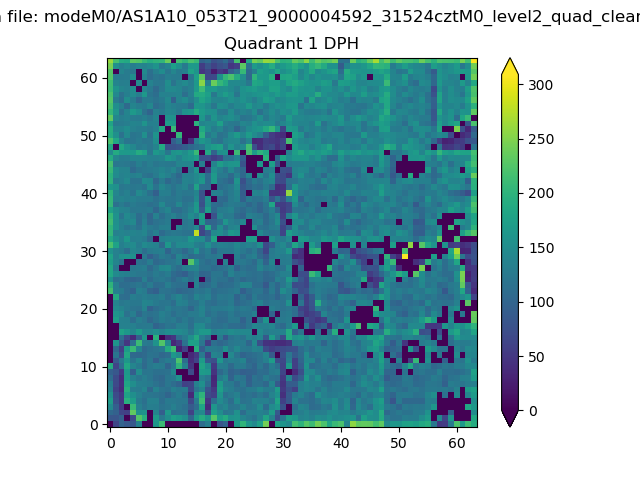 |
Quadrant B |
|---|---|---|---|
| Quadrant D | 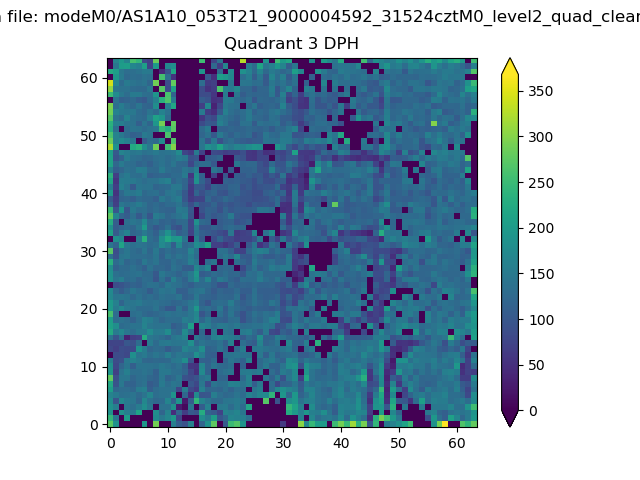 |
 |
Quadrant C |
| Plot type | Count rate plots | Images |
|---|---|---|
| Comparison with Poisson distribution Blue bars denote a histogram of data divided into 1 sec bins. Red curve is a Poisson curve with rate = median count rate of data. |
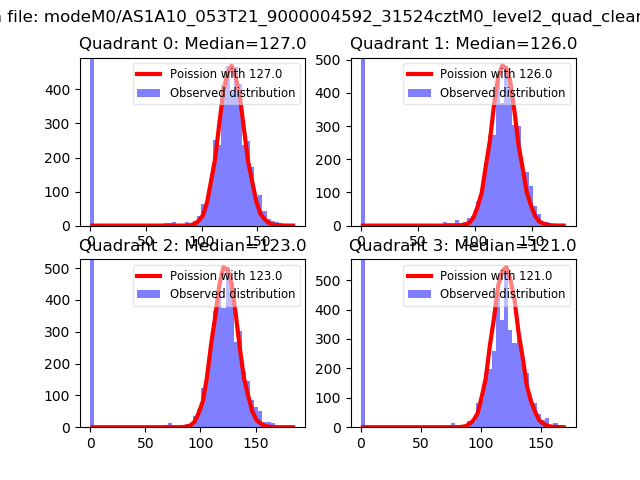 |
 |
| Quadrant-wise count rates Data is divided into 100 sec bins |
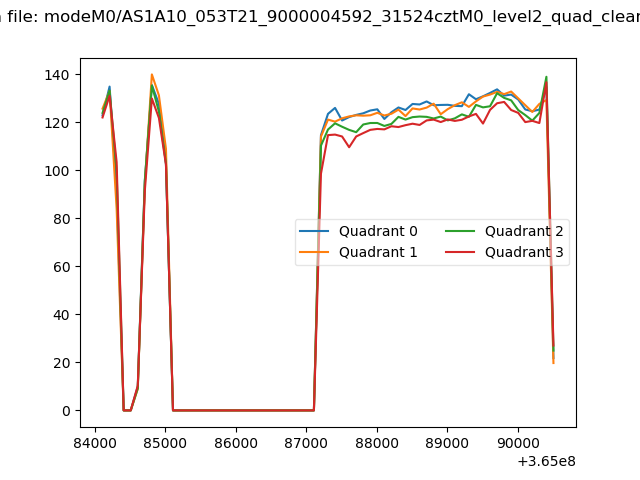 |
|
| Module-wise count rates for Quadrant A Data is divided into 100 sec bins |
 |
 |
| Module-wise count rates for Quadrant B Data is divided into 100 sec bins |
 |
 |
| Module-wise count rates for Quadrant C Data is divided into 100 sec bins |
 |
 |
| Module-wise count rates for Quadrant D Data is divided into 100 sec bins |
 |
 |
| Parameter | Plot |
|---|---|
| CZT HV Monitor | 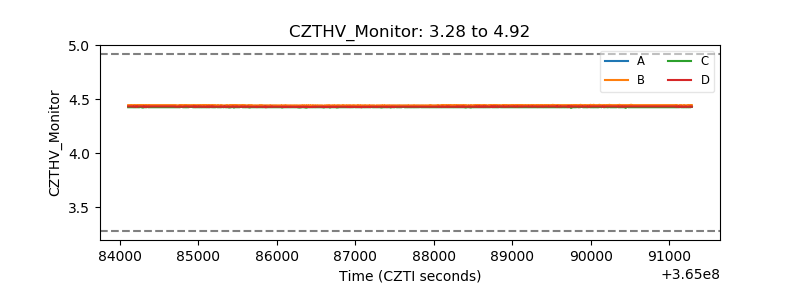 |
| D_VDD | 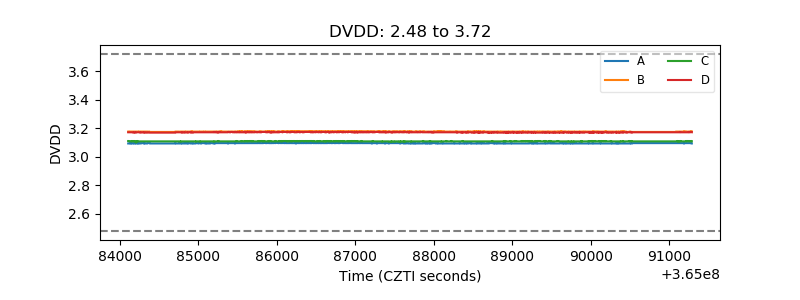 |
| Temperature 1 |  |
| Veto HV Monitor | 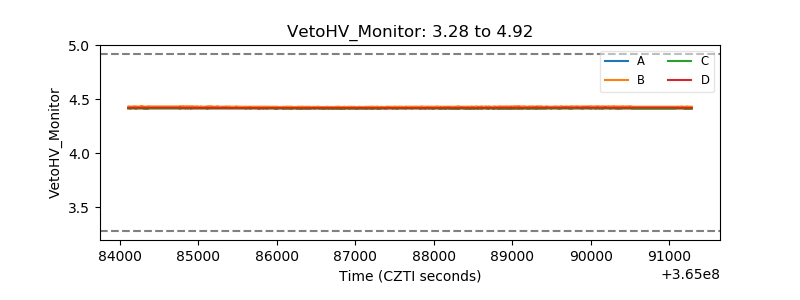 |
| Veto LLD |  |
| Alpha Counter | 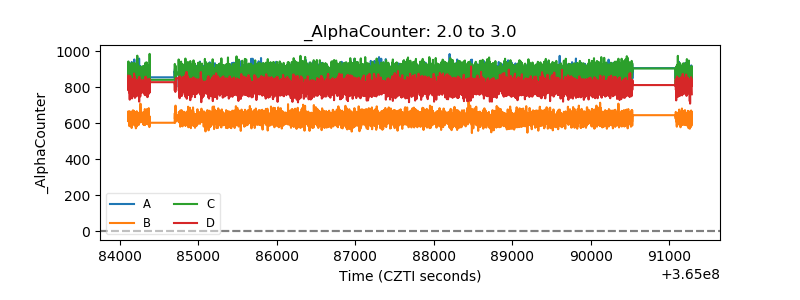 |
| _CPM_Rate | 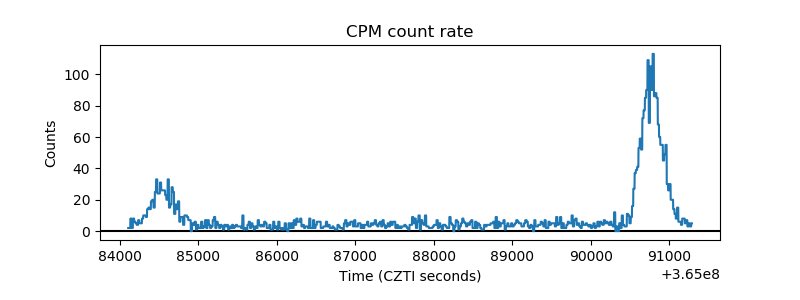 |
| CZT Counter | 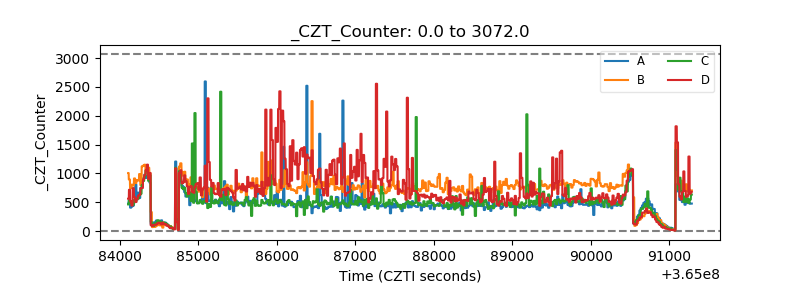 |
| +2.5 Volts monitor |  |
| +5 Volts monitor | 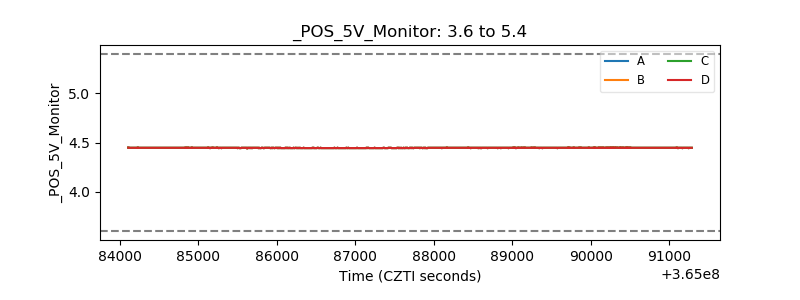 |
| _ROLL_ROT | 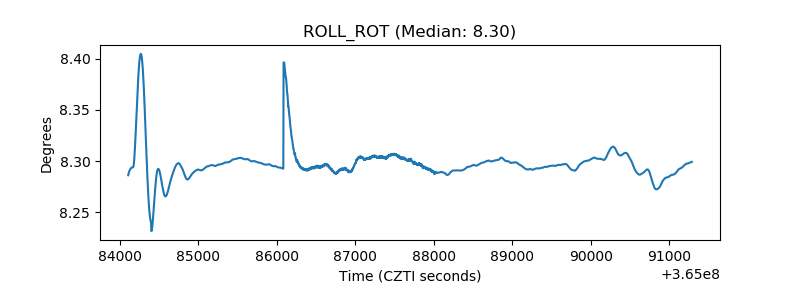 |
| _Roll_DEC | 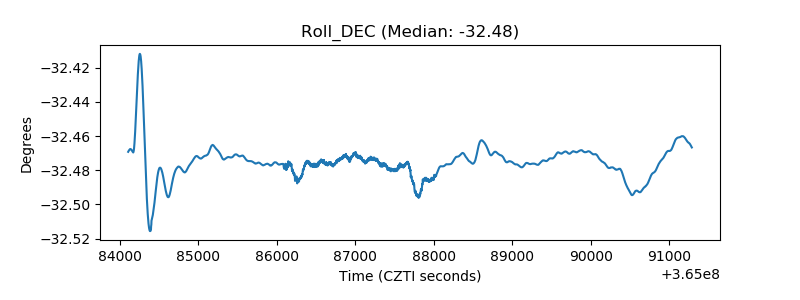 |
| _Roll_RA | 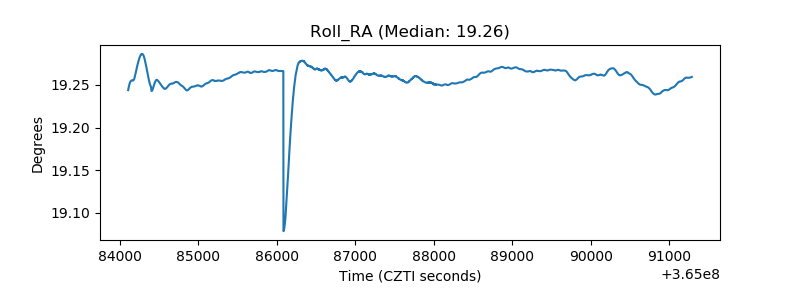 |
| Veto Counter | 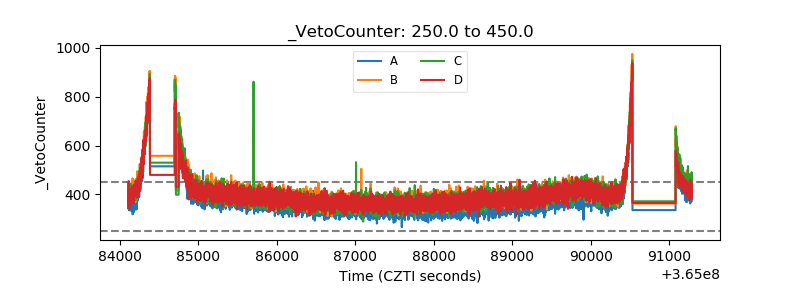 |