| Param | Original file | Final file |
|---|---|---|
| Filename | modeM0/AS1A10_053T26_9000004594cztM0_level2.fits | modeM0/AS1A10_053T26_9000004594cztM0_level2_quad_clean.evt |
| Size (bytes) | 125,804,160 | 114,433,920 |
| Size | 120.0 MB | 109.1 MB |
| Events in quadrant A | 749,444 | 681,350 |
| Events in quadrant B | 710,802 | 633,082 |
| Events in quadrant C | 756,044 | 642,079 |
| Events in quadrant D | 654,916 | 570,156 |
| Mode M0 | |||
|---|---|---|---|
| Quadrant | BADHDUFLAG | Total packets | Discarded packets |
| A | 0 | 32482 | 0 |
| B | 0 | 46323 | 0 |
| C | 0 | 30242 | 0 |
| D | 0 | 39985 | 0 |
| Mode SS | |||
|---|---|---|---|
| Quadrant | BADHDUFLAG | Total packets | Discarded packets |
| A | 0 | 274 | 0 |
| B | 0 | 274 | 0 |
| C | 0 | 274 | 0 |
| D | 0 | 274 | 0 |
| Mode M9 | |||
|---|---|---|---|
| Quadrant | BADHDUFLAG | Total packets | Discarded packets |
| A | 0 | 24 | 0 |
| B | 0 | 24 | 0 |
| C | 0 | 24 | 0 |
| D | 0 | 24 | 0 |
| Quadrant | Total seconds | Saturated seconds | Saturation percentage |
|---|---|---|---|
| A | 13583 | 917 | 6.751086% |
| B | 13583 | 933 | 6.868880% |
| C | 13583 | 275 | 2.024590% |
| D | 13583 | 588 | 4.328941% |
Noise dominated data is calculated using 1-second bins in cleaned event files. If a bin has >2000 counts, and if more than 50% of those come from <1% of pixels, then it is considered to be noise-dominated and hence unusable.
| Quadrant | # 1 sec bins | Bins with >0 counts | Bins with >2000 counts | High rate bins dominated by noise | Noise dominated (total time) | Noise dominated (detector-on time) | Marked lightcurve |
|---|---|---|---|---|---|---|---|
| A | 18233 | 13336 | 0 | 0 | 0.00% | 0.00% |  |
| B | 18234 | 13528 | 0 | 0 | 0.00% | 0.00% | 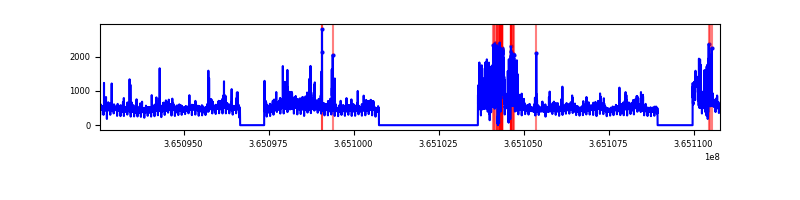 |
| C | 18234 | 13581 | 0 | 0 | 0.00% | 0.00% |  |
| D | 18234 | 13557 | 0 | 0 | 0.00% | 0.00% |  |
Top three noisy pixels from each quadrant. If the there are fewer than three noisy pixels in the level2.evt file, extra rows are filled as -1
| Pixel properties | Quadrant properties | ||||||
|---|---|---|---|---|---|---|---|
| Quadrant | DetID | PixID | Counts | Sigma | Mean | Median | Sigma |
| A | 0 | 29 | 624 | 8.61 | 195 | 183 | 51.2 |
| A | 7 | 110 | 603 | 8.2 | 195 | 183 | 51.2 |
| A | 15 | 236 | 562 | 7.4 | 195 | 183 | 51.2 |
| B | 2 | 9 | 594 | 10.45 | 188 | 179 | 39.7 |
| B | 2 | 8 | 522 | 8.63 | 188 | 179 | 39.7 |
| B | 14 | 254 | 495 | 7.95 | 188 | 179 | 39.7 |
| C | 1 | 81 | 584 | 7.46 | 200 | 187 | 53.2 |
| C | 12 | 241 | 563 | 7.07 | 200 | 187 | 53.2 |
| C | 3 | 202 | 559 | 6.99 | 200 | 187 | 53.2 |
| D | 4 | 246 | 497 | 6.31 | 186 | 169 | 52.0 |
| D | 12 | 6 | 477 | 5.92 | 186 | 169 | 52.0 |
| D | 1 | 31 | 463 | 5.65 | 186 | 169 | 52.0 |
Histogram calculated using DETX and DETY for each event in the final _common_clean file
| Quadrant A | 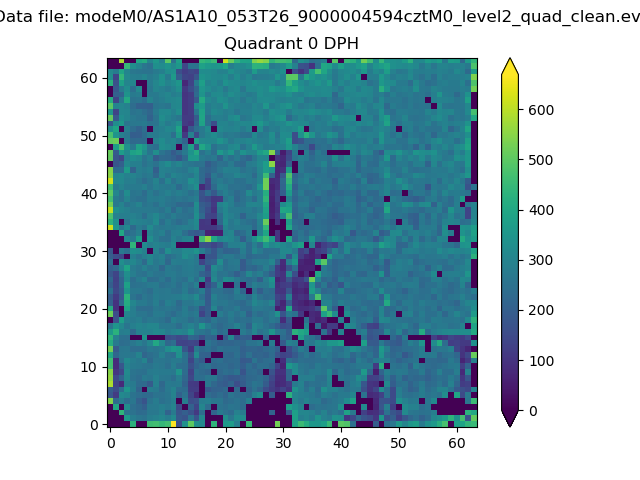 |
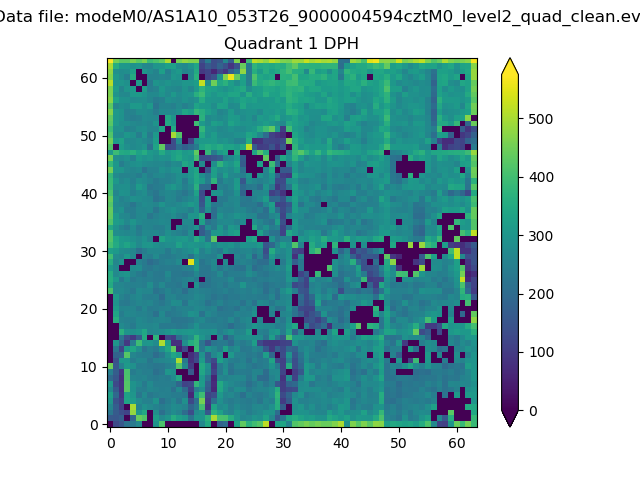 |
Quadrant B |
|---|---|---|---|
| Quadrant D |  |
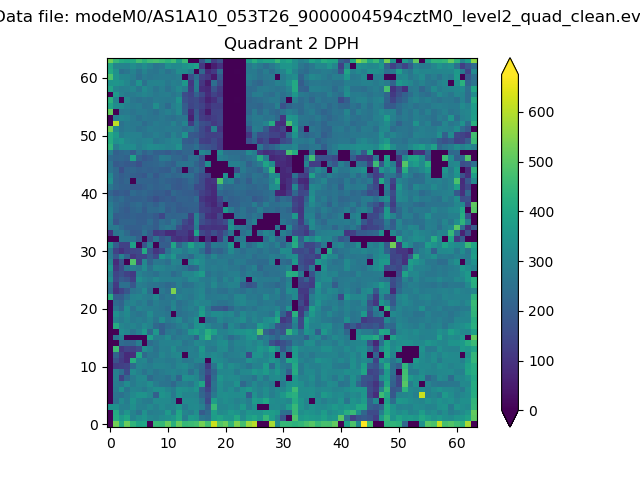 |
Quadrant C |
| Plot type | Count rate plots | Images |
|---|---|---|
| Comparison with Poisson distribution Blue bars denote a histogram of data divided into 1 sec bins. Red curve is a Poisson curve with rate = median count rate of data. |
 |
 |
| Quadrant-wise count rates Data is divided into 100 sec bins |
 |
|
| Module-wise count rates for Quadrant A Data is divided into 100 sec bins |
 |
 |
| Module-wise count rates for Quadrant B Data is divided into 100 sec bins |
 |
 |
| Module-wise count rates for Quadrant C Data is divided into 100 sec bins |
 |
 |
| Module-wise count rates for Quadrant D Data is divided into 100 sec bins |
 |
 |
| Parameter | Plot |
|---|---|
| CZT HV Monitor | 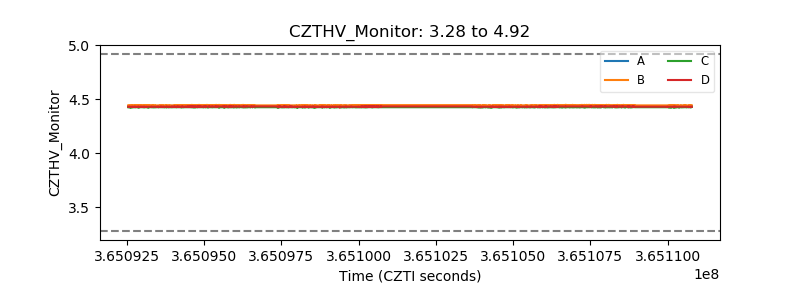 |
| D_VDD | 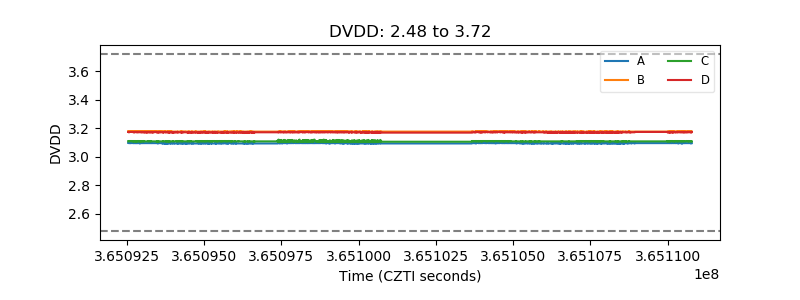 |
| Temperature 1 |  |
| Veto HV Monitor |  |
| Veto LLD | 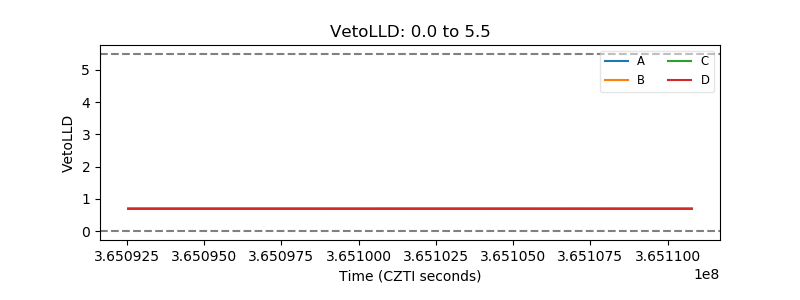 |
| Alpha Counter |  |
| _CPM_Rate |  |
| CZT Counter |  |
| +2.5 Volts monitor |  |
| +5 Volts monitor |  |
| _ROLL_ROT |  |
| _Roll_DEC |  |
| _Roll_RA | 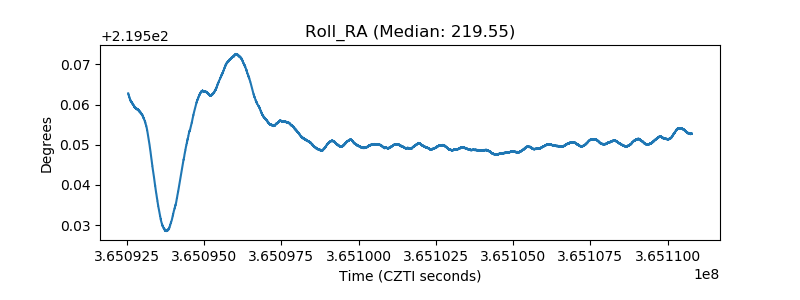 |
| Veto Counter |  |