| Param | Original file | Final file |
|---|---|---|
| Filename | modeM0/AS1A10_053T39_9000004596cztM0_level2.fits | modeM0/AS1A10_053T39_9000004596cztM0_level2_quad_clean.evt |
| Size (bytes) | 171,210,240 | 120,332,160 |
| Size | 163.3 MB | 114.8 MB |
| Events in quadrant A | 1,052,333 | 636,623 |
| Events in quadrant B | 1,027,508 | 669,160 |
| Events in quadrant C | 1,059,750 | 638,587 |
| Events in quadrant D | 934,228 | 587,341 |
| Mode SS | |||
|---|---|---|---|
| Quadrant | BADHDUFLAG | Total packets | Discarded packets |
| A | 0 | 332 | 0 |
| B | 0 | 330 | 0 |
| C | 0 | 330 | 0 |
| D | 0 | 328 | 0 |
| Mode M9 | |||
|---|---|---|---|
| Quadrant | BADHDUFLAG | Total packets | Discarded packets |
| A | 0 | 37 | 0 |
| B | 0 | 37 | 0 |
| C | 0 | 37 | 0 |
| D | 0 | 37 | 0 |
| Mode M0 | |||
|---|---|---|---|
| Quadrant | BADHDUFLAG | Total packets | Discarded packets |
| A | 0 | 41340 | 0 |
| B | 0 | 49651 | 0 |
| C | 0 | 44762 | 0 |
| D | 0 | 41988 | 0 |
| Quadrant | Total seconds | Saturated seconds | Saturation percentage |
|---|---|---|---|
| A | 16107 | 910 | 5.649718% |
| B | 16090 | 233 | 1.448104% |
| C | 16115 | 576 | 3.574310% |
| D | 16104 | 358 | 2.223050% |
Noise dominated data is calculated using 1-second bins in cleaned event files. If a bin has >2000 counts, and if more than 50% of those come from <1% of pixels, then it is considered to be noise-dominated and hence unusable.
| Quadrant | # 1 sec bins | Bins with >0 counts | Bins with >2000 counts | High rate bins dominated by noise | Noise dominated (total time) | Noise dominated (detector-on time) | Marked lightcurve |
|---|---|---|---|---|---|---|---|
| A | 19828 | 16009 | 0 | 0 | 0.00% | 0.00% |  |
| B | 19828 | 16081 | 0 | 0 | 0.00% | 0.00% |  |
| C | 19828 | 16081 | 0 | 0 | 0.00% | 0.00% |  |
| D | 19829 | 16083 | 0 | 0 | 0.00% | 0.00% |  |
Top three noisy pixels from each quadrant. If the there are fewer than three noisy pixels in the level2.evt file, extra rows are filled as -1
| Pixel properties | Quadrant properties | ||||||
|---|---|---|---|---|---|---|---|
| Quadrant | DetID | PixID | Counts | Sigma | Mean | Median | Sigma |
| A | 0 | 29 | 876 | 9.09 | 274 | 260 | 67.8 |
| A | 7 | 110 | 787 | 7.78 | 274 | 260 | 67.8 |
| A | 9 | 19 | 764 | 7.44 | 274 | 260 | 67.8 |
| B | 2 | 9 | 830 | 10.15 | 272 | 262 | 55.9 |
| B | 3 | 80 | 692 | 7.69 | 272 | 262 | 55.9 |
| B | 5 | 128 | 672 | 7.33 | 272 | 262 | 55.9 |
| C | 1 | 81 | 845 | 8.01 | 280 | 266 | 72.3 |
| C | 1 | 80 | 841 | 7.95 | 280 | 266 | 72.3 |
| C | 12 | 241 | 727 | 6.38 | 280 | 266 | 72.3 |
| D | 10 | 189 | 689 | 6.22 | 267 | 246 | 71.2 |
| D | 6 | 231 | 654 | 5.73 | 267 | 246 | 71.2 |
| D | 6 | 67 | 652 | 5.7 | 267 | 246 | 71.2 |
Histogram calculated using DETX and DETY for each event in the final _common_clean file
| Quadrant A | 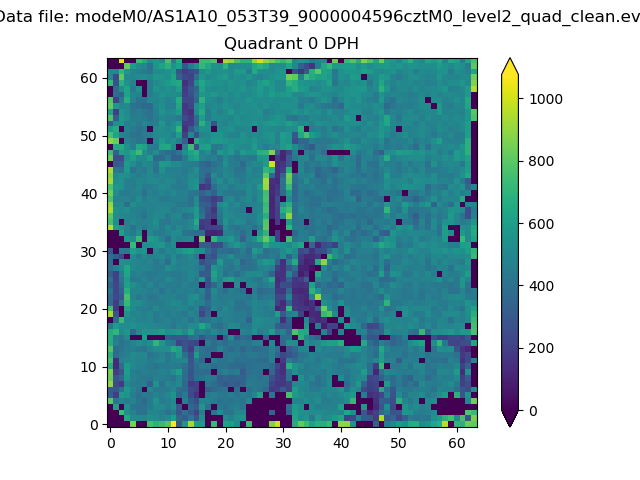 |
 |
Quadrant B |
|---|---|---|---|
| Quadrant D |  |
 |
Quadrant C |
| Plot type | Count rate plots | Images |
|---|---|---|
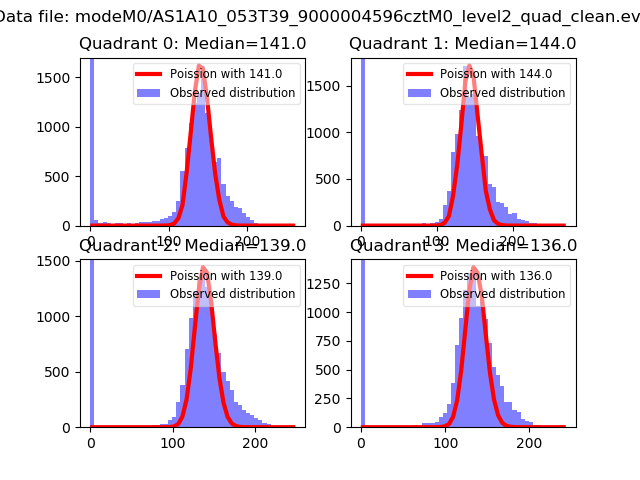
| Comparison with Poisson distribution Blue bars denote a histogram of data divided into 1 sec bins. Red curve is a Poisson curve with rate = median count rate of data. |
 |
 |
| Quadrant-wise count rates Data is divided into 100 sec bins |
 |
|
| Module-wise count rates for Quadrant A Data is divided into 100 sec bins |
 |
 |
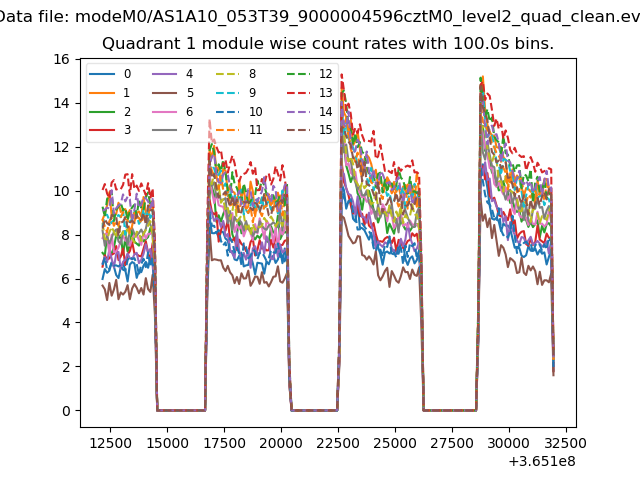
| Module-wise count rates for Quadrant B Data is divided into 100 sec bins |
 |
 |
| Module-wise count rates for Quadrant C Data is divided into 100 sec bins |
 |
 |
| Module-wise count rates for Quadrant D Data is divided into 100 sec bins |
 |
 |
| Parameter | Plot |
|---|---|
| CZT HV Monitor |  |
| D_VDD | 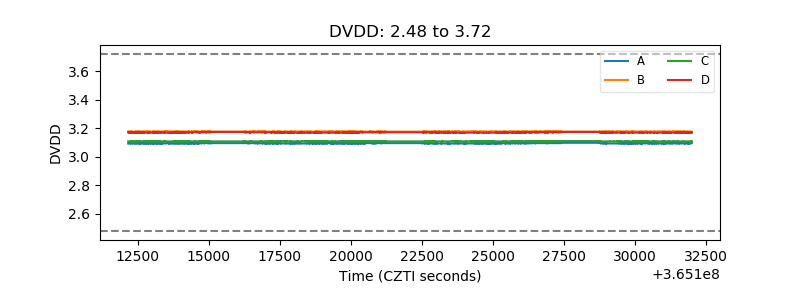 |
| Temperature 1 |  |
| Veto HV Monitor |  |
| Veto LLD | 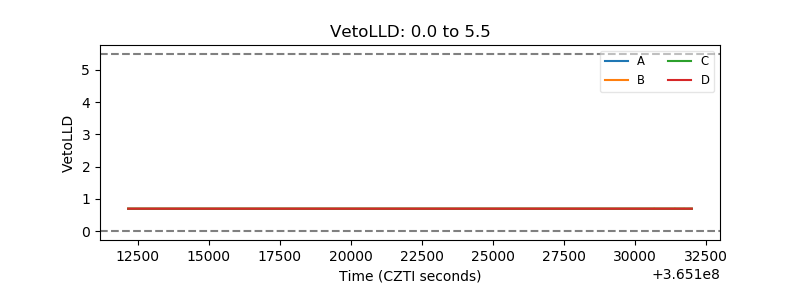 |
| Alpha Counter |  |
| _CPM_Rate | 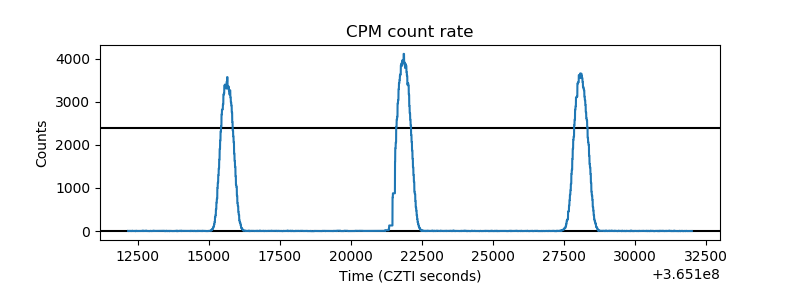 |
| CZT Counter |  |
| +2.5 Volts monitor |  |
| +5 Volts monitor |  |
| _ROLL_ROT |  |
| _Roll_DEC |  |
| _Roll_RA | 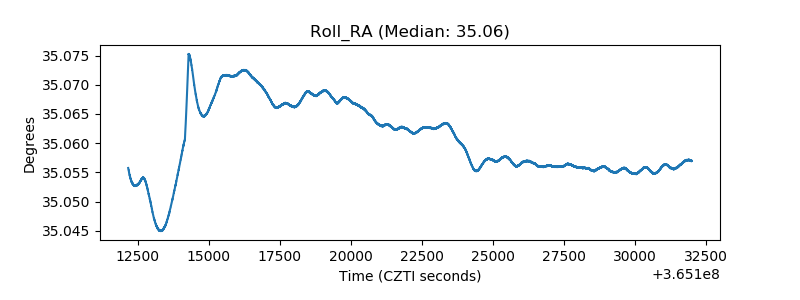 |
| Veto Counter |  |