| Param | Original file | Final file |
|---|---|---|
| Filename | modeM0/AS1A10_053T39_9000004596_31524cztM0_level2.evt | modeM0/AS1A10_053T39_9000004596_31524cztM0_level2_quad_clean.evt |
| Size (bytes) | 484,588,800 | 59,973,120 |
| Size | 462.1 MB | 57.2 MB |
| Events in quadrant A | 3,823,991 | 351,945 |
| Events in quadrant B | 3,317,511 | 410,069 |
| Events in quadrant C | 3,507,124 | 387,523 |
| Events in quadrant D | 3,746,620 | 373,995 |
| Mode SS | |||
|---|---|---|---|
| Quadrant | BADHDUFLAG | Total packets | Discarded packets |
| A | 0 | 86 | 0 |
| B | 0 | 86 | 0 |
| C | 0 | 86 | 0 |
| D | 0 | 86 | 0 |
| Mode M9 | |||
|---|---|---|---|
| Quadrant | BADHDUFLAG | Total packets | Discarded packets |
| A | 0 | 11 | 0 |
| B | 0 | 11 | 0 |
| C | 0 | 11 | 0 |
| D | 0 | 11 | 0 |
| Mode M0 | |||
|---|---|---|---|
| Quadrant | BADHDUFLAG | Total packets | Discarded packets |
| A | 0 | 14111 | 1 |
| B | 0 | 12825 | 9 |
| C | 0 | 13200 | 1 |
| D | 0 | 14028 | 8 |
| Quadrant | Total seconds | Saturated seconds | Saturation percentage |
|---|---|---|---|
| A | 4141 | 745 | 17.990823% |
| B | 4138 | 76 | 1.836636% |
| C | 4140 | 351 | 8.478261% |
| D | 4139 | 237 | 5.726021% |
Noise dominated data is calculated using 1-second bins in cleaned event files. If a bin has >2000 counts, and if more than 50% of those come from <1% of pixels, then it is considered to be noise-dominated and hence unusable.
| Quadrant | # 1 sec bins | Bins with >0 counts | Bins with >2000 counts | High rate bins dominated by noise | Noise dominated (total time) | Noise dominated (detector-on time) | Marked lightcurve |
|---|---|---|---|---|---|---|---|
| A | 5291 | 4141 | 538 | 538 | 10.17% | 12.99% | 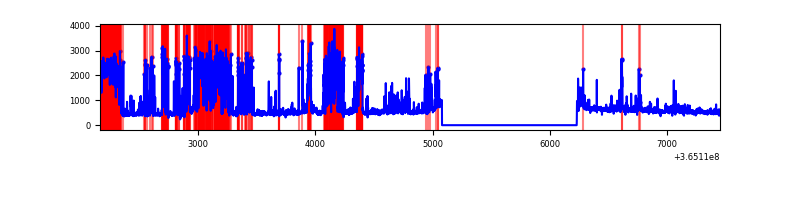 |
| B | 5290 | 4140 | 1 | 1 | 0.02% | 0.02% | 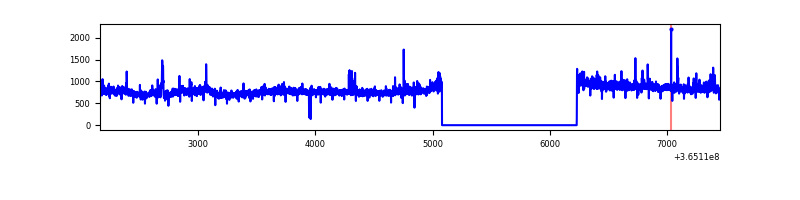 |
| C | 5290 | 4140 | 52 | 52 | 0.98% | 1.26% | 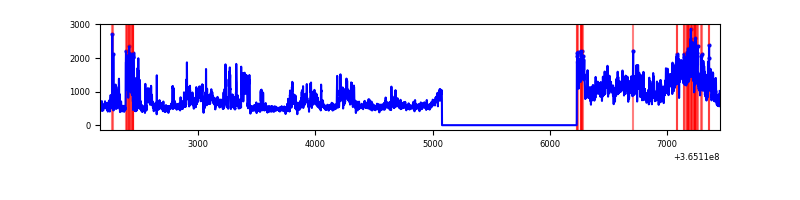 |
| D | 5290 | 4140 | 182 | 182 | 3.44% | 4.40% | 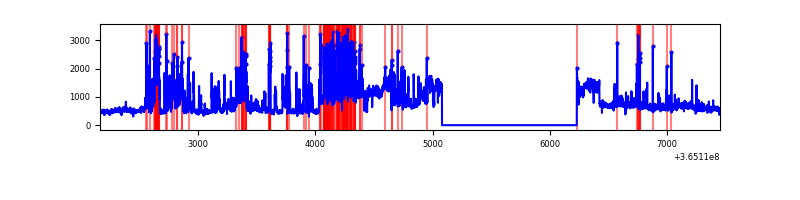 |
Top three noisy pixels from each quadrant. If the there are fewer than three noisy pixels in the level2.evt file, extra rows are filled as -1
| Pixel properties | Quadrant properties | ||||||
|---|---|---|---|---|---|---|---|
| Quadrant | DetID | PixID | Counts | Sigma | Mean | Median | Sigma |
| A | 0 | 13 | 1935933 | 19595.8 | 489 | 480 | 98.8 |
| A | 13 | 254 | 7046 | 66.48 | 489 | 480 | 98.8 |
| A | 3 | 137 | 4762 | 43.35 | 489 | 480 | 98.8 |
| B | 6 | 159 | 1140060 | 11148.42 | 527 | 513 | 102.2 |
| B | 4 | 80 | 55699 | 539.9 | 527 | 513 | 102.2 |
| B | 0 | 190 | 29486 | 283.45 | 527 | 513 | 102.2 |
| C | 3 | 233 | 1419591 | 11821.93 | 508 | 513 | 120.0 |
| C | 14 | 238 | 80586 | 667.07 | 508 | 513 | 120.0 |
| C | 2 | 114 | 9667 | 76.26 | 508 | 513 | 120.0 |
| D | 8 | 195 | 883345 | 7355.81 | 508 | 494 | 120.0 |
| D | 11 | 176 | 806714 | 6717.33 | 508 | 494 | 120.0 |
| D | 12 | 233 | 38992 | 320.76 | 508 | 494 | 120.0 |
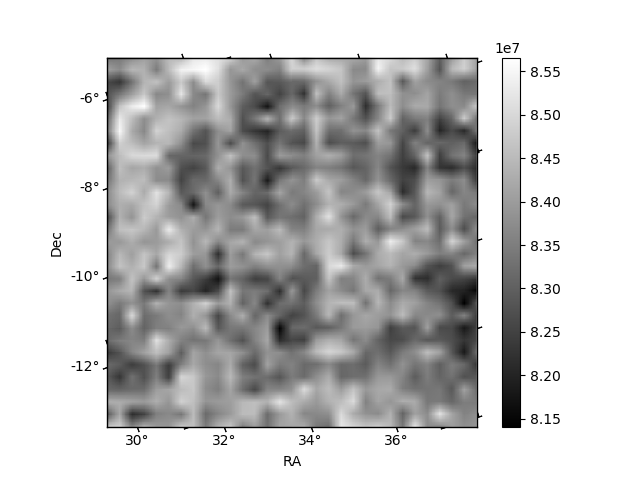
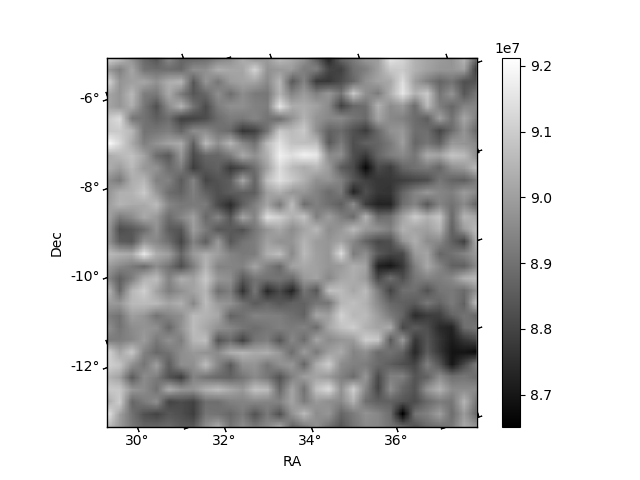
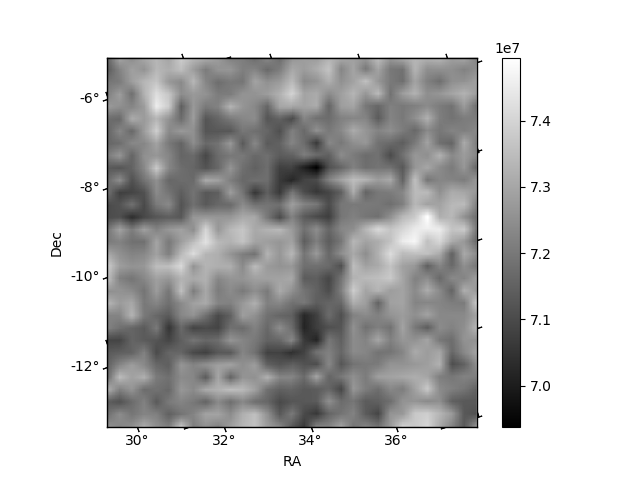
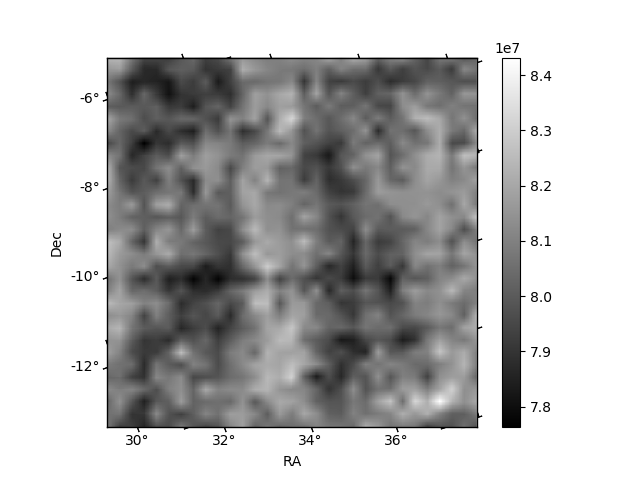
Histogram calculated using DETX and DETY for each event in the final _common_clean file
| Quadrant A |  |
 |
Quadrant B |
|---|---|---|---|
| Quadrant D | 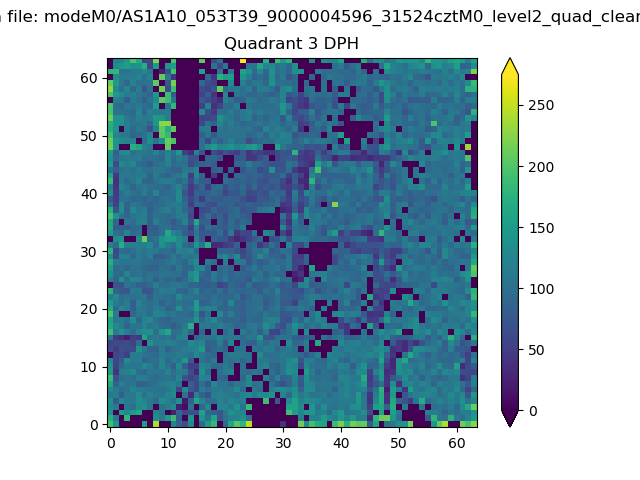 |
 |
Quadrant C |
| Plot type | Count rate plots | Images |
|---|---|---|
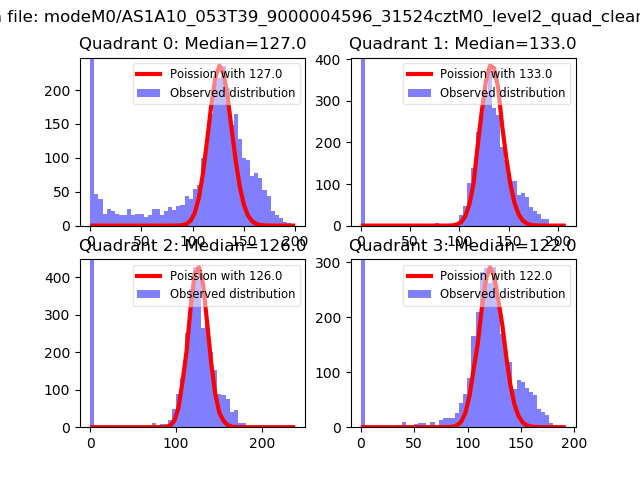
| Comparison with Poisson distribution Blue bars denote a histogram of data divided into 1 sec bins. Red curve is a Poisson curve with rate = median count rate of data. |
 |
 |
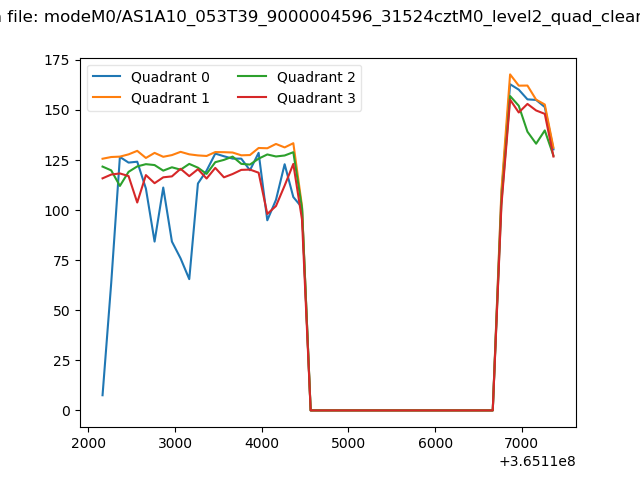
| Quadrant-wise count rates Data is divided into 100 sec bins |
 |
|
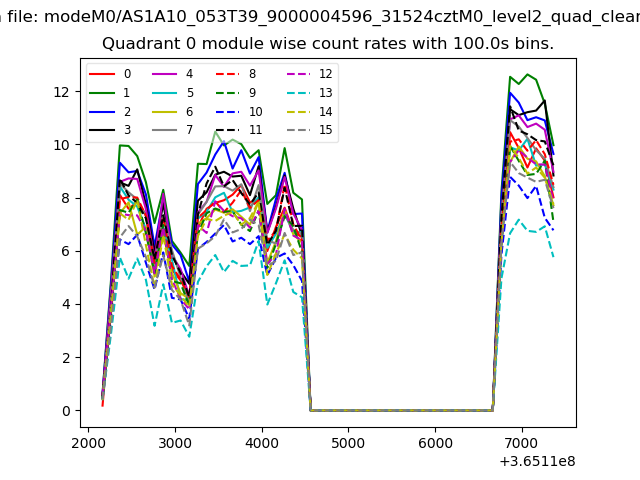
| Module-wise count rates for Quadrant A Data is divided into 100 sec bins |
 |
 |
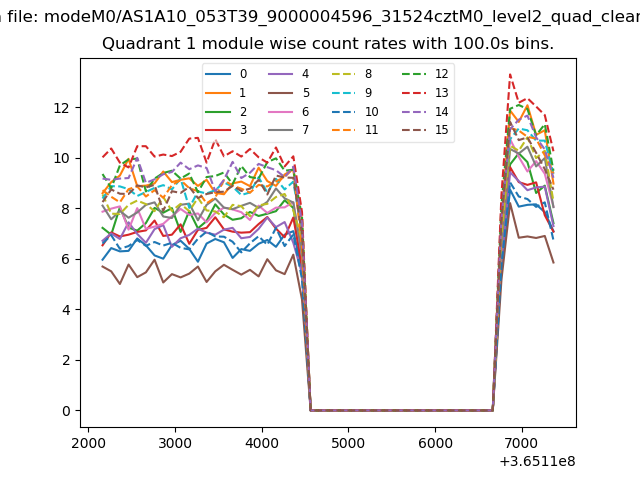
| Module-wise count rates for Quadrant B Data is divided into 100 sec bins |
 |
 |
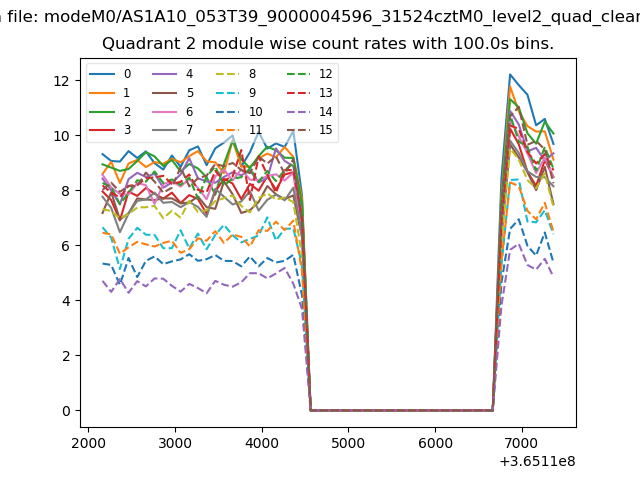
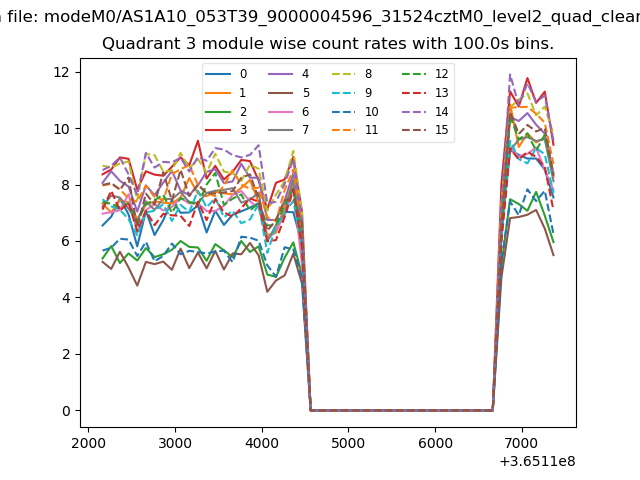
| Module-wise count rates for Quadrant C Data is divided into 100 sec bins |
 |
 |
| Module-wise count rates for Quadrant D Data is divided into 100 sec bins |
 |
 |
| Parameter | Plot |
|---|---|
| CZT HV Monitor | 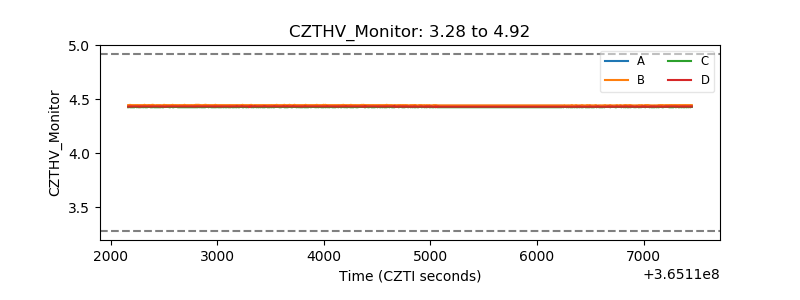 |
| D_VDD | 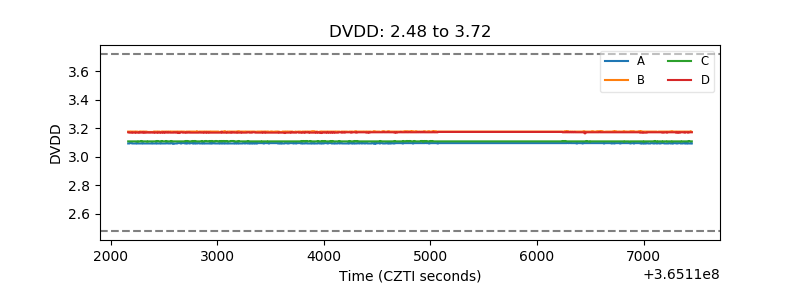 |
| Temperature 1 | 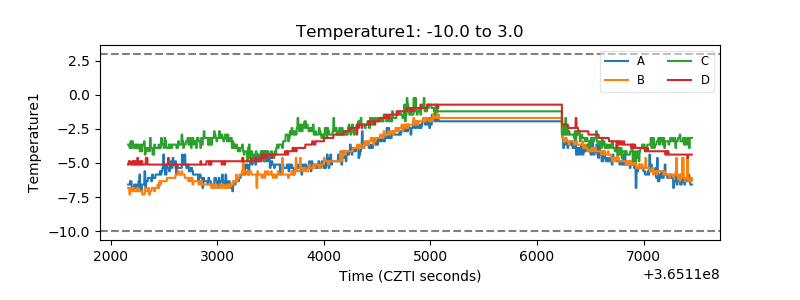 |
| Veto HV Monitor | 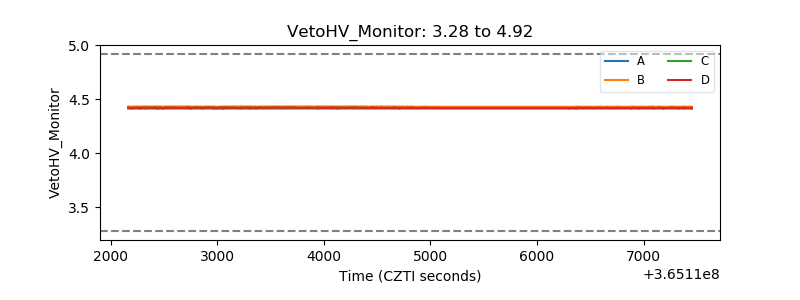 |
| Veto LLD | 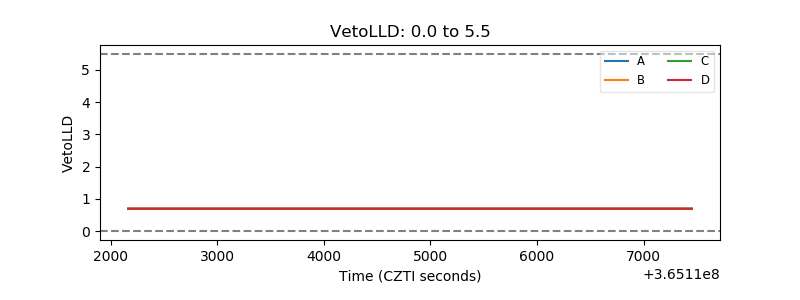 |
| Alpha Counter | 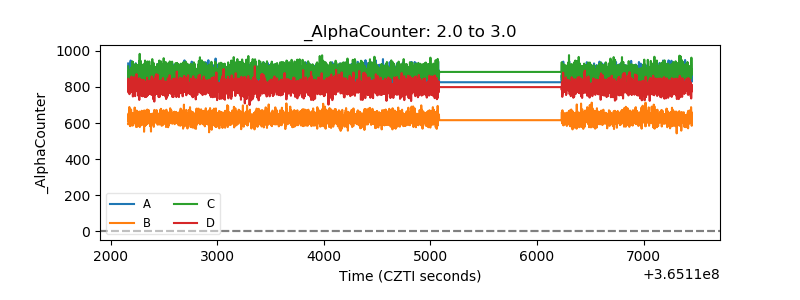 |
| _CPM_Rate | 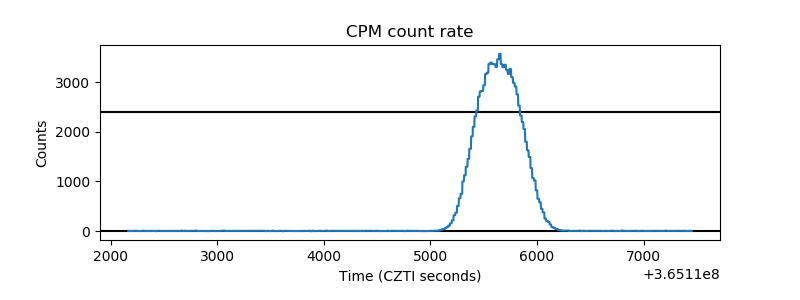 |
| CZT Counter | 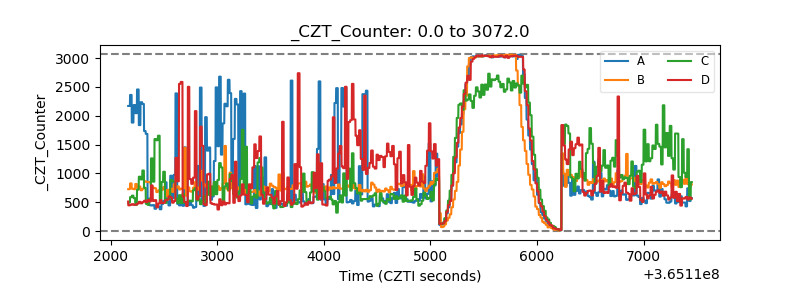 |
| +2.5 Volts monitor |  |
| +5 Volts monitor |  |
| _ROLL_ROT | 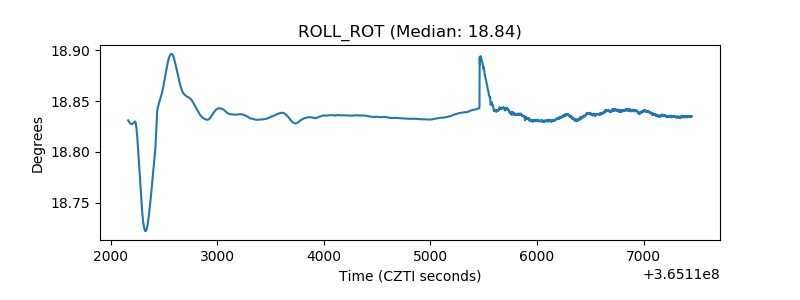 |
| _Roll_DEC | 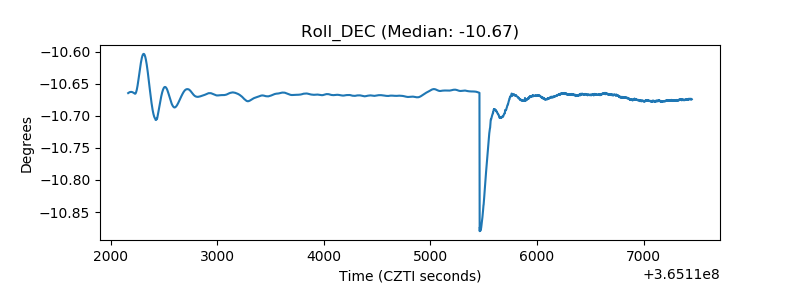 |
| _Roll_RA | 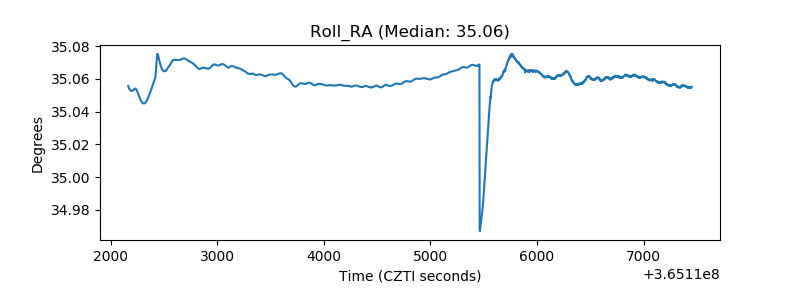 |
| Veto Counter | 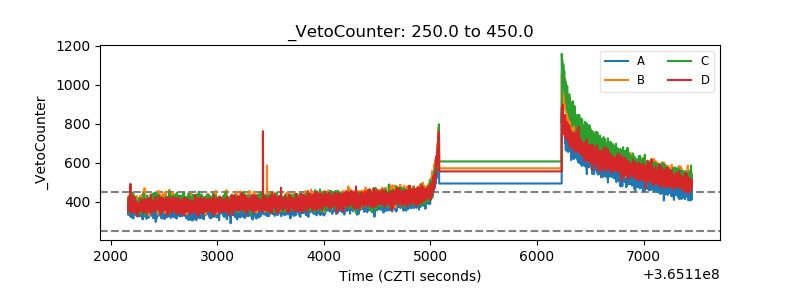 |